Tài liệu Ozonation of Cooling Tower Water: A Case Study ppt
Bạn đang xem bản rút gọn của tài liệu. Xem và tải ngay bản đầy đủ của tài liệu tại đây (350.79 KB, 36 trang )
Ozonation of Cooling Tower Water: A Case Study
by Stephen Osgood
Water Conservation Unit
East Bay Municipal Utility District
June 1991
Completed under Contract to the
California Department of Water Resources
Water Conservation OfficeOzonation of Cooling Tower Water: A Case Study
by Stephen Osgood,
Water Conservation Unit
East
Bay
Municipal Utility District
Summary
In 1988,
Providence Hospital in Oakland,
California changed the
method it uses to treat the water in two cooling towers,
replacing a multiple chemical treatment program with ozone gas
treatment.
As a result,
the hospital reduced water use feeding
the cooling towers by 13 percent.
In addition,
after changing
the cooling tower water treatment, the hospital:
more than doubled the cycles of concentration (based on
conductivity),
eliminated fouling and scaling of exposed surfaces,
experienced no new scaling of exposed surfaces,
dramatically improved water clarity,
greatly reduced bacteria levels,
achieved low corrosion rates,
experienced minor pitting and scaling of heat exchange
tubes,
discovered corrosion of condenser tube end bells, and
replaced two fan motors due to corrosion.
On the whole,
the hospital is pleased with the performance of the
ozone system.
It values ozone's excellent microbiological
control and environmental compatibility.
It does not believe
there has been any serious destruction of equipment.
Consequently,
the hospital has not only continued to use ozone in
the cooling towers of the main building, it has also recently
selected ozone to replace a multiple chemical treatment program
at the cooling tower in a second building.
The experience at this site suggests that ozone treatment of
cooling tower water should be considered at least where the
following conditions are met:
the cooling water's chief function is to remove heat
from medium sized heating, ventilation, and air
conditioning (HVAC) systems;
the ozone system is well designed, monitored, and
maintained:
the makeup water quality is low in dissolved solids.
1
Report Contents
The purpose of this report is to describe the technology employed
and the results it achieved. The next few sections provide
background information on the use and treatment of recirculating
cooling water systems.
Details then follow of the technology
employed at the study site, the water savings, other results, and
the costs and savings.
The report identifies factors that should
be taken into account when ozone is considered for cooling tower
water treatment, and ends with a brief discussion of the
potential for ozone technology to be adopted throughout
California.
Open Recirculating Cooling Systems
Water gains heat when used for cooling.
To be reused, the
water's temperature must be reduced, typically by passing it
through a cooling tower.
In a cooling tower the warm water
enters at the top and spreads down over numerous vertical panels.
The large surface area facilitates evaporation, which lowers the
temperature of the water that remains behind.
When needed, a fan
boosts air flow across the water,
thereby increasing evaporation
and heat loss.
The air expelled by the fan can also carry off
water droplets ("drift").
"Makeup"
water is added to replace
what is lost by evaporation and drift.
The cooled water collects
in a basin at the bottom of the tower, from where it is
recirculated to again perform its cooling function.
As water evaporates, dissolved solids remain behind and increase
in concentration.
The extent to which this occurs is referred to
as the cycles of concentration,
also known as the concentration
ratio,
which is the
ratio of the quantity of dissolved solids in
the cooling tower water to that in the makeup water.
(For
example, given makeup water with Total Dissolved Solids (TDS) of
58 parts per million (ppm),
a cooling tower with water at 145 ppm
TDS would be operating at- 2.5 cycles of concentration.) A
continuing increase in dissolved solids can lead to salts of
calcium,
magnesium,
or silica precipitating out of solution and
forming scale deposits on cooling system surfaces.
To dilute the
water and minimize scaling,
the concentrated water of the cooling
tower is discharged and is then replaced by an equivalent volume
of fresh makeup water.
(The discharge is referred to as "bleed
off",
or "blowdown")
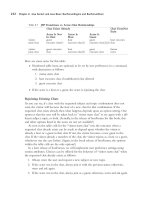
A cooling tower operating at relatively high cycles of
concentration will save water compared to a similar one operating
at lower cycles.
This is because the tower with higher cycles
has less blowdown and less makeup water use.
However,
as shown
in Figures 1 and 2,
the relationship between cycles of
concentration and blowdown is not a simple linear one.
The most
dramatic water savings are achieved when one moves from very low
2
As the number of
cycles increases further, more water is saved, but the
incremental reduction in blowdown and makeup becomes less
significant.
Operating a recirculating cooling system also presents other
problems that need to be controlled.
Warm recirculating waters
provide an ideal environment for microbiological growth, which
can result in the formation of slimes on equipment surfaces.
Microbes,
such as Legionnaires Disease bacteria (Legionella
pneumophila),
may threaten the health of people exposed to
airborne water droplets.
Workers who clean the inside of
condenser heat exchange tubes may also be exposed to
Legionella.
1
At a hospital,
where weakened patients are
particularly susceptible to infectious organisms and health
professionals are frequently exposed to pathogens, the control of
microbial growth in cooling tower water is critical.
Corrosion is another problem to be minimized.
It not only
destroys metal surfaces,
it also produces deposits which can
contribute to the fouling of surfaces.
Airborne particles (such
as dust from construction) can enter the recirculating water and
also contribute to fouling.
Scale,
slimes,
and other types of
fouling,
when present on heat exchanging surfaces, act as
insulators,
decreasing the efficiency of the heat transfer.
This
can lead to inadequate cooling or, at the least, to an increase
in the amount of energy expended to produce the same amount of
cooling.
2
Multiple Chemical Treatment
Recirculating cooling waters are often treated by adding
chemicals which are selected to control one or more of the
problems of biological growth, scale, corrosion, and fouling.
The following types of chemicals are available:
biocidal poisons (must be EPA registered),
oxidizing biocides (must be EPA registered),
corrosion inhibitors which form a protective film over
metal areas,
acids or other scale inhibitors which prevent mineral
precipitation,
conditioners which decrease the density of any scale
particles which form,
allowing the particles to be more
easily carried off by the flowing water,
dispersants which increase foulants' electrical
charges,
causing them to repel each other, and
wetting agents which reduce the water's surface tension
so that particles are less likely to adhere to
surfaces.
Maintaining correct water quality involves controlling the rates
of blowdown and makeup water flow and involves adding chemicals
in correct amounts at proper
times.
This,
in turn,
requires
insuring the compatibility of the chemicals, and requires
monitoring and controlling pH and conductivity.
Chemical treatment carries with it the risks and responsibilities
of storing and handling hazardous materials.
In addition, it is
undesirable to discharge toxic chemicals to aquatic ecosystems or
to wastewater treatment plants that rely on bacterial activity.
Ozone Treatment
Ozonation,
in contrast to traditional chemical treatment,
involves the on site generation of a single oxidizing agent which
is mixed into the recirculating water.
Typically,
ozone is produced by the corona discharge method, in
which dry air is passed through a gap between a highly
electrically charged surface and a grounded surface.
When
electrical discharges occur across the gap, some of the oxygen in
the air is converted to ozone gas.
Potential benefits.
As a highly powerful oxidant, ozone destroys
microorganisms which may threaten health (including Leoionella
pneumophila
3
),
foul cooling system surfaces, encourage the
buildup of other deposits,
or contribute to corrosion.
Ozonation has also been reported to achieve higher cycles of
concentration than multi-chemical treatment.
4
Since there is
less blowdown at higher cycles,
ozonation offers the potential to
save water.
In addition,
when slightly alkaline water (pH
greater than 7) is concentrated,
the alkalinity becomes even more
pronounced.
Operating cooling towers at higher cycles of
concentration thus creates a more alkaline condition, reducing
corrosivity.
5
Ozone also has been promoted as an effective method of directly
controlling corrosion and scale.
6
Environmental and Safety Aspects.
Highly reactive, ozone resides
only briefly in water.
(Its half-life in distilled water is 20
to 30 minutes,
and in cooling tower water, where there are
oxidizable impurities, 1 to 3 minutes.)
7
As a result, the
treated cooling water can be discharged safely to the sewer
system.
Even if there were some residual ozone in the discharge,
it would be quickly consumed by other wastes in the sewer line.
Thus ozone poses virtually no threat to sewage treatment plants
or aquatic ecosystems.
Since an ozone generator will produce the gas at concentrations
of just 1 to 3 percent by weight in air,
the resulting ozone/air
5
mixture is not explosive.
8
Ozone is a toxic gas.
The maximum average allowable ozone
concentration to which workers in California may be exposed over
an 8 hour day is 0.1 ppm.
The short term exposure limit (maximum
allowable average concentration over any 15 minute period) is
0.3 ppm.
9
By contrast,
ozone gas can be detected by smell at
concentrations as low as 0.02 ppm
1O
,
well below the exposure
limit.
It is conceivable, however,
that a gradual increase in
ozone concentration might not be noticed by someone working close
to an ozonated tower.
Study Site
Facility.
Providence Hospital ("Providence") in Oakland,
California (a coastal city) receives fresh water and wastewater
treatment services from East Bay Municipal Utility District
(EBMUD).
Equipped to provide both acute and chronic medical
care,
the hospital houses 228 beds and employs 720 people.
The
main hospital building,
which utilizes the cooling system
discussed in this report,
has a floor area of approximately
275,000 square feet.
Cooling system.
Air conditioning is commonly referred to as
"comfort cooling,"
which suggests it is a luxury.
In a hospital,
however,
the air temperature is of vital concern, both in the
operating room and in patient rooms.
Providence's cooling
system depends on two chillers which use the water from the
cooling towers (at 85°F) to produce chilled water (at 48°F) by
means of a condensed refrigerant.
The chillers pump the chilled
water to points in the hospital where it cools indoor air, or
performs other functions.
After the chilled water absorbs heat
at the point of application,
it returns in a closed loop to the
chillers,
where the heat is transferred to an internally
recirculated refrigerant.
The refrigerant warms and expands. In
the condenser section of the chiller,
the refrigerant is passed
over copper tubes through-which passes the water from the cooling
towers.
The heat from the refrigerant is transferred to the
water returning to the cooling towers.
Finally,
the cooling
towers release the waste heat to the environment, in the form of
water vapor.
Table 1 lists characteristics of the hospital's
cooling system and cooling towers.
Table 1.
Cooling System Characteristics, Providence Hospital
Chiller capacity
354 Tons (425,000 BTU/hr.)
Chiller operation (ave.)
85% of capacity (300 Tons)
Cooling temp. change (at)
6°F
11
Water recirculation capacity
1800 gpm
Recirculation pump
20 HP
Cooling tower capacity (each)
300 Tons (360,000 BTU/hr.)
Cooling tower operation
300 Tons (combined)
(average over year)
primary
- 75%
of capacity
secondary - 25% of capacity"
Cooling tower type
2 induced draft, crossflow
towers,
with connected basins
Ozone generation principle
corona discharge
Ozone generator manufacturer
PCI Ozone Corp.,
modified by NWMC
Ozone generator capacity
3 lb./day
Ozone generator operation
65%
of capacity
Water flow,
0
3
, injection loop
60 gpm
Cooling towers.
The cooling towers are about 15 years old, each
with a capacity to remove 360,000 BTU's of heat per hour (300
tons).
Their basins are interconnected, and fans at the top of
the towers induce an upward flow of air when they are engaged.
Although water flows continuously through both towers, during
most of the year only one fan is needed to boost air flow, and it
engages intermittently.
Only on the hottest days of the year
does the extra heat load cause the fan on the secondary tower to
engage.
With the primary tower operating at approximately 75% of
capacity and the secondary tower operating in the vicinity of 25%
of capacity
tons.
together they bear an average heat load of 300
Effective biological control of cooling tower water is important
at the hospital.
Windows in one of the hospital buildings which
overlook the towers are often kept open for ventilation.
These
rooms,
which are used for office space, may at times be exposed
to cooling tower drift.
Additionally,
the engineering section
must report quarterly on the biological condition of the cooling
tower to the hospital's quality assurance team, which is charged
with ensuring compliance with hospital accreditation
requirements.
Windows in both the main hospital building and the
7
new Medical Office Building (MOB) overlook the towers and may be
exposed to cooling tower drift.
Makeup water.
The hospital uses drinking water supplied by EBMUB
as its source of makeup water for the cooling towers.
Since 95%
of EBMUD water is treated runoff from California's Sierra-Nevada,
it is low in dissolved solids.
Table 2 shows selected EBMUD
water quality characteristics during the 1980's, when the hospital
switched its cooling tower water treatment.
The hospital has its own internal water meter which registers
quantities of makeup water flowing to the cooling towers.
Providence staff read the meter twice daily.
8
Table 2.
Selected EBMUD Water Quality Characteristics
Parameter
Microbiological
Units
Average*
Total Coliform Bacteria
0.07
per 100 milliliters
Chlorine
parts per million (ppm)
0.35
Corrosivity
Mils per year
3
(0.001 in./yr.)
Chloride
ppm
3.6
Total Dissolved Solids
ppm
58
Specific Conductance
micromho per centimeter
73
Hardness
ppm of CaCO
3
33
* Averages were determined over a 9 year period (1980 - 1988)
Source:
"EBMUD: Quality on Tap"',
EBMUD Public Affairs Dept.,
Sept/Oct 1989.
9
Multiple chemical treatment program.
Prior to 1988, the hospital
used several chemicals to treat its cooling water: a corrosion
and deposit inhibitor, two microbiocides, a dispersant, and an
antifoaming agent.
The corrosion and deposit inhibitor was fed automatically to the
makeup water.
When the water returning from the chillers to the
cooling tower rose above a set level of conductivity, a valve
would open to bleed off some of the water.
Simultaneously, the
corrosion and deposit inhibitor would be injected into the water
that returned to the tower.
All other chemicals were added manually.
The microbiocides and
dispersant were added approximately once a week; the anti-foaming
agent was added as needed.
The representative of the chemical vendor checked monthly on the
condition of the cooling towers and the chemical feed system.
Ozone treatment program.
In early 1988 Providence began use of
an ozonation system owned and installed by National Water
Management Corporation (NWMC).
The hospital terminated manual
chemical additions and started relying on ozone at the beginning
of March, 1988.
The hospital supplies three utilities to the ozone equipment:
compressed air,
high voltage direct current, and telephone lines.
Providence pays NWMC a monthly fee of $1,080 for lease of the
equipment and for services.
Other costs involved in operating
the ozone system are discussed later in this report.
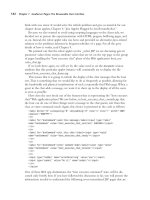
Figure 3 schematically illustrates the type of ozone system used
at the hospital.
The ozone generator was manufactured by PCI
Ozone Corporation and modified by NWMC for compliance with
proposed Uniform Fire Code safety standards.
The generator can
produce up to three pounds of ozone gas per day, but has been set
to operate at 65% of capacity.
13
10
The components of the ozonation system at Providence include:
Ozone generator. Produces ozone through corona discharge.
Air preparation packase.
Compressed air (supplied by customer)
is passed through an air dryer.
Dried air allows effective
production of ozone gas.
Ozone injector.
Mixes ozone gas with cooling tower water which
has been pumped out of the tower basins.
After injection of
ozone,
the water recirculates back to the basins.
Monitoring system.
Continuously monitors cooling tower water
quality and the operating status of the ozonation equipment.
Telecommunications equipment allows the data to be remotely
accessed by personal computer.
11
Operation and maintenance.
runs the ozonation equipment
Under the ozonation contract, NWMC
and monitors and maintains the water
quality of the cooling towers.
Once the ozone system was
installed, Providence hired a company to inspect the heat
exchange tubes in the condensers of the chillers.
This was the
first time since the chillers were installed in 1979 that the
condenser tubes had been inspected.
14
ozone treatment,
In the first year of
both chillers were inspected; since then each
chiller has been inspected on alternate years.
Although the
hospital continues to briefly check the cooling towers once each
shift,
its own routine maintenance efforts consist only of
quarterly check-up of the fan motors.
Twice daily NWMC uses its remote monitoring system to check the
condition of the ozone equipment and the water.
The monitoring
system sends yes/no signals to indicate if there is a problem
with:
0
the ozone generator operating,
0
the flow of coolants and electricity to the generator,
0
the temperature of the produced ozone,
0
the air dryer operating,
0
the flow and dryness of the air flowing to the
generator,
0
the pumping of the water through the ozone injection
loop, or
0
the security of
the ozonator cabinet door.
If a problem exists with any of these items, the ozone generator
automatically shuts down.
NWMC's computer would then flag the
condition and the company would send a technician to the site.
The monitoring system also transmits measured values of the
following parameters:
0
pressures of the recirculation pumps,
0
conductivity of the recirculated water,
0
the water's temperature,
0
the water's oxidation-reduction potential (ORP).
(ORP
provides an indirect indication of ozone
concentration.)
After installing the ozonation system, NWMC tested to make sure
that ozone concentration levels in the air near the cooling
towers were within allowed levels.
Since then there has been no
direct measurement of ozone concentration levels in the air at
the towers.
However,
the ORP values which are obtained on a
daily basis should indicate if ozone output becomes excessive.
Regular site services include monthly inspection of the ozonation
system, plus vacuuming, as needed, of any solids which
precipitate or settle out in the cooling tower basin, where the
water flows slowly.
NWMC also performs an annual maintenance
procedure on the ozone system,
which includes testing of the
ozone generator.
12
Water Savings
After switching to the ozone treatment system, the hospital
reduced the water use of the cooling towers by 13 percent, from
6258 gallons per day (gpd) under multiple chemical treatment to
5457 gpd under ozone treatment.
Table 3 presents the water
savings.
The reduced water use is equivalent to nearly 300,000
gallons annually.
Table 3.
Water Savings from Ozonation at Providence Hospital
Treatment
Period
Gallons
Days
Use
Note
Consumed
(gpd)
Multi-
3/6
- 11/3/87
1,514,400 242
6,258
chemical
Ozone gas
3/6
- 11/3/88
1,255,100 230
5,457 excludes
6/17
- 6/29
Difference
801
12.8% drop
13
Data.
Water use figures, shown in Table 4, are based on readings
of the makeup meter taken over the first 8 months after the
hospital began to rely on ozonation in 1988,.compared to data
from the same 8 month period in 1987, before ozone treatment.
Data were adjusted to account for a 12 day period during which
the makeup meter did not register water use:
Table 4.
Makeup Meter Readings at Providence Cooling
Towers
(in
date reading
11/03/88
279774
10/12/88
278605
09/13/88
277167
08/11/88
275314
07/13/88
273334
06/29/88
272418
06/17/88
272418
06/13/88
272203
05/12/88
270024
04/13/88
269170
03/15/88
267777
03/06/8ii
267223
11/03/87
261033
10/13/87
259523
09/12/87
257436
08/11/87
255668
07/13/87 254137
06/12/87
252239
O5/13/87
250081
04/14/87
248142
03/16/87
246420
03/06/87 245889
units of
100 gals.
change
days
gpd
1169
22
5314
1438
29
4959
1853
33
5615
1980
29
6828
916
14
6543
0
12
0
215
4
5375
2179
32
6809
854
29
2945
1393
29
1203
554
9
6156
1510
21
7190
2087
31
6732
1768
32
5525
1531
29
5279
1898
31
6123
2158
30
7193
1939
29
6686
1722
29
5938
531
10
5310
It should be noted that the 1987 baseline rate of water use under
multi-chemical treatment was much less than the water use had
been a few years earlier.
In 1985,
for instance, makeup water
use averaged over 12,000 gpd between mid-March and mid-November.
apparently due to problems with the bleed off and basin float
controls.
14
Eight months after the switch to ozone treatment, the makeup
meter began to frequently stop or under register.
This causes
one to question whether the makeup meter understated the amount
of water used during ozonation.
If it did, one would expect a
replacement meter to show a higher rate of use than was measured
during the first eight months of ozonation.
This,
however,
is not the case.
The makeup meter was indeed
replaced in 1990.
As shown in Table 5,
the new meter indicates
an average makeup water flow rate in Spring 1991 which is over
20%
less than that measured during Spring 1988 when ozone
treatment began.
This suggests that the makeup meter did not
seriously under register during the 8 months of 1988 in question,
except for the 12 days mentioned above when the meter register
did not advance.
Table 5.
Comparison of makeup use on new meter to use during ozonation.
New makeup meter
readings since March '91
(in units of 1000 gallons)
date reading
change
days
gpd
36/13/91
922
148
32
4625
05/12/91
774 118
31 3806
04/11/91
656
85
29
2931
03/13/91
571
Total
351
92
3815
Makeup, meter
readings
during ozonation, (1988)
(in units of 100 gallons)
date
reading change
days
gpd
06/13/88
272203
2179
32
6809
05/12/88 270024
654
29
2945
04/13/88 269170
1393
29
4803
03/15/88
267777
Total
4426
90
4918
15
Cause of reduced water use. The reduction in water use from 1987
to 1988 was not caused by a change in weather.
To rule out the
possibilities that milder weather might have caused decreased
evaporation,
either directly or as a result of reduced cooling
loads,
data from three California Irrigation Management
Information System (CIMIS) weather stations in the Bay Area were
examined.
Tables 6 through 8 show the results.
In the coastal North Bay Area (Novato), the months of March
through October were somewhat hotter and, on average, more humid
in 1988 than they were in 1987.
Data from the other two stations in San Jose and Walnut Creek
were available for fewer of the months in question, but also show
that 1988 was not cooler than 1987.
In the coastal South Bay
Area (San Jose),
July through October was on average over 10°F
hotter in 1988 than in 1987,
and hotter during each month for
which data are available.
In the inland East Bay Area (Walnut
Creek),
the average temperature for the period August through
October (the months for which data are available) was almost the
same during the two years,
just slightly higher in 1988 than
1987.
Relative humidity data at the San Jose and Walnut Creek stations
show less consistent results.
In San Jose,
the period July
through October was slightly more humid in 1988, on average, than
in 1987.
In Walnut Creek,
the August through October period was
slightly less humid overall in 1988 compared to 1987.
The water savings were achieved by disconnecting the automatic
bleed system,
thereby eliminating intentional discharge of the
cooling tower water.
It would be erroneous, however, to say that
the towers operated at zero blowdown.
Some loss of cooling tower
water did occur through mechanisms other than evaporation or
drift.
Causes of inadvertent blowdown.
First,
there may have been
overflow of water from the cooling tower basin.
The float in the
cooling tower basin,
which controls the makeup water valve, has
been known to fall out of calibration and to cause excessive
makeup water flow,
resulting in overflow."
In addition, 1.5
gallons per minute (gpm) of fresh water constantly flows through
the ozone generator into the tower basin.
This water flow,
equivalent to 2160 gpd,
is required to cool the ozone generator's
grounded electrode.
Although this rate of water use is much less
than average evaporation,
16
it is conceivable that at night or
during very cold days,
this input of makeup water would exceed
evaporation and cause overflow.
17
Moreover,
the ozone generator
cooling flow at times has been as high as 3 gpm.
18
Second,
some blowdown is believed to have occurred during the
study period as a result of mistaken opening of the blowdown
16
Table 6.
Weather Data for CIMIS Station #63, Novato
Summary for Novato:
Somewhat hotter and more humid in 1988 than in 1987.
1987
SOLAR VAPOR
AIR TEMP. REL. HUM.
DEW WIND WIND AVE
DATE
ETo
PRECIP RAD
AVE MAX MIN AVE MAX MIN AVE PT AVE RUN SOIL
in.
in.
Ly/dy mBars
Fahrenheit % F
mph mi F
TOTALS: I AVERAGES:
MARCH
2.82
3.29 331
APRIL
4.47
0.36 531 10.7 74 41 56 94 44 71 46 2.6
MAY
5.53
0.15
9.8 64 38 50
96 57 78 44 2.5 59 53
63 60
611 12.7 77 47 61
91 48 71 51 2.8
66 69
JUNE
5.70
0.18 666
13.1 78 49 62 88 49 70 51 2.9 69 ??
JULY
6.10
0.14 657
13.0 78 50 62 84 48 68 52 3.1
75 71
AUGUST
6.02
6.49
575 13.4 82 50 63 82 44 68 52 2.8 67 70
SEPT.
4.34
0.08
451 12.1 81 48 61 82 41 66 49 2.5 61 68
OCT.
3.17
1.24 1304 11.2 77 46 59 82 47 67 47
2.1
51 64
1987
Mar.
- Oct. Average
59
69 49
17
Lastly,
approximately 500 gallons of water are removed each time
that NWMC's service representative vacuums out loose particles
from the cooling tower basin.
21
It is not known how much cooling tower water was actually
discharged by these means.
known,
Neither is the amount of evaporation
for measured makeup water use is much less than the amount
of evaporation that would be expected from the operational
cooling load that the engineering staff believe the cooling
towers carry.
22
Consequently,
no water balance for the towers
has been included in this report.
Other Results
Cycles of concentration.
With ozone,
Providence Hospital
generally achieved higher cycles of concentration than it did
under the multi-chemical regime.
During multi-chemical
treatment,
monthly measurements of the conductivity of both the
cooling tower water and the makeup water were taken by the
chemical company representative.
From March 1987 to March 1988,
these monthly measurements indicate that the cooling tower
water's cycles of concentration varied greatly, from 2 to 36. On
the majority of these monthly reports, the measured concentration
ratio exceeded
the intended upper limit.
Between March 1987 and
March 1988,
the median concentration ratio was 9.8, based on
conductivity.
In comparison;
NWMC's water quality analysis in 1988 indicated
that the ozonated water operated at 25.3 cycles of concentration,
based on conductivity.
1990 results showed an even higher level
of conductivity in the tower water than in 1988.
23
Fouling of exposed surfaces and microbial growth.
Prior to the
use of ozone,
water in the cooling tower basin was murky and
biological fouling was plainly visible on tower surfaces.
The
ozone vendor's analysis of the cooling tower water indicated an
aerobic bacterial population in excess of 100,000 colonies per
milliliter (col/ml),
and an anaerobic bacterial population
greater than 10,000 col/ml.
A laboratory hired by NWMC to verify
the results could not quantify the number of bacteria because of
interference from the particles in the water.
Appendix A
contains the ozone vendor's detailed description of the condition
of the cooling tower prior to ozonation,
data.
including the bacteria
After installing the ozone system,
the cooling tower water and
exposed surfaces improved dramatically in appearance.
Pacific
Gas and Electric Company (PG&E),
which analyzed corrosion rates
20
at the hospital's ozone treated cooling tower in 1988, describes
the improvement:
"The circulating water turned clear as the
existing deposits on the wetted surfaces within view gradually
disappeared.
"
24
"There were no crevices, scaling, or signs of
biological growth observed on surfaces of testing materials or
cooling systems structures.
The water was crystal clear "
25
The virtual elimination of microorganisms from the cooling tower
was confirmed by bacterial analysis of the tower water.
Just
half of a month after the switch to ozone treatment, an analysis
of a sample of tower water found a bacterial count of 29,000 per
100 milliliters (or, 290 per ml),
an improvement of roughly 3
orders of magnitude over bacterial levels observed during multi-
chemical treatment.
26
Subsequent analyses showed an additional
improvement of an order of magnitude: a water quality analysis
done by NWMC in 1988 produced a result of 20 cfu/ml;
in 1989
NWMC reported less than 100 counts/ml;
28
and in 1990 a
laboratory hired by NWMC counted just 17 cfu/ml.
29
Corrosion.
Although there are no data available on corrosion
rates at the site during multi-chemical treatment, the corrosion
rates of metals exposed to ozonated water have been low.
Of five
metal types tested by PG&E in the summer of 1988, all but grey
cast iron had rates of less than 0.1 mils (milli-inches) per
year (mpy) ,
as shown in Table 9.
Table 9.
Corrosion Rates Measured by PG&E
Metal Type
Corrosion Rates (MPY)
CDA 706 (90-10 Copper-Nickel)
0.01
- 0.02
CDA 443 (Admiralty Brass)
0.01 - 0.02
Grey Cast Iron
1.30 - 1.80
Carbon Steel 1018
0.07
- 0.08
Aluminum 6061
0.01 - 0.02
Note: MPY = milliinches per year (0.001 in./yr.)
According to PG&E,
"The higher corrosion rates of [grey cast
iron] (below two mills per year) were caused by lower
concentration of total dissolved solids, not allowing complete
passivation of this material."
(Selected characteristics of the
ozonated water during the monitoring are presented in Table
10.)30
21
Table 10.
Selected Water Quality Characteristics
During PG&E Monitoring
Parameter
Units
Value
Ave.
Temperature
Degrees Centigrade
28-30 (82.4-86.0
0
F)
Ozone Concentration
parts per billion
47-48
pH
Standard Units
8.6
- 8.9
Source (Tables 9 and 10):
Paul A.
Burda and Salem A. Attiga,
Evaluation of Ozone Technology
for Chemical Treatment Replacement in Cooling Tower Systems (San
Ramon:
Pacific Gas & Electric Co., January 1989), Status Report,
Report No.
006.2-89.2
Measurements taken by NWMC in 1989 and 1990 using corrosion
coupons have also shown low corrosion rates: 1.0 - 1.5 mpy for
mild steel and 0.05 - 0.1 mpy for copper.
31
A slight increase in pitting of chiller heat exchanger tubes,
however, did occur after ozone was introduced.
Very shortly
after the multi-chemical treatment was replaced with ozone, tests
of all of the condenser tubes found no defects in Chiller #l, and
found one tube (out of 660) in Chiller #2 with 20% internal
diameter (I.D.) pitting.
A year later,
when Chiller #l was
reopened,
3 tubes (also out of 660) showed 20% I.D. pitting. By
1990, the number of tubes in Chiller #2 with 20% I.D. pitting had
also increased to three,
although this condition was described as
"not a problem at this time."
In both chillers, the status of
each pitted tube was deemed acceptable by the company performing
the testing.
32
Table 11 shows results from the 1988 - 1990
tests of the chiller tubes."
22