Comparison of various spectral indices for estimating mangrove covers using planetscope data: A case study in Xuan Thuy nation park, Nam Dinh province
Bạn đang xem bản rút gọn của tài liệu. Xem và tải ngay bản đầy đủ của tài liệu tại đây (634.29 KB, 10 trang )
Management of Forest Resources and Environment
COMPARISON OF VARIOUS SPECTRAL INDICES
FOR ESTIMATING MANGROVE COVERS USING PLANETSCOPE DATA:
A CASE STUDY IN XUAN THUY NATIONAL PARK, NAM DINH PROVINCE
Nguyen Hai Hoa
Vietnam National University of Forestry
SUMMARY
Using remote sensing and GIS technology to quantify the extents of land covers and detect their changes, in
particular mangrove covers, is very important to identify drivers of change, thus providing a good scientific
foundation for better management of mangroves in Xuan Thuy National Park, Nam Dinh province. In this
study, eight vegetation indices were used, namely SR, NDVI, GNDVI, BNDVI, TV, SAVI, OSAVI and EVI,
to quantify the extents of mangrove covers is adopted. As a result, all vegetation indices are reliable for
classifying and mapping land covers, greater than 80% of accuracies, in particular OSAVI is the most accurate
in comparison with other indices, more than 90% of mapping accuracy as using Planet Scope (3 m x 3 m).
Regarding changes in mangrove covers, using 2016 and 2017 PlanetScope data for detecting the change, it has
been evidenced with a slight increase of mangroves with 75 ha established. The main drivers of increase of
mangrove extents are due to effective mangrove rehabilitation and restoration programs. These findings imply
thatmangrove mangement in Xuan Thuy National Park is in a good place.
Keywords: GIS, Land covers, mangroves, Nam Dinh, remote sensing, vegetation indices, Xuan Thuy.
I. INTRODUCTION
In Vietnam, there are 30 provinces and
cities that have directly associated with coastal
mangroves and coastal wetland areas. Coastal
mangrove regions are divided into 4 main
zones, namely North-Eastern coast from Ngoc
cape to Do Son, defined as Zone I; Northern
delta from Do Son to Lach Truong river,
known as Zone II; Central coast from Lach
Truong to Vung Tau as Zone III; and Southern
delta from Vung Tau to Ha Tien as Zone IV
(Phan Nguyen Hong, 1999). Total mangrove
extents in Vietnam have reduced dramatically
from 1943 to 2000 due to natural disasters,
wars and shrimp farming, unsustainable
management and other human activities (Phan
Nguyen Hong, 1999).
Coastal mangroves are well-known as
highly productive ecosystems that typically
dominate the intertidal zone with low energy
tropical and subtropical coastlines (Hai-Hoa,
74
2014). In addition, mangroves serve some key
important functions, namely the maintenance
of coastal water quality, reduction in severity
of storm, wave attenuation, flood prevention
and mitigation, and nursery and feeding areas
for commercial fishery species. Remote
sensing is an impressive management tool to
quantify mangrove extents because of
allowance of quantitative and qualitative
assessments of ground conditions over large
and inaccessible areas (Haboudane et al.,
2004). Multispectral sensors on satellite
platforms, including synthetic aperture radar
(SAR), Landsat, and SPOT, Sentinels,
PlanetScope and Rapid-eyes, are the most
popular for mangrove monitoring and analysis
due to their cost-effectiveness (Jiang et al.,
2008). Planet Scope is the optimal satellite that
provides data in multispectral mode (3 m
resolution). The reflectance of vegetation is
low in both the blue and red regions of the
JOURNAL OF FORESTRY SCIENCE AND TECHNOLOGY NO. 5 - 2017
Management of Forest Resources and Environment
spectrum because of absorption by chlorophyll
for photosynthesis. The highest peak in visible
region is the green region which is the green
color of vegetation. Vegetation indices (VIs)
are combination of surface reflectance at two
or more wavelengths designed to highlight a
particular property of vegetation (Wang et al.,
2007; Jiang et al., 2008). It is notable that
spectral indices have become very popular in
the remotely sensed vegetation features
recently. However, reflections of soil and rocks
are often much more than reflections of sparse
vegetation that lead to the separation of plant
signals more difficult. This study tends to
classify and quantify land covers, in particular
extents of mangrove covers using eight
vegetation indices in Nam Dinh province
during 2016 to 2017, namely SR, NDVI,
GNDVI, BNDVI, TVI, SAVI, OSAVI and
EVI. The most suitable index is then selected
to quantify the extents of coastal land covers
for Xuan Thuy National Park, and detect the
change during the period of 2016 - 2017.
II. RESEARCH METHODOLOGY
2.1. Study site
Xuan Thuy National Park is geographically
located in the Hong River, Biosphere Reserves
in Nam Dinh Province, Vietnam that covers an
area of 12000 ha. This Park was established
according the Decision number 01/203/QDTTg, dated 2nd January 2003. It is well-known
by a variety of mangrove species and other
coastal creatures. This study has selected Xuan
Thuy National Park with emphasis on the
spatial distribution of mangrove covers and
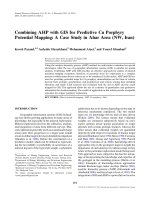
other land covers (Fig. 01).
Figure 01. The satellite image of study site (PlanetScope 8th August 2016, 3 m x 3 m)
2.2. Materials
This study aimed to use Planetscope data
with spatial resolution 3 m x 3 m in August
2016 and June 2017 (Table 01) to classify
mangrove and Non-mangrove covers in the
Xuan Thuy National Park, Nam Dinh province,
Vietnam. Eight vegetation indices, including
Simple Ratio (SR), Normalized Different
JOURNAL OF FORESTRY SCIENCE AND TECHNOLOGY NO. 5 - 2017
75
Management of Forest Resources and Environment
Vegetation Index (NDVI), Green Normalized
Different Vegetation Index (GNDVI); Blue
Normalized Different Vegetation Index
(BNDVI); Transformed Vegetation Index
(TVI); Soil Adjusted Vegetation Index (SAVI),
Optimised Soil Adjusted Vegetation Index
(OSAVI) and Enhanced Vegetation Index
(EVI) are tested to find out the best
classification accuracy for the study area
(Table 02).
Table 01. Remotely- sensed data used for estimating mangrove covers
ID
1
2
3
4
Image codes
Date
Resolution (m)
Note
20160808_023705_0e0f_3B_AnalyticMS
20160808_023706_0e0f_3B_AnalyticMS
20170603_023949_1006_3B_AnalyticMS
20170603_023948_1006_3B_AnalyticMS
08/08/2016
08/08/2016
03/06/2017
03/06/2017
3
3
3
3
Provided by CLS
Provided by CLS
Provided by CLS
Provided by CLS
Source: />
2.3. Methods
In order to classify and quantify mangrove
covers based on different vegetation indices,
there are a number of methods used as shown
in Fig. 01.
PlanetScope collection
Maps, Reports.
PlanetScope- processing
Field-based survey
Calculation of spectral indices
Accuracy assessments
Field-based data
Post-classification
Mangrove maps by indices
Fig. 01. Flow chart of quantifying mangrove covers using different vegetation indices.
Field survey and secondary data collection:
To gain additional information in relation to
76
the spatial distribution of mangroves in Xuan
Thuy National Park, study has reviewed all the
JOURNAL OF FORESTRY SCIENCE AND TECHNOLOGY NO. 5 - 2017
Management of Forest Resources and Environment
relevant documents of vegetation indices,
previous mangrove studies and projects in
Xuan Thuy National Park. In addition, the field
survey has been required to collect information
of mangroves and non-mangroves (including
water, cloud, agricultures, other plants and
other land use types) with support of GPS
Garmin 650. In particular, there were 500 GPS
points collected from the field, including 300
points for mangroves and 200 points for nonmangroves in which 150 points of mangroves
and 100 points of non-mangroves has been
used for accuracy assessments.
Image pre-processing:
PlanetScope images are processed at level
3B, which are orthorectified and scaled Top of
Atmosphere Radiance image product, and they
are suitable for analytic and visual applica-
tions(Planet Imagery Product Specification,
2017). Geometric and radiometric corrections
are all applied to images this study. In
particular, sensor-related effects are corrected
using sensor telemetry and a sensor model.
Spacecraft-related effects are corrected using
attitude telemetry and best available ephemeris
data. Conversion to absolute radiometric
values is based on calibration coefficients.
PlantnetScope has 4 bands, namely Band 1
is Blue, Band 2 is Green, Band 3 is Red and
Band 4 is Near infrared. Mosaicking two
PlanetScope images is required, and then
clipping mosaicked image is carried out based
on the study boundary as shown in Fig. 01.
To calculate mangrove covers by using
various equations of spectral indices, study has
used the vegetation indices as shown in Table 02.
Table 02. Equation of vegetation indices used for estimating mangrove cover
ID
Indices
Equations
NIR/RED
5
SR (Simple Ratio)1
NDVI (Normalised Difference Vegetation
Index)2
GNDVI (Green Normalised Difference
Vegetation Index)3
BNDVI (Blue Normalised Difference Vegetation
Index)4
TVI1 (Transformed Vegetation Index)5,6
6
SAVI (Soil Adjusted Vegetation Index)7
7
OSAVI (Optimised Soil Adjusted vegetation
Index)8
8
EVI2 (Enhanced Vegetation Index)9,10
1
2
3
4
(NIR-GREEN)/(NIR+GREEN)
(NIR-BLUE)/(NIR+BLUE)
*(1+L), L = 0.5
(1+0.16)*[(NIR-RED)/(NIR+RED+0.16]
2.5*[(NIR-RED)/(NIR+2.4*RED +1)]
Sources: 1Jordan (1969); 2Rouse et al., (1973); 3Gitelson et al., (1996); 4Wang et al., 2007; 5Deering et al.,
(1975); 6Broge and Leblanc (2000); 7Huete (1988); 8Rondeaux et al., (1996); 9Jiang et al., (2008);
10
Haboudane et al., (2004).
Calculation of spectral indices:
The spectral index calculation is conducted
based on the Equations given in Table 02. To
be more specific:
Simple Ratio Index (SR) offers a high value
for vegetation, whereas the low value
JOURNAL OF FORESTRY SCIENCE AND TECHNOLOGY NO. 5 - 2017
77
Management of Forest Resources and Environment
represents for soil, ice or water. This index
indicates amount of vegetation, which is able
to reduce the effects of atmosphere and
topography (Jordan, 1969). Simple Ratio
values for bare soils are generally close to 1.
As the amount of green vegetation increases in
a pixel, Simple Ratio value increases and its
values can increase far beyond 1. Generally,
very high Simple Ratio values are on the order
of 30.
Normalised Difference Vegetation Index
(NDVI) has values ranging from -1 to 1,
indicating vegetation and non-vegetation,
which is able to distinguish between vegetation
and soil, minimize the topographic effects, but
not eliminate atmospheric effects (Rouse et al.,
1973).
Green Normalised Difference Vegetation
Index (GNDVI) is an index of plant and one of
the most commonly used indices to assess
canopy variation in biomass (Gitelson et al.,
1996), whereas Blue Normalised Difference
Vegetation Index (BNDVI) is used to analyse
the leaf area index (Wang et al., 2007).
Transformed Vegetation Index (TVI) is
used to eliminate negative values and
transform NDVI histograms into a normal
distribution (Deering et al., 1975; Mroz and
Sobieraj, 2004). Similarly, Soil Adjusted
Vegetation Index (SAVI) is used to minimise
the soil influence on vegetation quantification
by giving the soil adjustment factor as L. L is
equal to 0.0 or 0.25 used for high vegetation
cover, whereas the low vegetation cover is
with L of 1.0. The intermediate vegetation
cover is with L of 0.5 (Huete 1988; Mroz and
Sobieraj, 2004). In contrast, Optimised Soil
Adjusted vegetation Index (OSAVI) is a
simplified index of SAVI to minimize the
influence of soil brightness. This index is
recommended to analyze vegetation in early to
mid growth stages, where there is relatively
sparse vegetation and soil is visible through the
canopy (Rondeaux et al., 1996).
Enhanced Vegetation Index (EVI) is subject
to be more sensitive to plant canopy
differences such as leaf area index, canopy
structure and plant phenology, so it is
commonly used to monitor variations in
vegetation (Huete et al., 1994; Jiang et al.,
2008).
III. RESULT AND DISCUSSIONS
3.1. Mangrove covers by difference vegetation
indices
Values of vegetation indices driven by
PlanetScope data
Findings of eight spectral indices are
presented in Table 03 and Fig. 02.
Table 03. Values of vegetation indices calculated by PlanetScope in 2016
78
ID
Vegetation indices
Minimum
Maximum
Mean
1
2
3
4
5
6
7
8
SR
NDVI
GNDVI
BNDVI
TVI
SAVI
OSAVI
EVI
0
-0.537
-0.625
-0.631
0
-0.805
-0.623
-0.647
3
0.578
0.430
0.424
1.038
0.867
0.670
1.115
0.169
-0.225
-0.318
-0.335
0.483
-0.337
-0.261
-0.279
JOURNAL OF FORESTRY SCIENCE AND TECHNOLOGY NO. 5 - 2017
Management of Forest Resources and Environment
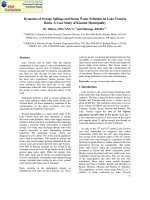
Figure 02. Coastal land covers in Xuan Thuy National Park (PlanetScope 8 August 2016)
As can be seen in Table 03, regarding
NDVIs, there are slight differences in
vegetation values cross three indices, including
NDVI, GNDVI and BNDVI. In particular,
NDVI has the largest range of values in
comparison with BNDVI and GNDVI, from 0.537 ÷ 0.578, followed by GNDVI and
BNDVI. For these indices, positive values
represent the vegetation, the higher NDVIs
values are, the more dense vegetation are
(Wang et al., 2007; Jiang et al., 2008).
Similarly, SAVI and OSAVI values range
from -0.805 to 0.867 and -0.623 to 0.670,
respectively, indicating that the higher values
of SAVIs tend to be more density of
vegetation. On the contrary, TVI has a value of
0.0 to 1.038, which the values are greater than
0.5 representing vegetation.
JOURNAL OF FORESTRY SCIENCE AND TECHNOLOGY NO. 5 - 2017
79
Management of Forest Resources and Environment
Index of SR has values less than 1 or close
to 1, which represent to the soil or water,
whereas the values of SR are greater than 1,
showing the vegetation. Values of EVI range
from -0.647 to 1.115, showing there is a
variation of land cover types in this study,
where positive values represent vegetation
compared to negative values for water or
bare/wet soils.
Land use types in association with different
vegetation indices
To classify different land use types
according to various vegetation indices, each
vegetation index was classified into 30 classes
and then 100 points of mangroves and 100
points of non-mangroves (50 points of other
plants, 30 bare/wet soils and built-up areas, 20
points of water bodies) were used to identify
and classify different land use types. The result
indicated that there were four different types of
land use and land covers presented in Table 04.
Table 04. Values of vegetation indices for different land use types
ID
Indices
Mangroves
1
2
3
4
5
6
7
8
SR
NDVI
GNDVI
BNDVI
TVI1
SAVI
OSAVI
EVI
> 1.0
0.132 ÷ 0.578
0.002 ÷ 0.424
0.013 ÷ 0.046
0.794 ÷ 1.038
0.198 ÷ 0.867
0.112 ÷ 0.670
0.238 ÷ 1.115
Non- mangroves
Other plants
Bare/wet soils, built-up
0.058 ÷ 0.131
-0.076 ÷ 0.002
-0.065 ÷ 0.012
0.725 ÷ 0.793
0.086 ÷ 0.178
0.021 ÷ 0.111
0.051 ÷0.238
values are less than 1.0
-0.196 ÷ 0.057
-0.312 ÷ -0.075
-0.306 ÷ -0.066
0.525 ÷ 0.724
-0.294 ÷ 0.086
-0.227 ÷ 0.020
0.050 ÷ -0.294
Water bodies
-0.537 ÷ -0.195
-0.631 ÷ -0.311
-0.625 ÷ -0.306
0.077 ÷ 0.525
-0.805 ÷ -0.294
-0.623 ÷ 0.227
-0.647 ÷ -0.294
Extents of mangrove covers and accuracy assessments
Table 05. Accuracy assessments, mangrove covers by different vegetation indices in 2016
ID
1
2
3
4
5
6
7
8
Index
Mangrove
(ha)
Non-mangrove (ha)
Other
plants
BWS,
BU
Total
Total of
Areas
SR
2169.9
11400.3
13570.2
NDVI
1442.2
426.4
3453.4
8248.2
12128.0
13570.2
GNDVI
1358.8
550.9
4114.3
7546.2
12211.4
13570.2
BNDVI
1358.8
550.9
4400.9
7259.6
12211.4
13750.2
TVI1
1452.3
587.7
4081.7
7442.5
12111.9
13570.2
SAVI
1442.1
426.4
4058.9
7642.8
12128.1
13570.2
OSAVI
1442.2
426.4
4058.9
7642.7
12128.0
13570.2
EVI
1550.5
443.1
4089.1
7487.4
12020.0
13570.2
BWS: Bare/wet soils; BU: Built-up; Water bodies: Shrimp farms, sea waters, ponds.
As shown in Table 04 and Table 05, there
are relationships between values of vegetation
indices and different land cover types, in
particular mangrove covers across eight
indices. These findings are similar to other
studies, such as Haboudane et al. (2004),
80
Water
bodies
Accuracy
(%)
90.4
89.2
82.4
82.8
85.2
89.6
91.6
81.6
Montandon and Small (2008). As indicated in
Table 05, accuracy assessments of all
vegetation indices are greater than 80.0%, in
particular coastal land covers classified by
OSAVI is the most accurate among vegetation
indices, around 91.6%, followed by the SR,
JOURNAL OF FORESTRY SCIENCE AND TECHNOLOGY NO. 5 - 2017
Management of Forest Resources and Environment
SAVI and NDVI at 90.4%, 89.6% and 89.2%
respectively. However, SR cannot be used to
classify various kinds of vegetation covers due
to its difficulty in separating different
vegetation covers, but between vegetation
cover and water and bare/wet soil (Mroz et al.,
2004). Therefore, in this study, the OSAVI is
selected to classify mangrove covers of Xuan
Thuy National Park in 2017 due to its highest
accuracies.
3.2. Changes of mangrove covers during the
period of 2016 - 2017
This study has used OSAVI to classify
different land covers in 2017 as shown in
Table 06 and Figure 03.
Table 06. Land covers in Xuan Thuy National Park by PlanetScope in 2017
Land covers
in 2017
Mangrove
(ha)
Total
1517.2
1517.2
Non-mangrove (ha)
Other plants
BWS, BU
Water bodies
284.6
4372.1
12053.0
7396.3
Total of studied areas
13570.2
Figure 03. Mangrove covers using PlanetScope in 3 June 2017 (ha)
As shown in Table 05 and Figure 03, the
extents of mangrove cover in 2017 by
PlanetScope is 1517.5 ha, whereas nonmangroves are 12053.0 ha. In comparison with
mangrove covers in 2016, there is a relative
difference in extents of mangrove covers as
shown in Table 06.
Table 06. Changes in extents of mangrove extents between 2016 and 2017 using PlanetScope
Classes
Mangroves
Non-mangroves
2016
1442.2
12128.0
2016 – 2017
2017
1517.2
12053.0
Ha
%
75.0
-75.0
0.05
-0.05
Non-mangroves include Waters, Bare/Wet soils; other plants
JOURNAL OF FORESTRY SCIENCE AND TECHNOLOGY NO. 5 - 2017
81
Management of Forest Resources and Environment
As indicated in Table 06, mangroves have
been experienced with an increase of
mangrove extents, approximately 75 ha
between 8th August 2016 and 3rd June 2017,
equivalent to 0.05%. This increase is due to the
strengthened management activities and local
people’s rising awareness from government,
such as mangrove restoration and development
projects.
Recently,
rehabilitation
and
sustainable
development
of
mangrove
ecosystems project in Xuan Thuy National
Park.
IV. CONCLUSIONS
Based on using different vegetation indices,
this study has quantified the extents of land
covers, in particular mangrove covers using
PlanetScope data with 3 m spatial resolution
and GIS in Xuan Thuy National Park, Nam
Dinh province during 2016 - 2017, the study
has come up with the following conclusions.
Firstly, using spectral indices to classify land
covers have shown that all indices are reliable
for mapping coastal land covers with 3 m x 3 m
PlantScope data and accuracy assessments of
land covers are all greater than 80%, but the
OSAVI is the most accurate index. Secondly,
there is a change in coastal land covers
between 2016 and 2017, in particular
mangrove cover has been evidenced with an
increase of 75 ha as a result of good mangrove
restoration and rehabilitation in Xuan Thuy
National Parks.
REFERENCES
1. Phan Nguyen Hong (1999). Mangrove forest in
Vietnam Volume 1 and 2. Agricultural Publisher
(Vietnamese languague).
2. Broge, N. H., Leblanc, E (2000). Comparing
prediction power and stability of broadband and
hyperspectral vegetation indices for estimation of green
leaf area index and canopy chlorophyll density. Remote
Sensing of Environment, 76:156-172.
3. Deering, D.W., Rouse, J.W., Haas, R.H., Schell,
82
J.A (1975). Measuring “Forage Production” of Grazing
Units From Landsat MSS Data. Proceedings of the 10th
International Symposium on Remote Sensing of
Environment, 2:1169-1178.
4. Jiang, Z., Huete, A. R., Didan, K., Miura, T
(2008). Development of a two-band enhanced vegetation
index without a blue band. Remote Sensing of
Environment, 112:3833–3845.
5. Gitelson, A.A., Kaufman, Y.J., Merzlyak, M.N
(1996). Use of a green channel in remote sensing of
global vegetation from EOS-MODIS. Remote Sensing of
Environment, 58:289–298.
6. Jordan, C.F (1969). Derivation of leaf area index
from quality of light on the forest floor. Ecology, 50,
663–666.
7. Haboudane, D., Miller, J.R., Pattey, E., ZarcoTejada, P.J., Strachan, I.B (2004) Hyperspectral
vegetation indices and novel algorithems for predicting
green LAI of crop canopies: Modeling and validation
the context of precision agriculture. Remote Sensing of
Environment, 90:337-352.
8. Huete, A. R (1988). A soil-adjusted vegetation
index (SAVI). Remote Sens. Environ, 25:295–309.
9. Huete, A. R., Justice, C., Liu, H (1994).
Development of vegetation and soil indexes for modisEOS. Remote Sens. Environ, 49:224–234.
10. Hai-Hoa, N (2014). The relation of coastal
mangrove changes and adjacent land-use: A review in
Southeast Asia and Kien Giang, Vietnam. Ocean and
Coastal Management, 90:1-10.
11. Montandon, L.M.,Small,E.E (2008). The impact
of soil reflectance on the quantification of the green
vegetation fraction from NDVI. Remote Sensing of
Environment, 112: 1835–1845.
12. Mroz, M., Sobieraj, A (2004). Comparison of
several vegetation indices calculated on the basis of
seasonal SPOT XS time series, and their suitability for
land cover and agricultural crop identification. Technical
Sciences, 7: 39-65.
13. Rondeaux, G., Steven, M., Baret, F (1996).
Optimization of soil-adjusted vegetation indices. Remote
Sens. Environ, 55:95–107.
14. Rouse, J.W., Haas, R.H., Schell, J.A., Deering,
D.W (1973). Monitoring vegetation systems in the Great
Plains with ERTS. In: Third ERTS Symposium. NASA,
pp. 309–317.
15. Wang, F. M., Huang, J. F., Tang, Y. L., Wang,
X. Z (2007). New vegetation index and its application in
estimating leaf area index of rice. Rice Sci, 14:195–203.
JOURNAL OF FORESTRY SCIENCE AND TECHNOLOGY NO. 5 - 2017
Management of Forest Resources and Environment
SO SÁNH SỰ KHÁC BIỆT CHỈ SỐ THỰC VẬT TRONG ƯỚC TÍNH
DIỆN TÍCH RỪNG NGẬP MẶN QUA VIỆC SỬ DỤNG ẢNH PLANETSCOPE:
NGHIÊN CỨU ĐIỂM TẠI VQG XUÂN THỦY, TỈNH NAM ĐỊNH
Nguyễn Hải Hòa
Trường Đại học Lâm nghiệp
TÓM TẮT
Việc sử dụng công nghệ viễn thám và GIS trong ước tính diện tích bao phủ đất và phát hiện sự thay đổi của
chúng, đặc biệt là rừng ngập mặn ven biển, có ý nghĩa rất quan trọng để xác định được nguyên nhân, yếu tố
thay đổi, cung cấp cơ sở khoa học cho việc đưa ra các giải pháp quản lý rừng ngập mặn tốt hơn tại Vườn Quốc
gia Xuân Thuỷ, tỉnh Nam Định. Trong nghiên cứu này, 8 chỉ số thực vật, bao gồm SR, NDVI, GNDVI,
BNDVI, TV, SAVI, OSAVI và EVI được sử dụng để ước tính diện tích che phủ bởi rừng ngập mặn và các
trạng thải phủ khác. Kết quả cho thấy tất cả các chỉ số thực vật đều có độ tin cậy trên 80% và có thể sử dụng để
phân loại và lập bản đồ bao phủ đất khu vực nghiên cứu, đặc biệt là chỉ số OSAVI có độ chính xác cao nhất so
với các chỉ số khác, trên 90% độ chính xác khi sử dụng PlanetScope với độ phân giải 3 m x 3 m. Đánh giá sự
thay đổi diện tích rừng ngập mặn giai đoạn 2016 - 2017 cho thấy có sự tăng nhẹ về diện tích rừng ngập mặn,
khoảng 75 ha rừng ngập mặn là kết quả của hoạt động trồng mới và phục hồi rừng ngập mặn tại khu vực nghiên
cứu. Kết quả này cũng chỉ rõ công tác quản lý rừng ngập mặn tại Vườn Quốc gia Xuân Thủy và các trạng thái
thảm phủ khác là hiệu quả.
Từ khoá: Chỉ số thực vật, GIS, lớp phủ mặt đất, Nam Định, rừng ngập mặn, viễn thám, Xuân Thuỷ.
Received
Revised
Accepted
: 19/7/2017
: 09/9/2017
: 25/9/2017
JOURNAL OF FORESTRY SCIENCE AND TECHNOLOGY NO. 5 - 2017
83