The test characteristics of head circumference measurements for pathology associated with head enlargement: A retrospective cohort study
Bạn đang xem bản rút gọn của tài liệu. Xem và tải ngay bản đầy đủ của tài liệu tại đây (520.29 KB, 10 trang )
Daymont et al. BMC Pediatrics 2012, 12:9
/>
RESEARCH ARTICLE
Open Access
The test characteristics of head circumference
measurements for pathology associated with
head enlargement: a retrospective cohort study
Carrie Daymont1,2,3,4*, Moira Zabel3,4, Chris Feudtner3,5,6 and David M Rubin3,5,6
Abstract
Background: The test characteristics of head circumference (HC) measurement percentile criteria for the
identification of previously undetected pathology associated with head enlargement in primary care are unknown.
Methods: Electronic patient records were reviewed to identify children age 3 days to 3 years with new diagnoses
of intracranial expansive conditions (IEC) and metabolic and genetic conditions associated with macrocephaly
(MGCM). We tested the following HC percentile threshold criteria: ever above the 95th, 97th, or 99.6th percentile and
ever crossing 2, 4, or 6 increasing major percentile lines. The Centers for Disease Control and World Health
Organization growth curves were used, as well as the primary care network (PCN) curves previously derived from
this cohort.
Results: Among 74,428 subjects, 85 (0.11%) had a new diagnosis of IEC (n = 56) or MGCM (n = 29), and between
these 2 groups, 24 received intervention. The 99.6th percentile of the PCN curve was the only threshold with a PPV
over 1% (PPV 1.8%); the sensitivity of this threshold was only 15%. Test characteristics for the 95th percentiles were:
sensitivity (CDC: 46%; WHO: 55%; PCN: 40%), positive predictive value (PPV: CDC: 0.3%; WHO: 0.3%; PCN: 0.4%), and
likelihood ratios positive (LR+: CDC: 2.8; WHO: 2.2; PCN: 3.9). Test characteristics for the 97th percentiles were:
sensitivity (CDC: 40%; WHO: 48%; PCN: 34%), PPV (CDC: 0.4%; WHO: 0.3%; PCN: 0.6%), and LR+ (CDC: 3.6; WHO: 2.7;
PCN: 5.6). Test characteristics for crossing 2 increasing major percentile lines were: sensitivity (CDC: 60%; WHO: 40%;
PCN: 31%), PPV (CDC: 0.2%; WHO: 0.1%; PCN: 0.2%), and LR+ (CDC: 1.3; WHO: 1.1; PCN: 1.5).
Conclusions: Commonly used HC percentile thresholds had low sensitivity and low positive predictive value for
diagnosing new pathology associated with head enlargement in children in a primary care network.
Background
Head circumference (HC) measurements are routinely
performed at well-child visits in infants and young children. Despite the frequency with which these measurements are performed, little is known about how primary
care physicians should use these measurements to distinguish sick from healthy children.
Macrocephaly, or an abnormally large head, is commonly defined as a head circumference above the 95th
percentile (corresponding in normally distributed HC
values to 1.64 standard deviations from the mean of
gender and age-specific controls) in the United States.
* Correspondence:
1
Department of Pediatrics and Child Health, The University of Manitoba,
Winnipeg, Manitoba, Canada
Full list of author information is available at the end of the article
This value was initially based on the inability to accurately determine more extreme percentiles in early
growth curves [1]. Recommendations have also been
made to use more extreme percentiles as a threshold for
increased concern, such as the 97th percentile proposed
by the World Health Organization (WHO) [2] or the
98th or 99.6th percentile proposed for use in the United
Kingdom [1,3]. National guidelines in Norway make use
of another threshold, namely that a child whose head
circumference has crossed two increasing major percentile lines should receive further evaluation [4]. A recent
study using country-specific growth curves in Norway
reported that this criterion had a sensitivity of 46% for
intracranial expansive conditions (IEC) but did not provide information regarding specificity or predictive
values [4].
© 2012 Daymont et al; licensee BioMed Central Ltd. This is an Open Access article distributed under the terms of the Creative
Commons Attribution License ( which permits unrestricted use, distribution, and
reproduction in any medium, provided the original work is properly cited.
Daymont et al. BMC Pediatrics 2012, 12:9
/>
Numerous pathologic conditions may cause an
increased head size, including IEC such as hydrocephalus and chronic subdural hematomas, and metabolic and
genetic conditions that may cause macrocephaly
(MGCM), such as glutaric aciduria and Fragile X syndrome. The ability of these thresholds to accurately
identify children with previously undiagnosed IEC and
MGCM has not been evaluated.
We therefore conducted a retrospective cohort study
to evaluate the performance of various threshold criteria
for the identification of children with new diagnoses of
IEC or MGCM in a primary care population receiving
routine head circumference measurements.
Methods
Subjects and Data Sources
Electronic records of children who received care in a
large primary care network associated with a tertiary
care children’s hospital were evaluated retrospectively.
HC measurements are routinely performed at well child
visits until three years of age in the network.
All subjects were born before 31 January 2008 and
had at least one HC recorded in the electronic medical
record before 31 January 2009 while they were between
3 days and 3 years of age. The HC measurements for
these children had previously been used to create new
HC growth curves [5]. Subjects with known birth weight
less than 1500 grams or gestational age below 33 weeks
were excluded.
Although HC curves may also be used to monitor the
head growth of children with known diagnoses, our goal
in this study was to evaluate the performance of HC
curves for the identification of children with previously
undetected pathology. Therefore, subjects were excluded
if they had evidence of neurosurgery or a diagnosis of
pathology known to be associated with an abnormally
large head size before the first HC for that subject was
recorded in the electronic record, regardless of whether
the HC percentile was high. Subjects with diagnoses
associated with small head size before the first HC was
recorded were also excluded in order to avoid downwardly skewing the HC distribution of the final sample.
Subjects with diagnoses made on prenatal ultrasound,
which is performed routinely in our population, were
excluded.
Measures
The primary outcome of interest was the new diagnosis
before three years of age of IEC or MGCM. The following were included as IEC: hydrocephalus (enlarged, not
merely prominent, ventricles without evidence of brain
volume loss); chronic subdural hematoma (with or without associated hydrocephalus); cyst (> 1 cm, causing
mass effect or hydrocephalus); brain tumor (> 1 cm,
Page 2 of 10
causing mass effect or hydrocephalus) [4]. The following
were considered MGCM: overgrowth syndromes
(including acromegaly, Beckwith-Weidemann, SimpsonGolabi-Behmel Sotos, and Weaver syndromes), Alexander disease, cranial dysplasia, Canavan disease, Fragile X
syndrome, galactosemia, gangliosidosis (GM1 and GM2),
glutaric aciduria (type I and D-2-hydroxyglutaric aciduria), hemimegalencephaly, histiocytosis X, hypoadrenocorticism, hypoparathyroidism, Jacobsen syndrome,
MASA syndrome, megalencephalic leukodystrophy,
metachromatic leukodystrophy, mucopolysaccharidoses,
neonatal progeroid syndrome, neurocutaneous syndromes (including neurofibromatosis type I, macrocephaly-capillary malformation, and multiple others),
Noonan syndrome (and cardiofaciocutaneous, Costello,
and Leopard syndromes), Opitz-Kaveggia syndrome,
Peters-plus syndrome, peroxisomal disorders, progeroid
form of Ehlers-Danlos, PTEN hamartoma syndromes
(including Bannayan-Riley-Rubalcava and Cowden syndromes), Rett syndrome/X-linked MECP2 neurodevelopmental disorder, Robinow syndrome, sebaceous nevus of
Jaddassohn, and Schwachman-Bodian-Diamond syndrome. The receipt of intervention for IEC or MGCM,
including surgery, medication, special diet, or social services referral, was a secondary outcome [6-8].
We performed a secondary analysis including benign
enlargement of the subarachnoid spaces (BESS) in the outcome because the clinical significance of this condition is
controversial. Although BESS, when diagnosed, is rarely
treated and the fluid collections generally resolve without
intervention, some studies have raised concerns about the
possibility of an association with subdural hematoma and
increased rates of developmental delay [9-17].
Independent Variables
In addition to demographic characteristics, independent
variables included the HC percentiles and z-scores as
determined by the Centers for Disease Control (CDC)
[18] and World Health Organization (WHO) [2] growth
curves as well as the primary care network (PCN) [5]
curves derived from this cohort. The determination of
HC z-scores and percentiles has been described previously. Efforts had previously been made to remove
erroneous measurements [5]. During this evaluation we
detected and excluded 3,439 additional measurements
that were likely to be erroneous (1.3% of all measurements), primarily by identifying measurement pairs
representing a decrease in HC.
Data Abstraction
Demographic data, visit and billing codes, and HC were
obtained on all subjects between the beginning of electronic record collection at that practice and 31 January
2009.
Daymont et al. BMC Pediatrics 2012, 12:9
/>
In order to identify subjects with IEC or MGCM, subjects with any of the following indicators in the clinical
databases were evaluated with chart review: an outpatient
diagnostic code for pathology that can cause abnormal
head size; an order or result for neuroimaging; a referral
to or evaluation by a relevant specialist; chromosome or
genome analysis; or billing or diagnostic codes for neurosurgery. Subjects whose only indicator was an evaluation
that occurred after the third birthday were not evaluated
further. Chart review was limited to neuroimaging results
that did not contain identifying information when possible.
Because practices in the network began using the electronic medical record at variable times, and because we
evaluated children born as late as one year before our
data collection stop-date, we had variable amounts of
information on our subjects. To assess whether inclusion
of subjects with incomplete data affected our results, we
performed a sensitivity analysis restricted to subjects
whose first recorded HC was before 1 month of age and
whose last recorded HC was after 24 months of age.
Data Analysis
All analyses were performed using Stata 11.2. Test characteristics for thresholds of the 95 th , 97 th , and 99.6 th
percentiles were evaluated; a subject with any HC-forage percentile above the threshold criterion was considered to be test-positive. The threshold criterion of crossing 2 increasing major percentile lines (MPL: the 5th,
10th, 25th, 50th, 75th, 90th, and 95th percentile lines) was
evaluated; for analytic thoroughness, criteria of crossing
4 and 6 increasing MPL were also evaluated. To determine the number of increasing MPL crossed, each subject’s highest head circumference-for-age percentile was
compared with his or her first percentile.
The sensitivity, specificity, and positive and negative
predictive values, likelihood ratios, number needed to
test, and number needed to screen for these thresholds
for identifying a) all subjects with IEC or MGCM and b)
subjects with IEC or MGCM who received intervention
were determined.
The study was reviewed and approved by the Institutional Review Board of the Children’s Hospital of
Philadelphia.
Results
We assessed 75,412 potentially eligible subjects. Of
these, 984 were excluded because of evidence of a preexisting diagnosis of an excluding condition before
their first electronically recorded HC. Of the excluded
subjects, 142 (14%) had a maximum HC over the 95th
PCN percentile, and 158 (16%) had a maximum HC
under the 5th percentile. There were 404,817 head circumference measurements on 74,428 remaining subjects (Table 1).
Page 3 of 10
Table 1 Demographic characteristics of included subjects.
Sex
Male
51%
White
50%
Black
33%
Asian
3%
Other
14%
Race
Ethnicity
Hispanic
3%
Median number HC measurements
Percent with > 1 HC measurement
5
85%
Median age first HC measurement (months)
1.2
Median age last HC measurement (months)
24.1
HC (head circumference)
Identification of Subjects with Pathology
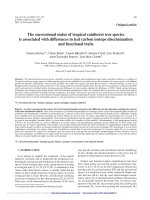
Eighty-five subjects were found to have new diagnoses
of pathology before three years of age (Figure 1). Of the
85 subjects with IEC or MGCM, 43 subjects had no
diagnostic or surgery code and were identified because
of the presence of neuroradiology orders or results, or
specialist referrals or evaluations.
Description of Diagnoses and Outcomes
Of the 85 subjects with the outcome, 56 had IEC: hydrocephalus (n = 24), chronic subdural hematoma (n = 15), cyst
(n = 8), and tumor (n = 9). Twenty-nine had MGCM: neurofibromatosis (n = 8), tuberous sclerosis (n = 5),
75,412 eligible subjects
599 excluded for having
neurosurgery or diagnostic
code for condition that can
cause abnormal head size
before first head circumference
in electronic record
74,813 subjects evaluated for
potential indicators of pathology
70,034 had no indication of
new diagnosis of IEC or
MGCM between first recorded
HC and 3 years of age
4,779 subjects had one or
more potential indicators of
pathology associated with
head enlargement during
timeframe
38 neurosurgery
499 code
2774 neuroradiology
2595 specialist
370 lab
74,428 subjects
85 diagnosed with pathology associated with head
enlargement
239 diagnosed with benign enlargement of the
subarachnoid spaces
3,597 underwent some evaluation and had no
diagnoses of intracranial expansive conditions or metabolic
or genetic conditions associated with macrocephaly
70,507 had no evidence of evaluation (473 subjects did not
receive ordered evaluations)
365 excluded due to evidence
on chart review of excluding
diagnosis before first head
circumference in electronic
record
20 excluded due to evidence
on chart review of birth weight
<1500g or gestational age <33
weeks
Figure 1 Flowchart Describing Identification of Subjects with
Outcome. IEC (intracranial expansive condition), MGCM (metabolic
and genetic conditions associated with macrocephaly).
Daymont et al. BMC Pediatrics 2012, 12:9
/>
Beckwith-Wiedemann (n = 4), and 1 or 2 subjects each
with the following diagnoses: glutaric aciduria type I,
Sturge-Weber syndrome, Sotos syndrome, Fragile X syndrome, Noonan syndrome, Leopard syndrome, BannayanRiley-Ruvalcaba syndrome, hemimegalencephaly, X-linked
MR associated with MECP2 duplication, and diffuse thickening of the skull with no known syndrome. None of the
children with conditions classified as MGCM also had
lesions large enough to be considered IEC.
There were 24 subjects who received specific intervention for pathology: 18 underwent surgery, 5 additional
subjects did not receive surgery but were referred to social
services because of concern for non-accidental trauma,
and one was prescribed a special diet. Other subjects
received variable degrees of further follow-up and evaluation, ranging from no follow-up for three subjects to multiple specialty evaluations and further neuroimaging.
Cumulative Incidence
New diagnoses of IEC or MGCM were found in 0.11%
(85/74,428) of the entire study population, with 0.03%
(24/74,428) who had pathology with subsequent
Page 4 of 10
intervention. The age at diagnosis ranged from 3 days to
1075 days (median, 200 days). Eight subjects were diagnosed before 1 month; eight were diagnosed after 24
months.
Head circumference characteristics of subjects with IEC or
MGCM
Subjects with IEC or MGCM had a wide range of head
sizes, including some with HC below the 1st percentile.
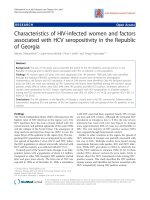
The distributions of maximum HC percentile for subjects with pathology were different from the distribution
for subjects without known pathology, but with a large
amount of overlap (Figure 2).
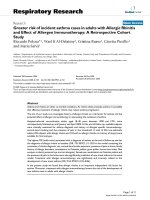
Test characteristics
The sensitivity, specificity, positive predictive value, positive and negative likelihood ratios, number needed to
screen and number needed to test varied by threshold
and curve source (Tables 2 and 3). The negative predictive value was 99.9% for each threshold. The threshold
of crossing 6 major percentiles identified 490 (CDC),
556 (WHO) and 130 (PCN) children, but none of these
Figure 2 Distribution of maximum head circumference percentiles by outcome. The gray lines indicate the location of the 95th, 97th, and
99.6th percentiles on the x-axis, which is scaled by z-score. The comparative distribution plots compare the distributions without regard to the
number of subjects in each group. The comparative frequency plots (implemented using kernel density estimators) are scaled according to the
number of subjects in each group (n = 73,343 for no IEC or MGCM, n = 29 for MGCM, n = 56 for IEC). The fact that the comparative frequency
plots for subjects with pathology are flat reflects the small number of children in these categories compared to the number of children without
pathology at most percentiles.
A
B
C
D
E
G
Threshold
Number in
source
population
Number diagnosed
with IEC or MGCM
Number
above
threshold
Number above
threshold with IEC or
MGCM
Above
CDC 95th
74,428
85
12,325
Above
74,428
WHO 95th
85
Above
PCN 95th
74,428
Above
CDC 97th
H
I
K
L
M
N
Sensitivity Specificity Positive
predictive
E/C
(B-C-(Dvalue
E))/(B-C)
E/D
Likelihood
ratio
positive
G/(1-H)
Likelihood
ratio
negative
(1-G)/H
Number
Needed to
Screen
B/E
Number
Needed to
Test
D/E
39
46%
83%
0.3%
2.8
0.6
1,908
316
18,528
47
55%
75%
0.3%
2.2
0.6
1,584
394
85
7,694
34
40%
90%
0.4%
3.9
0.7
2,189
226
74,428
85
8,373
34
40%
89%
0.4%
3.6
0.7
2,189
246
Above
74,428
WHO 97th
85
13,275
41
48%
82%
0.3%
2.7
0.6
1,815
324
Above
PCN 97th
74,428
85
4,532
29
34%
94%
0.6%
5.6
0.7
2,566
156
Above
CDC
99.6th
74,428
85
2,030
20
24%
97%
1.0%
8.7
0.8
3,721
102
Above
WHO
99.6th
74,428
85
3,438
25
29%
95%
0.7%
6.4
0.7
2,977
138
Above
PCN
99.6th
74,428
85
711
13
15%
99%
1.8%
16.3
0.9
5,725
55
Crossed 2
IMPL-CDC
64,015
83
29,206
50
60%
54%
0.2%
1.3
0.7
1,280
584
Crossed 2
IMPL-WHO
Crossed 2
IMPL-PCN
Crossed 4
IMPL-CDC
Crossed 4
IMPL-WHO
Crossed 4
IMPL-PCN
64,015
83
22,462
33
40%
65%
0.1%
1.1
0.9
1,940
681
64,015
83
13,831
26
31%
78%
0.2%
1.5
0.9
2,462
532
64,015
83
5,727
13
16%
91%
0.2%
1.8
0.9
4,924
441
64,015
83
4,372
7
8%
93%
0.2%
1.2
1.0
9,145
625
64,015
83
1,703
6
7%
97%
0.4%
2.7
1.0
10,669
284
Page 5 of 10
IEC (intracranial expansive condition); MGCM (metabolic or genetic condition associated with macrocephaly); CDC (Centers for Disease Control head circumference growth curves); WHO (World Health Organization
head circumference growth curves); PCN (primary care network head circumference growth curves); IMPL (multiple percentile lines). The negative predictive value (C-(D-E))/(C-D) was 99.9% for all thresholds. No
subjects with the outcome crossed 6 increasing MPL, so rows for that outcome were not included. Point estimates and 95% confidence intervals are presented for the thresholds with the highest and lowest
sensitivity and highest positive predictive value. The sensitivity of crossing 2 IMPL on the CDC curve for detecting children with IEC or MGCM who received intervention was 78% (95% CI: 56%, 93%). The sensitivity of
crossing 4 IMPL on the PCN curve for detecting children with IEC or MGCM was 7% (95% CI: 3%, 15%). The positive predictive value of ever being above the 99.6th percentile of the PCN curve for detecting children
with IEC or MGCM was 1.8% (95% CI: 1.0%, 3.1%).
Daymont et al. BMC Pediatrics 2012, 12:9
/>
Table 2 Test Characteristics of Selected HC Thresholds for Diagnosis of Children with IEC or MGCM
A
D
E
G
K
L
M
N
Number diagnosed with
IEC or MGCM requiring
intervention
Number
above
threshold
Number above threshold
with IEC or MGCM requiring
intervention
Sensitivity Specificity Positive
predictive
E/C
(B-C-(DE))/(B-C)
value
E/D
Likelihood
ratio
positive
G/(1-H)
Likelihood
ratio
negative
(1-G)/H
Number
Needed to
Screen
B/E
Number
Needed to
Test
D/E
Above
74,428
CDC 95th
74,428
Above
WHO
95th
24
12,325
11
46%
83%
0.1%
2.8
0.6
6,766
1,120
24
18,528
14
58%
75%
0.1%
2.3
0.6
5,316
1,323
Above
74,428
PCN 95th
24
7,694
9
38%
90%
0.1%
3.6
0.7
8,270
855
Above
74,428
CDC 97th
24
8,373
9
38%
89%
0.1%
3.3
0.7
8,270
930
74,428
24
13,275
12
50%
82%
0.1%
2.8
0.6
6,202
1,106
Above
74,428
PCN 97th
24
4,532
7
29%
94%
0.2%
4.8
0.8
10,633
647
Above
CDC
99.6th
74,428
24
2,030
6
25%
97%
0.3%
9.2
0.8
12,405
338
Above
WHO
99.6th
74,428
24
3,438
6
25%
95%
0.2%
5.4
0.8
12,405
573
74,428
Above
PCN
99.6th
Crossed 2 64,015
IMPL-CDC
24
711
5
21%
99%
0.7%
22.0
0.8
14,886
142
21
29,206
18
78%
54%
0.1%
1.7
0.4
3,566
1,623
Crossed 2 64,015
IMPLWHO
21
22,462
10
43%
65%
< 0.1%
1.2
0.9
6,402
2,246
Crossed 2 64,015
IMPL-PCN
21
13,831
9
39%
78%
0.1%
1.8
0.8
7,113
1,537
Crossed 4 64,015
IMPL-CDC
21
5,727
4
17%
91%
< 0.1%
1.9
0.9
16,004
1,432
Crossed 4 64,015
IMPLWHO
21
4,372
2
9%
93%
0.1%
1.3
1.0
32,008
2,186
Crossed 4 64,015
IMPL-PCN
21
1,703
2
9%
97%
0.2%
3.3
0.9
32,008
852
Above
WHO
97th
B
H
I
IEC (intracranial expansive condition); MGCM (metabolic or genetic condition associated with macrocephaly); CDC (Centers for Disease Control head circumference growth curves); WHO (World Health Organization
head circumference growth curves); PCN (primary care network head circumference growth curves); IMPL (increasing multiple percentile lines). The negative predictive value (C-(D-E))/(C-D) was 99.9% for all
thresholds. No subjects with the outcome crossed 6 IMPL, so rows for that outcome were not included.
Page 6 of 10
C
Threshold Number in
source
population
Daymont et al. BMC Pediatrics 2012, 12:9
/>
Table 3 Test Characteristics of Selected HC Thresholds for Diagnosis of Children with IEC or MGCM Requiring Intervention
Daymont et al. BMC Pediatrics 2012, 12:9
/>
subjects had pathology. Almost all of these children had
a corresponding increase in weight and length z-scores
of similar magnitude.
Crossing 2 increasing major percentile lines had the
highest sensitivity but lowest positive predictive value,
0.1%-0.2% (diagnosis) and < 0.1%-0.1% (intervention).
The only threshold with a number needed to test less
than 100 for diagnosis of any new pathology was the
99.6 th percentile of the CDC curve (NNT = 55). The
99.6th percentile of the PCN curve also had the highest
likelihood ratio positive at 16.3 (diagnosis) and 22.0
(intervention), but had low sensitivity (15% diagnosis,
21% intervention).
The sensitivity analysis restricted to those 15,712 children with at least one evaluable HC recorded before 1
month and one after 24 months of age showed similar
test characteristics. The cumulative incidence (0.19%)
and positive predictive values for diagnosis for the 99.6th
percentiles were somewhat higher (CDC 1.5%, WHO
0.9%, PCN 3.4%), but the sensitivity of these criteria
were low (CDC 27%, WHO 27%, PCN 23%).
When the 239 subjects diagnosed with BESS were
included in the outcome (Table 4), the sensitivities
(17%-75%), positive predictive values (0.7% - 9.7%) and
likelihood ratios positive (1.4-24.6) were higher than for
IEC and MGCM alone.
Description of subjects with pathology below the CDC
95th percentile
There were 46 subjects with pathology with IEC or
MGCM whose head circumference was never above the
CDC 95th percentile, 13 of whom received intervention.
The 25 subjects with IEC (7 with hydrocephalus, 5 with
cysts, 9 with subdural hematomas, and 4 with tumors)
were diagnosed because of increasing HC percentile,
acute altered mental status that led to the diagnosis of
underlying chronic subdural hematomas, or other neurologic signs. The 21 subjects with MGCM were primarily diagnosed because of characteristic signs unrelated to
head size, such as macroglossia or café-au-lait spots.
Discussion
The prevalence of undiagnosed IEC and MGCM in our
primary care population was lower than the overall prevalence of these conditions. Many children with IEC
and MGCM are identified before their first primary care
visit through prenatal ultrasound, newborn metabolic
screening, or evaluation in the nursery or neonatal
intensive care unit. Importantly, our findings are therefore not applicable to newborns in the nursery or neonatal intensive care unit. One case series suggests that
children born with a high HC percentile have a higher
risk of significant pathology than children who develop
a high HC percentile later [19].
Page 7 of 10
Many of the subjects with IEC or MGCM, including
subjects with hydrocephalus, had typical or even small
head sizes. One explanation for the large number of
children with pathology who had small or typical head
sizes is that some conditions associated with head enlargement will not always cause any increase in head size.
For example, neurofibromatosis is often associated with
increased head size but has a variable phenotype and
may not always cause increased head size. Furthermore,
HC does not account for all variation in head size [20]:
some conditions may cause an increase in intracranial
volume primarily by increasing the height of the intracranial space, but not the occipital-frontal circumference. A third explanation involves the wide variation in
normal HC for each age and sex: for many of the subjects with pathology but without a large HC-for-age, the
pathologic condition may have caused an increase in
head size compared to the smaller head size that child
would have otherwise had, but this increase may not
have been sufficient to raise the child’s HC above the
recommended percentile cutoffs.
Future research must focus on determining the elements of the history and physical examination that are
most useful for the early identification of IEC or
MGCM, or for reducing the number of unnecessary
diagnostic imaging evaluations among children with
large HCs. Three methods seem to have the most
potential for obtaining more information from the HC
itself. First, clinicians could evaluate the rate of change
in HC over time, in a manner more precise than measuring the number of crossed major percentile lines,
such as with growth velocity curves. Unfortunately,
accurately evaluating growth velocity is fraught with difficulty since comparing two measurements compounds
the effects of measurement error, and since head growth
occurs in a variable sequence of relatively slow and fast
periods [21-24]. Second, the association between head
circumference and other growth parameters, such as
height and weight, may provide valuable clinical information [25-27]. Third, further study of the information
provided by the head circumference of parents and
other relatives could be important in evaluating the significance of a given child’s large HC.
Autism was not included in the outcome definition.
Autism has been found to be associated with enlarged
HC in some clinical samples [28,29], but other studies,
including a longitudinal evaluation of a large community-based sample, have not found an independent association [30,31]. We do not believe that identifying
children who may be at minimally increased risk of autism has been, or should be, one of the goals of routine
HC measurements.
We included BESS in a secondary analysis rather than
the primary analysis because we do not believe that it is
A
B
C
D
E
G
K
L
M
N
Threshold
Number in
source
population
Number diagnosed
with IEC, MGCM, or
BESS
Number
above
threshold
Number above
threshold with IEC,
MGCM, or BESS
Sensitivity Specificity Positive
E/C
(B-C-(Dpredictive
E))/(B-C)
value
E/D
H
I
Likelihood
ratio
positive
G/(1-H)
Likelihood
ratio
negative
(1-G)/H
Number
Needed to
Screen
B/E
Number
Needed to
Test
D/E
Above CDC 95th
74,428
324
12,325
221
68%
84%
1.8%
4.2
0.4
337
56
Above WHO 95th
74,428
324
18,528
242
75%
75%
1.3%
3.0
0.3
308
77
Above PCN 95th
74,428
324
7,694
193
60%
90%
2.5%
5.9
0.4
386
40
Above CDC 97th
74,428
324
8,373
203
63%
89%
2.4%
5.7
0.4
367
41
Above WHO 97th
Above PCN 97th
74,428
74,428
324
324
13,275
4,532
225
167
69%
52%
82%
94%
1.7%
3.7%
3.9
8.8
0.4
0.5
331
446
59
27
Above CDC 99.6th
74,428
324
2,030
129
40%
97%
6.4%
15.5
0.6
577
16
Above WHO 99.6th
74,428
324
3,438
155
48%
96%
4.5%
10.8
0.5
480
22
Above PCN 99.6th
74,428
324
711
69
21%
99%
9.7%
24.6
0.8
1,079
10
Crossed 2 IMPL-CDC
64,015
321
29,206
223
69%
54%
0.8%
1.5
0.6
287
131
Crossed 2 IMPL-WHO 64,015
321
22,462
162
50%
65%
0.7%
1.4
0.8
395
139
Crossed 2 IMPL-PCN
64,015
321
13,831
156
49%
79%
1.1%
2.3
0.7
410
89
Crossed 4 IMPL-CDC 64,015
Crossed 4 IMPL-WHO 64,015
321
321
5,727
4,372
103
66
32%
21%
91%
93%
1.8%
1.5%
3.6
3.0
0.7
0.9
622
970
56
66
Crossed 4 IMPL-PCN
64,015
321
1,703
55
17%
97%
3.3%
6.7
0.8
1,143
30
Crossed 6 IMPL-CDC
64,015
321
490
17
5%
99%
3.5%
7.1
1.0
3,766
29
Crossed 6 IMPL-WHO 64,015
321
556
17
5%
99%
3.1%
6.3
1.0
3,766
33
Crossed 6 IMPL-PCN
321
130
10
3%
> 99%
7.7%
16.5
1.0
6,402
13
64,015
Daymont et al. BMC Pediatrics 2012, 12:9
/>
Table 4 Test Characteristics of Selected HC Percentile Thresholds for Diagnosing Children with IEC, MGCM, or BESS
IEC (intracranial expansive condition); MGCM (metabolic or genetic condition associated with macrocephaly); BESS (benign enlargement of the subarachnoid spaces); CDC (Centers for Disease Control head
circumference growth curves); WHO (World Health Organization head circumference growth curves); PCN (primary care network head circumference growth curves); IMPL (increasing multiple percentile lines). The
negative predictive value (C-(D-E))/(C-D) was 99.9% for all thresholds.
Page 8 of 10
Daymont et al. BMC Pediatrics 2012, 12:9
/>
important to identify all children with BESS. It is not
clear that BESS is at all pathological, and BESS is not
treated in most centers. Even if BESS is shown to be
associated with developmental delays which are not
detected by routine screening and for which detection is
beneficial, it does not seem necessary to expose children
to radiation or sedation in order to determine which
children should receive extra developmental testing.
BESS may be associated with an increased risk of subdural hematoma, but we are not aware of any methods
to prospectively prevent those subdural hematomas
beyond measures that would be considered proper care
for any infant.
The most important limitation to our study is the
variable follow-up time. A sensitivity analysis restricted
to those children for whom electronic information was
available before 1 and after 24 months of age did not
change the overall conclusion. We also relied upon
medical records to identify children with pathology.
Although we believe most children, especially those with
IEC, would have been identified, some children may not
have been diagnosed by three years of age. Furthermore,
despite efforts to exclude erroneous measurements,
some were certainly still included.
The strengths of our study include extensive efforts to
accurately identify all children with new diagnoses of
pathology. Evaluation of administrative data alone would
have caused a large degree of misclassification.
Conclusions
The majority of children with large heads in our primary care population, even those with a HC larger than
three standard deviations from the median or crossing
multiple increasing major percentile lines, did not have
evidence of a diagnosis of IEC or MGCM. Children with
a very high HC percentile have an increased risk for
pathology compared to other children, as indicated by a
modestly elevated positive likelihood ratio. Their absolute risk of pathology, however, is small because of the
low baseline prevalence of undiagnosed pathology in
this primary care population, as illustrated by the relative frequency plots. Furthermore, a substantial proportion of patients with IEC or MGCM had HC percentiles
below the tested thresholds. Our findings reinforce that
physicians should not be reassured by a normal, or even
low, HC percentile if there are other signs or symptoms
suggestive of conditions associated with an increased
frequency of macrocephaly.
Our findings highlight the difficulty primary care
physicians face when they try to identify asymptomatic
children with early-stage intracranial pathology while
minimizing unnecessary investigations and worry to
parents. Further research in other populations and,
ideally, prospective cohort studies are necessary to
Page 9 of 10
provide physicians with a stronger evidence base
regarding the use of these frequently performed
measurements.
Acknowledgements and Funding
We thank the Children’s Hospital of Philadelphia Pediatric Research
Consortium and the Center for Biomedical Informatics for assistance with
this study.
Dr. Daymont’s time was funded by a U.S. National Research Service Award
for Primary Medical Care (T32) Grant T32HP10026 and then by a PostDoctoral Fellowship from the Manitoba Health Research Council and the
Manitoba Institute of Child Health. No funding body had any role in the
design or conduction of the study or the decision to submit it for
publication.
Author details
Department of Pediatrics and Child Health, The University of Manitoba,
Winnipeg, Manitoba, Canada. 2The Manitoba Institute of Child Health,
Winnipeg, Manitoba, Canada. 3Department of Pediatrics, The University of
Pennsylvania, Philadelphia, Pennsylvania, USA. 4Children’s National Medical
Center, Washington DC, USA. 5Center for Clinical Epidemiology and
Biostatistics, The University of Pennsylvania, Philadelphia, Pennsylvania, USA.
6
PolicyLab, The Children’s Hospital of Philadelphia, Philadelphia, Pennsylvania,
USA.
1
Authors’ contributions
CD conceived the study, participated in its design and data collection,
performed the statistical analysis, and drafted the results, method, and
discussion. MZ participated in data collection and drafted the introduction.
CF and DR conceived the study, participated in its design, and helped to
draft and critically revise the manuscript. All authors read and approved the
final manuscript.
Competing interests
The authors declare that they have no competing interests.
Received: 28 September 2011 Accepted: 23 January 2012
Published: 23 January 2012
References
1. Cole TJ: Do growth chart centiles need a face lift? BMJ 1994,
308(6929):641-642.
2. WHO Multicentre Growth Reference Study Group: WHO Child Growth
Standards. Head circumference-for-age, arm circumference-for-age,
triceps skinfold-for-age and subscapular skinfold-for-age. Methods and
Development. World Health Organization 2007.
3. Cole TJ: Growth monitoring with the British 1990 growth reference. Arch
Dis Child 1997, 76(1):47-49.
4. Zahl SM, Wester K: Routine measurement of head circumference as a
tool for detecting intracranial expansion in infants: what is the gain? A
nationwide survey. Pediatrics 2008, 121(3):e416-420.
5. Daymont C, Hwang WT, Feudtner C, Rubin D: Head-circumference
distribution in a large primary care network differs from CDC and WHO
curves. Pediatrics 2010, 126(4):e836-842.
6. Malan V, Chevallier S, Soler G, Coubes C, Lacombe D, Pasquier L, Soulier J,
Morichon-Delvallez N, Turleau C, Munnich A, et al: Array-based
comparative genomic hybridization identifies a high frequency of copy
number variations in patients with syndromic overgrowth. Eur J Hum
Genet 2010, 18(2):227-232.
7. Michelson DJ, Shu SK: In Pediatric Neurology. Volume 1. Edited by: Swaiman
KF, Ashwal S, Ferriero DM. Philadelphia, PA: Mosby; 2006:830-831.
8. Williams CA, Dagli A, Battaglia A: Genetic disorders associated with
macrocephaly. Am J Med Genet A 2008, 146A(15):2023-2037.
9. Ghosh PS, Ghosh D: Subdural hematoma in infants without accidental or
nonaccidental injury: benign external hydrocephalus, a risk factor. Clin
Pediatr (Phila) 2011, 50(10):897-903.
10. Muenchberger H, Assaad N, Joy P, Brunsdon R, Shores EA: Idiopathic
macrocephaly in the infant: long-term neurological and
neuropsychological outcome. Childs Nerv Syst 2006, 22(10):1242-1248.
Daymont et al. BMC Pediatrics 2012, 12:9
/>
11. Alvarez LA, Maytal J, Shinnar S: Idiopathic external hydrocephalus: natural
history and relationship to benign familial macrocephaly. Pediatrics 1986,
77(6):901-907.
12. Castro-Gago M, Perez-Gomez C, Novo-Rodriguez MI, Blanco-Barca O,
Alonso-Martin A, Eiris-Punal J: Benign idiopathic external hydrocephalus
(benign subdural collection) in 39 children: its natural history and
relation to familial macrocephaly. Rev Neurol 2005, 40(9):513-517.
13. Bodensteiner JB: Benign macrocephaly: a common cause of big heads in
the first year. J Child Neurol 2000, 15(9):630-631.
14. Lorch SA, D’Agostino JA, Zimmerman R, Bernbaum J: “Benign” extra-axial
fluid in survivors of neonatal intensive care. Arch Pediatr Adolesc Med
2004, 158(2):178-182.
15. Pascual-Castroviejo I, Pascual-Pascual SI, Velazquez-Fragua R: A study and
follow-up of ten cases of benign enlargement of the subarachnoid
spaces. Rev Neurol 2004, 39(8):701-706.
16. Yew AY, Maher CO, Muraszko KM, Garton HJ: Long-term health status in
benign external hydrocephalus. Pediatr Neurosurg 2011, 47(1):1-6.
17. Wilson RK, Williams MA: Evidence that congenital hydrocephalus is a
precursor to idiopathic normal pressure hydrocephalus in only a subset
of patients. J Neurol Neurosurg Psychiatry 2007, 78(5):508-511.
18. Kuczmarski RJ, Ogden CL, Guo SS, Grummer-Strawn LM, Flegal KM, Mei Z,
Wei R, Curtin LR, Roche AF, Johnson CL: 2000 CDC Growth Charts for the
United States: methods and development. Vital Health Stat 11 2002, , 246:
1-190.
19. Ellison PH: Re-evaluation of the approach to an enlarging head in
infancy. Dev Med Child Neurol 1978, 20(6):738-745.
20. Gooskens RH, Gielen CC, Hanlo PW, Faber JA, Willemse J: Intracranial
spaces in childhood macrocephaly: comparison of length measurements
and volume calculations. Dev Med Child Neurol 1988, 30(4):509-519.
21. Caino S, Kelmansky D, Adamo P, Lejarraga H: Short-term growth in head
circumference and its relationship with supine length in healthy infants.
Ann Hum Biol 2010, 37(1):108-116.
22. Cole TJ: Presenting information on growth distance and conditional
velocity in one chart: practical issues of chart design. Stat Med 1998,
17(23):2697-2707.
23. Lampl M, Thompson AL: Growth chart curves do not describe individual
growth biology. Am J Hum Biol 2007, 19(5):643-653.
24. WHO Multicentre Growth Reference Study Group: WHO Child Growth
Standards: Growth velocity based on weight, length and head
circumference: Methods and development. Geneva: World Health
Organization; 2009.
25. Boyd J: Clinical Appraisal of Infants’ Head Size. American Journal of
Diseases of Children 1945, 69(2):71-82.
26. Dine MS, Gartside PS, Glueck CJ, Rheins L, Greene G, Khoury P: Relationship
of head circumference to length in the first 400 days of life: a
mnemonic. Pediatrics 1981, 67(4):506-507.
27. Roche AF, Guo SS, Wholihan K, Casey PH: Reference data for head
circumference-for-length in preterm low-birth-weight infants. Arch
Pediatr Adolesc Med 1997, 151(1):50-57.
28. Courchesne E, Carper R, Akshoomoff N: Evidence of brain overgrowth in
the first year of life in autism. JAMA 2003, 290(3):337-344.
29. Lainhart JE, Bigler ED, Bocian M, Coon H, Dinh E, Dawson G, Deutsch CK,
Dunn M, Estes A, Tager-Flusberg H, et al: Head circumference and height
in autism: a study by the Collaborative Program of Excellence in Autism.
Am J Med Genet A 2006, 140(21):2257-2274.
30. Dissanayake C, Bui QM, Huggins R, Loesch DZ: Growth in stature and head
circumference in high-functioning autism and Asperger disorder during
the first 3 years of life. Dev Psychopathol 2006, 18(2):381-393.
31. Barnard-Brak L, Sulak T, Hatz JK: Macrocephaly in children with autism
spectrum disorders. Pediatr Neurol 2011, 44(2):97-100.
Pre-publication history
The pre-publication history for this paper can be accessed here:
/>doi:10.1186/1471-2431-12-9
Cite this article as: Daymont et al.: The test characteristics of head
circumference measurements for pathology associated with head
enlargement: a retrospective cohort study. BMC Pediatrics 2012 12:9.
Page 10 of 10
Submit your next manuscript to BioMed Central
and take full advantage of:
• Convenient online submission
• Thorough peer review
• No space constraints or color figure charges
• Immediate publication on acceptance
• Inclusion in PubMed, CAS, Scopus and Google Scholar
• Research which is freely available for redistribution
Submit your manuscript at
www.biomedcentral.com/submit