Illiquidity, systemic risk, and macroprudential regulation: The case of Taiwan''s capital market
Bạn đang xem bản rút gọn của tài liệu. Xem và tải ngay bản đầy đủ của tài liệu tại đây (239.87 KB, 18 trang )
Journal of Applied Finance & Banking, vol. 4, no. 3, 2014, 71-88
ISSN: 1792-6580 (print version), 1792-6599 (online)
Scienpress Ltd, 2014
Illiquidity, Systemic Risk, and Macroprudential
Regulation: The Case of Taiwan's Capital Market
Po-Hsiang Huang 1, Shih-Cheng Lee2 and Szu-Lang Liao3
Abstract
The guidance formulated by G20 to assess the systemic importance of financial
institutions, markets and instruments (IMF, BIS, and FSB, 2009 [19]) analyzes that the
effective control of systemic risk is one of the most important things in the
macroprudential regulation at current stage. Although the current banking regulation
focuses on funding liquidity risk such as LCR and NSFR of Basel III, financial
institutions would actually have highly procyclical effects between funding and market
liquidity at the same time, leading to liquidity spirals and threatening to financial stability.
We therefore propose a market liquidity, systemic risk and macroregulation analysis
framework in Taiwan's capital market to fill this gap.
Comparison with the Drehmann and Juselius' empirical study (2013b), we find that
illiquidity options by using 6-month historical volatility and forecasting short-term stock
declines are effective early warning indicators (EWIs) having most stable policy
structures and minimal regulation costs. Applying AUC macroregulation criteria, we
show this illiquidity measure is also maintained fairly robustness in different intervals, e.g.
during three sub-samples and serious crisis periods. If financial institutions can diversify
the concentration of portfolios varieties, industries, and counterparty before crises by
using EWIs, the passive risk taking can be converted into the active risk management. It
is necessary to prepare the market liquidity and macroregulation framework in advance.
JEL classification numbers: C40, G01
Keywords: EWIs, macroprudential regulation, market liquidity, illiquidity option
1
Department of Money and Banking, National Chengchi University, Taipei, Taiwan.
Department of Finance, Yuan Ze University, Chung-Li, Taiwan.
3
Department of Money and Banking, National Chengchi University, Taipei, Taiwan.
2
Article Info: Received : February 27, 2014. Revised : March 17, 2014.
Published online : May 1, 2014
72
Po-Hsiang Huang, Shih-Cheng Lee and Szu-Lang Liao
1 Introduction
Financial tsunami offered a profound lesson as the pre-crisis excessive credit growth was
accompanied by huge systemic risks that ultimately led to the reversal of economy and
huge losses of the banking sector. Such losses will shake the entire financial system and
trigger a series of vicious cycles (Basel Committee on Banking Supervision, BCBS,
2010a [2], 2010b [3]); the hidden systemic risk may not be observed if we follow the
previous principles of microprudential regulation. Therefore, the current trend is to focus
on micro and macro prudential regulation at the same time to carefully regulate the
sources of risk. Meanwhile, by regulation and supervision measures, the systemic risk can
be appropriately reduced to achieve the final objective of financial stability. The guidance
formulated by G20 to assess the systemic importance of financial institutions, markets
and instruments (IMF, BIS, and FSB, 2009 [19]) analyzes that the effective control of
systemic risk is one of the most important things in the policy regulation at current stage.
Their definition of systemic risk is caused by an impairment of financial institutions and
then has serious negative consequences real economy; the main issue is that every
financial institution’s incentive is to manage its own return-risk tradeoff but not
necessarily manage the stability for the financial system as a whole. Consequently, the
macroprudential regulation focusing on shocks originating outside the financial system
can control these negative externalities rather than microprudential regulation.
This paper attempts to establish a systemic risk prudential supervision framework in
Taiwan’s capital market. For example, countercyclical capital buffer (CCB) of Basel III
argues that excessive credit growth can accumulate huge systemic risk of banks.
Therefore, the pre-event hedging mechanism should be provided via the credit to GDP
gap. Similarly, regarding the proxy indicators of the excessively systemic risk-taking in
the capital market, Bartram et al. (2007) [1] suggest that the systemic risk should rely on
measuring the impact of global financial shocks on the stock price of banks. Van Den End
(2011) [26] argues that the bank’s current systemic risk is the slumps of stock portfolio
and cash flow to pay for the necessary liquidity line, that is, deposits and other debts.
These studies confirm the guidance on liquidity capital buffers published by Committee
of European Banking Supervisors (CEBS) in 2009 that indicates lending institutions
should effectively manage these liquidity securities. In addition, insurance industry is
concerned about Solvency Capital Requirements (SCR). CEIOPS (2010) [9] suggests that
all life insurance companies must have SCR at 99.5% confidence level over a one-year
when suffering uncertain huge losses in the future. Braun et al. (2013) [6] use the falling
stock prices, interest rates and housing prices as the possible impact on Solvency Capital
Requirements. The guidance reported to the G-20 Finance Ministers and Central Bank
Governors also indicates that if a fall in asset prices weakens the financial institutions’
liquidity position and reduces the credit provided to the real economy, this would be an
important systemic event (IMF, BIS, and FSB, 2009 [19]). In summary of the above,
stock price plummet is in conformity with the concept of systemic risk, a serious negative
consequence on economy for all financial institutions.
In term of macroprudential regulation, CCB framework chooses the historical data of 25
financial crises in 36 countries and uses credit to GDP gap as the alternative measure of
the bank’s excessive credit growth. A foresighted capital protection strategy can be
established by the conversion of credit to GDP gap and capital buffer. The key point is to
establish an early warning model in 2 to 5 years before crisis to help the banking sector
build up the optimal timing of capital buffer during stress (Drehmann et al., 2011 [14],
Illiquidity, Systemic Risk and Macroprudential Regulation: Taiwan's Capital Market
73
2013a [12]). To illustrate the early warning effect further, Drehmann and Juselius (2013b)
[15] use receiver operating characteristic (ROC) curve to measure the advantages and
disadvantages of macroprudential factors. They find that credit to GDP gap and debt
service ratio (DSR) have most stable policy structures and minimal regulation costs.
Therefore, we use the similar architecture to establish an early warning mechanism for the
stock price crashes, the proxy measure of systemic risk, by using illiquidity measures.
Next, we verify the early warning effect to meet optimal requirements of macroprudential
regulation through effectiveness and robustness.
The liquidity measures can be divided into market and funding liquidity risks. The
funding liquidity risk considers the ability of the financial institutions to pay for the due
debts, such as the Liquidity Coverage Ratio (LCR), and Net Stable Funding Ratio (NSFR)
of Basel III (BCBS, 2010c [4]). The market liquidity risk refers to the difficulty or
inability of trading to sell at the preset prices. Most of the previous studies discuss the
relationship between the banks’ funding liquidity risk and macroprudential regulation
framework (BCBS, 2010c [4]; Chadha and Corrad, 2012 [10]; Van Den End and
Kruidhof, 2013 [27]). Although the current banking regulation focuses on funding
liquidity risk, banks would be affected by highly procyclical dynamics between funding
and market liquidity at the same time, leading to liquidity spirals and threatening to
financial stability (Brunnermeier, 2009 [7] ; Brunnermeier and Pedersen, 2009 [8] ;
Gravelle et al., 2013 [18]). Therefore, the market liquidity risk management has become
an important issue of discussion. Bindseil (2013) [5] argues that the decreasing market
liquidity is the most important characteristics of previous financial crises, and it will
mainly affect the prices of pledges to result in more serious liquidity depletion. It is
suggested that central banks in various countries should establish the market liquidity
buffer to realize the purpose of liquidity risk management. According to the above
conclusions, we regard illiquidity option implied liquidity insurance or bailout cost as
early warning indicators to establish the market liquidity regulation framework. We also
refer to the robustness test by Drehmann and Juselius (2013b) [15] to ensure the
compliance with the macroprudential objectives.
Another feature of macro regulation is the length of the regulation frequency. With
regulation cost considerations, CCB framework is mainly regulated on the basis of quarter,
which is unlikely the short-time liquidity measure of intraday data used in previous
discussions. Longstaff (1995) [21] describes the lack of market liquidity by illiquidity
lookback options ranging from 1 day to 5 years. Golts and Kritzman (2010) [17] also use
put options to evaluate the investors’ liquidity with the maximum term of 4 years.
Therefore, we select a quarterly illiquidity option complied with the feature of the
macroregulation of longer interval.
Studies between capital market liquidity and macroprudential regulation are few and how
to implement it in different countries has been a challenging issue. We propose a market
liquidity, systemic risk and macroregulation analysis framework by using illiquidity
options as the early warning indicator of stock declines in Taiwan’s capital market.
According to the empirical results: (1) the feature of illiquidity measure increasing before
crisis can help authorities establish the early warning system; (2) illiquidity options with
volatility of half a year can best capture the short-term decline in the future; (3) illiquidity
option-based framework can reduce macro regulation costs, and more effectively prevent
the crisis generated by short-term stock cycle. The main contribution of this paper is to
establish the effective early warning factors (EWIs) by market liquidity measures and
provide a framework to help competent authorities and financial institutions make macro
74
Po-Hsiang Huang, Shih-Cheng Lee and Szu-Lang Liao
risk management decisions.
The remainder of this paper is organized as follows: Section 2 describes the research
model; Section 3 presents the empirical study Taiwan’s market, and Section 4 offers the
conclusions and policy recommendations.
2 Research Model Framework
Unlike Liquidity Coverage Ratio (LCR), and Net Stable Funding Ratio (NSFR)
measuring individual bank’s funding liquidity (BCBS, 2010c [4]), we select illiquidity
option as the early warning indicators to meet macroprudential regulation. We now derive
this main liquidity measure formula.
2.1 Illiquidity Measure (ILM)
Differing from intraday liquidity measures, the selection of macroregulation indicators
should consider relatively long timeframes based on quarter or year to reduce regulation
costs; Longstaff (1995) [21] uses a floating-strike lookback put (without considering
dividends) with the maximum term of 5 years to measure the market illiquidity. If the
investor holds 100 units of stocks, illiquidity put option can be expressed as the following
Eq. (1):
Illiquidity Option(t ∗ ) =
∗
max �M tt −S(t ∗),0�
𝑆𝑆(𝑡𝑡)
× 100
(1)
where, t is the time to buy stocks, the stock price is S(t).
t* is the time to sell stocks, the stock price is S(t*).
M tt = max s∈[t ,t* ] S ( s ) .
*
As shown in Eq. (1), when market liquidity is higher, it is easier for investors to sell the
*
price at the highest value M tt during the transaction period [t, t*]. If the gap between
*
investor’s sell price S(t*) and highest stock price M tt is smaller, the illiquidity option
price will be lower. Conversely, if the market liquidity is poorer, the gap will be greater,
resulting in higher price of illiquidity option. In a recent related study, Kelly et al. (2012)
[20] provide financial crash insurances measured by puts on an individual financial
institution or financial sector index. Therefore, we regard this illiquidity put as an
portfolio liquidity insurance over the initial cost S(t), or the highest costs of the
government in the bailout under illiquidity conditions. In addition, the feature of
illiquidity option is positively correlated to market volatility, that is, liquidity and market
volatility are reversely proportional. As argued by Golts and Kritzman (2010) [17], when
market volatility are higher, investors (such as hedging funds) are willing to pay higher
costs to avoid the risk of falling stock prices. In other words, when the investor is faced
with higher difficulty or volatility in realizing the stock value, the liquidity insurance or
bailout cost will also increase, which can be termed as the marketability risk. The
Illiquidity, Systemic Risk and Macroprudential Regulation: Taiwan's Capital Market
75
illiquidity option pricing formula under the risk-neutral measure (Zhang, 1998 [29];
Wilmott, 2006 [28]) is as shown in Eq. (2):
Illiquidity Option(t) =
=
1
P (S(t), M0t )
𝑆𝑆(𝑡𝑡) bs
1 −rτ Q
∗
e Et {max�Mtt − S(t∗ ), 0�}
𝑆𝑆(𝑡𝑡)
σ2
+ 2r �
−rτ
−e
N[dbs 1 (S(t), M0t )]
−2𝑟𝑟
S(t) 2
� M t � 𝜎𝜎
0
�
N[−dbs (M0t , 𝑆𝑆(𝑡𝑡))]
(2)
where, S(t) is the stock buying price at the initial period of t, Mt0 is the highest price at
period [0,t].
σ is the stock price volatility; r is the market risk free interest rate,
τ is the stock holding term t*-t,
𝑑𝑑𝑏𝑏𝑠𝑠1 (𝑆𝑆(𝑡𝑡), 𝑀𝑀0𝑡𝑡 ) =
ln �
2
𝑆𝑆(𝑡𝑡)
�𝑀𝑀𝑡𝑡 � + �𝑟𝑟 + 𝜎𝜎 �2� 𝜏𝜏
0
𝜎𝜎 √𝜏𝜏
𝑑𝑑𝑏𝑏𝑠𝑠 �𝑀𝑀0𝑡𝑡 , 𝑆𝑆(𝑡𝑡)� = 𝑑𝑑𝑏𝑏𝑠𝑠1 �𝑀𝑀0𝑡𝑡 , 𝑆𝑆(𝑡𝑡)� − 𝜎𝜎√𝜏𝜏
2.2 Systemic Risk EWIs Model and Macroregulation Framework
An effective macroregulation framework should be provided early warning before
systemic risk events. Faced with the risk of falling prices and inability to trade at the ideal
prices, investors tend to hold stocks with high liquidity, resulting in the gradual depletion
of market liquidity. In this case, the higher panic volatility and shrinking trading volume
will result in plunge of the stock markets, leading to systemic risk eventsand speeding up
market collapses ultimately. Hence, the second step is to establish the early warning
model for systemic risk events (crises) by illiquidity option. Schularick and Taylor (2012)
[25], and Drehmann and Juselius (2013b) [15] use the Areas Under the Curve of ROC
(AUC) as crises early warning model. If the early warning effects are randomly predicted,
the ROC curve will be in the 45 degree of diagonal line, and the AUC accounted for 0.5
of the total. When an early warning factor has the smaller type I and type II error 4, i.e. the
forecasting ability is higher; ROC curve will be closer to the upper left boundary of the
pattern. If an indicator can be used for perfect forecasting without the type I and type II
error rates, the maximum value of AUC covering the whole space is 1.0. The AUC value
is directly proportional to the forecasting accuracy of crises occurrence.
4
Type 1 error: EWIs' signals are not issued and crises occur. Type 2 error: EWIs' signals are issued
but no crises occur.
76
Po-Hsiang Huang, Shih-Cheng Lee and Szu-Lang Liao
According to a new early warning system among 12 countries in 139 years, Schularick
and Taylor (2012) [25] find the the bank loans to GDP ratio for predicting financial crises
has the highest AUC value (0.717), which is apparently higher than the random
forecasting value 0.5. The declines in the ability of EWIs before crises will result in rising
uncertain costs of macro regulation. Following the intuition of Drehmann and Juselius
(2013b) [15], we define a crisis (no crisis) occurs if the stock decline is larger (smaller)
than the threshold k and then compute AUC(k) to analyze the effectiveness of EWIs.
Effective EWIs having most stable policy structures and minimal regulation costs for
policy making should meet three AUC macroregulation criteria:
Criterion 1: An EWI has the right timing if all AUC(ki) >0.5 for all threshold k
The lower AUC values implying the higher type I and type II error will result in rising
uncertain costs of macro regulation. In the selected thresholds, all the AUC values should
be above 0.5 to prevent the forecasting failure generated by external changes.
Criterion 2: An EWI is stable if AUC(ki)> AUC(kj) for stock decline levels ki>kj
Drehmann and Juselius (2013b) [15] argue that AUC will be higher when the timing
approaches to the crisis and vice versa. Any AUC value that reverses direction before
crises is deemed not stable for policy makers. We use the threshold of stock declines k as
the horizon. Similarly, when the crisis is more serious (ki>kj), the ability of forecasting
will be higher. Competent authorities needs to more effectively capture the serious market
plunge with higher AUC to ensure the stability of the macroprudential regulation policy.
Criterion 3: When two different EWIs show that AUC1(ki) is greater than AUC2(ki), it is
defined that the forecasting effect of AUC1(ki) is greater than AUC2(ki).
3 Empirical Results and Analysis
This section discusses whether illiquidity measure can forecast the decline in stock prices,
and establishes the macroregulation framework in Taiwan's capital market. The Taiwan
Capitalization Weighted Stock Index (TAIEX) data are from Bloomberg. Regarding
illiquidity measure, we select the illiquidity option under the endogenous measure of
stock market (Longstaff, 1995 [21]). Higher illiquidity option value represents that
liquidity is poorer. The holding time is based on the quarter. For the option risk free
interest rate, it is based on Taiwan’s 90-day commercial notes. The source of data is the
monetary market interest rate database in Taiwan Economic Journal Database (TEJ).
3.1 Relationship between Illiquidity Measure and Crisis
When establishing the CCB macroprudential framework, BCBS (2010a [2], 2010b [3])
firstly discusses the relationship between the credit to GDP gap and banking crises. It is
found that the credit to GDP gap will expand before a crisis to provide the early warning
effect. All banks are requested to increase capital buffer used in the future stress as this
gap expands. For the capital market’s regulation framework, the first step is to confirm
the time point of stock market crisis. Table 1 illustrates the eight time points of relatively
great declines in a short-term (2months) and mid-term (5months) period as observation
points of crises. It is noteworthy that the time of maximum decline sometimes lags behind
the official time of crisis occurrence. As Maroney et al. (2004) [22] found in the study of
the Asian financial crisis, changes in the expected risk and returns of the investors started
before the financial crisis and reached the maximum value in five months or later after the
Illiquidity, Systemic Risk and Macroprudential Regulation: Taiwan's Capital Market
77
official time of crisis. Therefore, how to use the information of the changes in the
liquidity before the systemic crisis to establish the macroprudential regulation model is
our most important purpose.
Table1: Time points of great declines in Taiwan's capital market
Starting Mid -Term Short-Term
Primary Cause of the Crisis
Down Point Decline
Decline
(official time)
1987:Q3 -24.24% -41.23%
Global Stock Disaster: Black Monday(1987:Q3)
Capital gains tax on securities transactions event
1988:Q3 -18.20% -20.96%
(1988:Q3)
1990:Q1 -108.48% -38.88%
Taiwan's stock market crash (1990:Q1)
1993:Q1 -21.49% -12.27% A power struggle within the Kuomintang (1993:Q1)
1995:Q1
-30.48%
-13.95%
Taiwan strait crisis (1994:Q4~1996:Q1)
1998:Q1
-32.78%
-14.00%
Asian Financial Crisis (1997:Q2)
2001:Q1
-25.13%
-13.83%
Internet Bubble (2000:Q1)
2008:Q3
-22.71%
-24.86%
Financial Tsunami (2007~08)
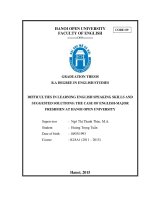
Next, we explore the relationship between Taiwan’s illiquidity indicators and stock
market crises. Figure 1 illustrates the trajectory of illiquidity option in different historical
volatility. In line with the findings of Naes et al. (2011) [23], illiquidity measures are
reached the maximum value during the crises. Therefore, designing a hedging system is
very important for policy makers. In almost all cases, illiquidity option value gradually
increases before crises, in particular during global stock disaster and financial tsunami
period. This feature can effectively help competent authorities to establish the early
warning system and the macroprudential framework.
Figure1: Trajectory of illiquidity Measure under different volatility measure
The descriptive statistics of the illiquidity options for three types of volatility measures
(Longstaff, 1995 [21]) are as shown in Table 2:
78
Po-Hsiang Huang, Shih-Cheng Lee and Szu-Lang Liao
Table 2: Descriptive Statistics on illiquidity Measure (ILM)
Summary Statistics on ILM
illiquidity Option (ILO)
Mean
Median
Std
Max
Min
Quarterly historical volatility
1.95
1.63
1.79
13.68
0.08
6-month historical volatility
1-year historical volatility
2.45
2.76
2.03
2.30
1.95
1.88
12.74
9.81
0.34
0.48
As the indicator is the endogenous measure, if the stock volatility increases, the market
liquidity starts to decline during the same holding period. We find the historical volatility
in Taiwan’s stock market and its calculation intervals are in direct proportion. Table 2
suggests that the average price of maximum illiquidity option (ILO) is 1-year historical
volatility, and the average price calculated on the quarterly volatility is the lowest. It also
confirms the conclusions of Longstaff (1995) [21] in the illiquidity options of the U.S.
Treasury Securities.
3.2 The EWIs Macroregulation Framework
This section determines the effectively warning indicators (EWIs) under the
macroregulation framework. First, the timing of crisis occurrence is measured by
dramatic declines in stock prices over a threshold. For example, Solvency II considers the
losses of the insurance companies' stock portfolio exceed 99.5 % confidence interval
during 1 year, namely insurance companies suffer huge losses and then lack solvency.
Similarly, Taiwan's Financial Supervisory Commission (FSC) uses the continuous
declines of stock prices in 3 months as the indicator to measure the external liquidity risk.
Consequently, we use the TAIEX continuous declines in short-term (2months), mid-term
(5months) or long-term (11months) 5 as the proxy factors of systemic risk negative
externalities. By referring to Escanciano and Olmo(2011) [16] in the measurement of
Robust Backtesting Tests for Value-at-risk by using 90%, 95% and 99% confidence
intervals, Table 3 selects the 90% and 95% quantile of historical stock declines as the
baseline threshold. We inspect the forecasting ability of EWIs when stock declines
accompanied with serious systemic risk excess over thresholds.
Horizon
5
Table 3: Summary Statistics on Stock Return
Mean Median
Std
95 Quantile
90 Quantile
long-term decline
mid-term decline
7.41%
3.62%
6.00%
2.00%
0.349
0.245
-49.60%
-28.00%
-31.20%
-23.00%
short-term decline
1.77%
1.00%
0.150
-16.50%
-13.80%
We use the quarterly, semiannual and annual volatility data to construct the illiquidity option and
set the short, mid-term and long term frequencies by 2months, 5months and 11months to avoid the
confusion of two periods of same length.
Illiquidity, Systemic Risk and Macroprudential Regulation: Taiwan's Capital Market
79
Secondly, we need to build up the EWIs macroregulation framework. Drehmann and
Juselius (2013b) [15] argue that good EWIs’ signals would be able to respond before the
timing of crisis occurrence, so that the follow-up policies can be efficiently implemented.
Conversely, too early response would lead to the high-cost of macroprudential regulation.
When verifying the effect of EWIs during banking crises cycles, Drehmann et al. (2010)
[13] argue that EWIs’ signals should respond no more than 3 years before a banking crisis.
In other hand, they analyze that the EWIs’ signals issued in the first two years after a
banking crisis should not be considered because financial institutions should establish the
relevant hedging strategies at this moment such as releasing capital buffer or reducing risk
assets to survive the crisis rather than providing early warning. However, empirically, the
duration of banking crisis cycles ranges from 5 to 20 years, with a mean of around 15
years (Drehmann et al., 2010[13]). This implies that the credit cycles are longer than the
business cycles in OECD countries (Cotis and Coppel, 2005[11]). We similarly find the
banking crises cycles are between 3 to 4 times longer than the Taiwan' stock market
cycles. Under this premise, we require that illiquidity measures need to signal the timing
of crisis occurrence a least ahead of 1 year and exclude the 2 quarters after the crisis so
that macroregulation policy can be implemented in time.
Finally, we compare the AUC macroregulation criteria of illiquidity options in different
historical volatility. All AUC values are as shown in Appendix A, and the EWIs’ optimal
AUC values in different volatility measures are as shown in Table 4:
Table 4: The Best Early Warning Ability in different decline levels
Horizon: short-term decline
Stock Drops over the Threshold
13.80%
15.00%
16.30%
17.50%
6-month historical volatility AUC
0.77
0.87
0.67
0.77
0.87
0.67
0.82
0.92
0.73
0.83
0.93
0.72
0.05
0
0.05
0
0.05
0
0.05
0
Upper 95% confidence interval
Lower 95% confidence interval
Stand Deviation
p-value
(***)
(***)
(***)
(***)
***,** and * are respectively at 1% ,5% and 10% significance level
80
Po-Hsiang Huang, Shih-Cheng Lee and Szu-Lang Liao
Table 4 (continued): The Best Early Warning Ability in different decline levels
Horizon: mid-term decline
Stock Drops over the Threshold
23.00%
25.50%
28.00%
30.50%
6-month historical volatility AUC
0.75
0.84
0.65
0.79
0.88
0.7
0.68
0.78
0.57
0.67
0.79
0.55
0.05
0
0.05
0
0.06
0.01
0.06
0.03
(***)
(***)
(***)
(**)
Upper 95% confidence interval
Lower 95% confidence interval
Stand Deviation
p-value
Horizon- long-term decline
Stock Drops over the Threshold
32.00%
38.00%
44.00%
50.00%
6-month historical volatility AUC
Upper 95% confidence interval
0.70
0.8
0.67
0.79
0.66
0.79
0.65
0.8
Lower 95% confidence interval
Stand Deviation
0.59
0.05
0.56
0.06
0.52
0.07
0.5
0.08
p-value
0
(***)
0.01
(***)
0.04
(**)
0.06
(*)
***,** and * are respectively at 1% ,5% and 10% significance level
As shown in Table 4, the illiquidity option (ILO) by using 6-month historical volatility is
the best EWIs complying with the AUC macroregulation criteria, regardless of AUC or its
upper and lower confidence intervals at 95% confidence interval are in line with Criterion
1. Only the short-term decline is in line with Criterion 2, that is, the early warning ability
AUC of illiquidity option increases when a stock market crash is more serious. According
to Criterion 3, the early warning ability in the short-term decline period is better than the
other two, and reaches the highest level when the stock market slumps in excess of 17.5%
level. By comparison of macroprudential regulation EWIs, Drehmann and Juselius (2013b)
[15] empirically confirm the optimal AUC average values are credit to GDP gap (at 0.84)
and DSR (at 0.80). We show the illiquidity option (AUC average value at 0.80) predicting
the short-term decline can be used indeed as the macroprudential regulation EWIs for the
capital market by competent authorities.
3.3 Robustness Test
This section tests robustness in forecasting the short-term decline. This focus is on
whether the early warning ability AUC can be maintained stable in different periods of
time. Drehmann and Juselius (2013b) [15] check the robustness test by different periods
and crisis samples. For different periods, a total sample is split into two roughly equal
parts to confirm the indicator robustness. For higher rigorousness, Table 5 illustrates the
robustness testing of best EWIs predicting the short-term decline in three sub-samples.
Illiquidity, Systemic Risk and Macroprudential Regulation: Taiwan's Capital Market
81
Table 5: Early Warning Ability -AUCs in Sub-Samples
Horizon- short-term decline -1978:Q1~1989:Q2
Stock Drops over the Threshold
13.80%
15.00%
16.30%
17.50%
6-month historical volatility AUC
0.86
0.99
0.73
0.86
0.99
0.73
0.89
1
0.75
0.89
1
0.75
0.07
0
0.07
0
0.07
0
0.07
0
(***)
(***)
(***)
(***)
Upper 95% confidence interval
Lower 95% confidence interval
Stand Deviation
p-value
Horizon- short-term decline -1989:Q3~2001:Q3
Stock Drops over the Threshold
13.80%
15.00%
16.30%
17.50%
6-month historical volatility AUC
Upper 95% confidence interval
0.65
0.82
0.73
0.9
0.73
0.9
0.81
1
Lower 95% confidence interval
Stand Deviation
0.48
0.09
0.56
0.09
0.56
0.09
0.62
0.1
p-value
0.11
0.02
0.02
0.01
(**)
(**)
(**)
***,** and * are respectively at 1% ,5% and 10% significance level
Table 5 (continued): Early Warning Ability -AUCs in Sub-Samples
Horizon- short-term decline -2001:Q2~2012:Q1
Stock Drops over the Threshold
13.80%
15.00%
16.30%
17.50%
6-month historical volatility AUC
Upper 95% confidence interval
0.75
0.91
0.75
0.91
0.75
0.91
0.75
0.91
Lower 95% confidence interval
Stand Deviation
0.59
0.08
0.59
0.08
0.59
0.08
0.59
0.08
0.1
0.1
0.1
0.1
(*)
(*)
(*)
(*)
***,** and * are respectively at 1% ,5% and 10% significance level
p-value
As shown in Table 5, the AUC values in three periods comply with the first and two
macroregulation criteria 6. In the first two periods, especially the early warning ability of
6
In the period from 2001 to 2012, only illiquidity option value during financial tsunami was greater
than thresholds; therefore, the early warning ability of each threshold is the same in this interval.
82
Po-Hsiang Huang, Shih-Cheng Lee and Szu-Lang Liao
17.5% of decline is perfect 1 at upper 95% confidence interval. The increasing early
warning ability with serious slump degree shows that the macroprudential stability can be
maintained in the period of short-term decline. From the policy perspective, it can be
found that illiquidity option (ILO) is still a good EWI in different short-term sub-periods.
In addition, regarding the robustness of illiquidity options during different crises intervals,
two intervals of maximum declines are selected from Table1: the Taiwan's stock market
crash in 1987 ~1990 and the financial tsunami in 2008. The results by using the 17.50%
declines as the testing threshold and 5-years historical data before crises are as shown in
Table 6.
Table 6: Early Warning Ability -AUCs in Crises Periods
Horizon- short-term decline -Crisis
AUC-1987~1990
AUC2-2008
Threshold=17.50%
Taiwan's stock market crash Financial Tsunami
6-month historical volatility AUC
0.94
0.86
Upper 95% confidence interval
1
1
Lower 95% confidence interval
0.86
0.71
Stand Deviation
p-value
0.04
0
0.08
0.03
(***)
(**)
***,** and * are respectively at 1% ,5% and 10% significance level
Table 6 suggests that illiquidity option performs better in the first interval, and the upper
boundaries of the two crises at 95% confidence interval are both perfect early warning
AUC. Moreover, the early warning ability before a crisis is higher than the general time
as shown in Table 4. This means the occurrence of crisis cannot be predicted; however,
the early warning ability of illiquidity options rises when getting close to a crisis. By the
above analysis, we find the illiquidity option is an effective and robust macroprudential
tool in different periods. We select the illiquidity options by using 6-month historical
volatility and forecasting short-term stock declines as the optimal EWIs in Taiwan’s
capital market.
5 Conclusion
Scholes et al. (2011) [24] point out risk management should include the impact of
unexpected systemic risks and liquidity declines to create a highly efficient framework.
Maroney et al. (2004) [22] find the investors start to change their expected risk and
returns before the Asian financial crisis. Therefore, how to use the liquidity information
before the systemic crises to establish the macroprudential regulation model is our most
important purpose. Meanwhile, the effective control of systemic risk is the focus of policy
regulation and risk management at the present stage.
First, the timing of systemic risk occurrence is measured by dramatic declines in stock
prices over a threshold. It also complies with the concept of systemic risk with serious
negative consequences on economy as proposed by IMF, BIS, and FSB (2009) [19].
Illiquidity, Systemic Risk and Macroprudential Regulation: Taiwan's Capital Market
83
Secondly, we select the illiquidity options as the early warning indicators (EWIs). The
measure means the portfolio liquidity insurances or the highest costs of the government in
bailing out the market liquidity. Finally, we use AUC macroregulation criteria to test the
effectiveness and robustness of early warning ability. The empirical results are as shown
below:
(1) Before the timing of systemic risk occurrence, especially, 1987~1990 Taiwan's stock
market crash and 2008 financial tsunami, there was apparent shortage of liquidity,
suggesting that the liquidity insurance or the governmental bailout cost will increase
consequently. The feature of illiquidity options increasing before crises can help
authorities establish the early warning system, confirming the objective of predicting
systemic risk.
(2) By comparison with the empirical optimal EWIs of Drehmann and Juselius
(2013b)[15], we propose that illiquidity options with volatility of half a year offering
the warning of future short-term declines (AUC average value is at 0.80) can be used
as the best EWIs. This illiquidity option in compliance with AUC macro regulation
Criteria1~ Criterion 3 has most stable policy structures and minimal regulation costs.
(3) In the three equally divided time intervals, all AUC values of the best EWI are in line
with early warning principles of robustness. Moreover, the early warning ability
before the serious crisis is higher than the general time. From the policy perspective, it
can be found that illiquidity option (ILO) is a fairly stable EWI to forecast the
short-term declines.
With such EWI tools, we can use this mechanism to bring about the macroprudential
regulation to reduce the impact of the stock market or add into current VaR systems. If
financial institutions can diversify the concentration of portfolios varieties, industries, and
counterparty before crises by using EWIs, the passive risk taking can be converted into
the active risk management. In addition, it can be found as shown in Figure 3, liquidity
shortage starts to appear in 2011-2013 in Taiwan’s capital market during Euro crisis and
capital gains taxation events. Whether it can result in the structural change of market
liquidity will be of great concern. Hence, it is necessary to prepare the capital market
liquidity regulation measures in advance.
According to the CCB macroregulation mechanism of Basel III, BCBS requires that
competent authorities in various countries to establish a complete information disclosure
of EWIs system. The regulation indicators such as Credit-to-GDP gap can help the
banking industry in early hedging. Therefore, regarding the liquidity risk generated by the
capital market, combined with other possible variables such as price spread or individual
portfolio concentration, all financial institutions can construct the more complete
macroprudential mechanism.
References
[1]
[2]
[3]
Bartram, SM., Brown, GW., Hund, JE., Estimating systemic risk in the international
financial system. Journal of Financial Economics, 86(3), 2007, 835–869. 22.
Basel Committee on Banking Supervision, Basel III: International Framework for
Liquidity risk measurement, standards and monitoring, Bank for International
Settlements. 2010c.
Basel Committee on Banking Supervision, Countercyclical Capital Buffer Proposal.
Bank for International Settlements, 2010a.
84
Po-Hsiang Huang, Shih-Cheng Lee and Szu-Lang Liao
[4]
Basel Committee on Banking Supervision, Guidance for National Authorities
Operating the Countercyclical Capital Buffer, Bank for International Settlements.
2010b.
Bindseil, U., Central bank collateral, asset fire sales, regulation, and liquidity.
European Central Bank Working Paper Series, No. 1610, 2013.
Braun, A., Schmeiser, Hato., Siegel, C., The Impact of Private Equity on a Life
Insurer’s Capital Charges under Solvency II and the Swiss. Working Papers.
Article first published online: 14 FEB 2013 Journal of Risk and Insurance, No.91.
Brunnermeier, MK., Deciphering the Liquidity and Credit Crunch 2007–2008.
Journal of Economic Perspectives 23 (1), 2009,77–100.
Brunnermeier, MK., Pedersen, LH., Market Liquidity and Funding Liquidity.
Review of Financial Studies 22 (6), 2009, 2201–238.
CEIOPS, 2010. QIS5 Technical Specifications.
Chadha, JS., Corrad, L., Macro-prudential Policy on Liquidity: What Does a DSGE
Model Tell Us? Journal of Economics and Business 64(1), January–February 2012,
Pages 37–62
Cotis, J.P., Coppel, J., Business cycle dynamics in OECD countries: evidence,
causes and policy implications. RBA Annual Conference. Volume, in: C. Kent and
D. Norman (ed), “The Changing Nature of the Business Cycle”, Reserve Bank of
Australia, 2005.
Drehmann, M., Borio, C., Gambacorta, L., Jimenez, G., Trucharte, C.,
Countercyclical Capital Buffers: Exploring Options. Bank for International
Settlements, Working Paper No. 317, July 2010.
Drehmann, M., Borio, C., Tsatsaronis, K., Anchoring countercyclical capital buffers:
the role of credit aggregates. International Journal of Central Banking, 7(4), 2011,
pp 189–240.
Drehmann, M., Juselius, M., Evaluating early warning indicators of banking crises:
Satisfying policy requirements. Bank for International Settlements, Working Papers,
no 421, August 2013b.
Drehmann, M., Total credit as an early warning indicator for systemic banking
crises. BIS Quarterly Review, 41, 2013a.
Escanciano, J., Olmo, J., Robust Backtesting Test for Value-at-Risk. Journal of
Financial Econometrics 9(1), 2011,132-161.
Golts, M., Kritzman, M., Liquidity options. The Journal of Derivatives. 18(1), 2010,
pp. 80-89
Gravelle, T., Grieder, T., Lavoie, S., Monitoring and Assessing Risks in Canada’s
Shadow Banking Sector. Financial System Review, 55, 2013.
International Monetary Fund, Bank for International Settlements, and Financial
Stability Board., Guidance to Assess the Systemic Importance of Financial
Institutions, Markets and Instruments: Initial Considerations, 2009.
Kelly, B. T., Lustig, HN., Nieuwerburgh SV., Too-systemic-to-fail:What option
markets imply about sector-wide government guarantees. Working Paper, Chicago
Booth School of Business, 2012.
Longstaff, F. A., How much can marketability affect security values? Journal of
Finance 50 (5), 1995, 1767-1774.
Maroney, N., Naka, A., Wansi, T., Changing risk, return, and leverage: The 1997
Asian financial crisis. Journal of Financial and Quantitative Analysis 39, 2004,
143-166.
[5]
[6]
[7]
[8]
[9]
[10]
[11]
[12]
[13]
[14]
[15]
[16]
[17]
[18]
[19]
[20]
[21]
[22]
Illiquidity, Systemic Risk and Macroprudential Regulation: Taiwan's Capital Market
85
[23] Naes, R., Skjeltorp, JA., Odegaard, BA., Stock market liquidity and the business
cycle. The Journal of Finance, 66(1), 2011, 139-176.
[24] Scholes, MS., Kimner, T., Evolving from Quantitative Risk Management to a
High-Performance Risk Management Analytic Framework Insights on a new
direction for risk management, 2011.URL:
www.sas.com/resources/whitepaper/wp_18182.pdf
[25] Schularick, M., Taylor, A.M., 2012. Credit Booms Gone Bust: Monetary Policy,
Leverage Cycles and Financial Crises, 1870-2008. American Economic Review 102,
2, 1029-1062
[26] Van Den End, JW., Kruidhof, Mark., Modelling the liquidity ratio as
macroprudential instrument. Journal of Banking Regulation, 14, 2013, 91–106.
[27] Van Den End, JW., Liquidity stress-tester: A model for stress-testing banks’
liquidity risk. CESifo Economic Studies, 56(1), 2011, pp. 38-69.
[28] Wilmott, P., Paul Wilmott on Quantitative Finance, 2nd Edition, Wiley, 2006.
[29] Zhang, PG., Exotic Options: A Guide to Second Generation Options, World
Scientific, 1998.
86
Po-Hsiang Huang, Shih-Cheng Lee and Szu-Lang Liao
Appendix
Table A.1: Early Warning Ability -AUCs in Short-Term Declines
Horizon- Horizon: short-term decline
Stock Drops over the Threshold
13.8%
15.0%
16.3%
17.5%
Quarterly historical volatility AUC
0.75
0.75
0.79
0.80
Upper 95% confidence interval
0.85
0.85
0.89
0.91
Lower 95% confidence interval
0.65
0.65
0.69
0.69
Stand Deviation
0.05
0.00
(***)
13.8%
0.05
0.00
(***)
15.0%
0.05
0.00
(***)
16.3%
0.06
0.00
(***)
17.5%
0.77
0.87
0.77
0.87
0.82
0.92
0.83
0.93
0.67
0.05
0.00
(***)
0.67
0.05
0.00
(***)
0.73
0.05
0.00
(***)
0.72
0.05
0.00
(***)
13.8%
15.0%
16.3%
17.5%
0.77
0.77
0.81
0.82
p-value
Stock Drops over the Threshold
6-month historical volatility AUC
Upper 95% confidence interval
Lower 95% confidence interval
Stand Deviation
p-value
Stock Drops over the Threshold
1-year historical volatility AUC
Upper 95% confidence interval
Lower 95% confidence interval
Stand Deviation
0.87
0.87
0.92
0.93
0.66
0.66
0.71
0.70
0.05
0.05
0.05
0.06
0.00
0.00
0.00
0.00
p-value
(***)
(***)
(***)
(***)
***,** and * are respectively at 1% ,5% and 10% significance level
Illiquidity, Systemic Risk and Macroprudential Regulation: Taiwan's Capital Market
87
Table A.2: Early Warning Ability -AUCs in Mid -Term Declines
Horizon- mid-term decline
Stock Drops over the Threshold
23.0%
25.5%
28.0%
30.5%
0.75
0.67
0.68
0.82
0.84
0.77
0.78
Lower 95% confidence interval
0.63
0.66
0.57
0.57
Stand Deviation
0.05
0.00
(***)
23.0%
0.05
0.00
(***)
25.5%
0.05
0.02
(**)
28.0%
0.05
0.02
(**)
30.5%
0.75
0.84
0.79
0.88
0.68
0.78
0.67
0.79
0.65
0.05
0.00
(***)
0.70
0.05
0.00
(***)
0.57
0.06
0.01
(***)
0.55
0.06
0.03
(**)
23.0%
25.5%
28.0%
30.5%
Quarterly historical volatility AUC
0.72
Upper 95% confidence interval
p-value
Stock Drops over the Threshold
6-month historical volatility AUC
Upper 95% confidence interval
Lower 95% confidence interval
Stand Deviation
p-value
Stock Drops over the Threshold
1-year historical volatility AUC
Upper 95% confidence interval
Lower 95% confidence interval
Stand Deviation
0.75
0.79
0.66
0.62
0.84
0.88
0.78
0.75
0.65
0.69
0.54
0.48
0.05
0.05
0.06
0.07
0.00
0.00
0.03
0.13
p-value
(***)
(***)
(**)
***,** and * are respectively at 1% ,5% and 10% significance level
88
Po-Hsiang Huang, Shih-Cheng Lee and Szu-Lang Liao
Table A.3: Early Warning Ability -AUCs in Long -Term Declines
Horizon- long-term decline
Stock Drops over the Threshold
32.0%
38.0%
44.0%
50.0%
Quarterly historical volatility AUC
Upper 95% confidence interval
0.68
0.66
0.66
0.65
0.78
0.77
0.78
0.79
Lower 95% confidence interval
0.58
0.55
0.53
0.51
Stand Deviation
0.05
0.00
(***)
32.0%
0.06
0.02
(**)
38.0%
0.06
0.04
(**)
44.0%
0.07
0.06
(*)
50.0%
0.70
0.80
0.67
0.79
0.66
0.79
0.65
0.80
0.59
0.05
0.00
(***)
0.56
0.06
0.01
(***)
0.52
0.07
0.04
(**)
0.50
0.08
0.06
(*)
32.0%
38.0%
44.0%
50.0%
p-value
Stock Drops over the Threshold
6-month historical volatility AUC
Upper 95% confidence interval
Lower 95% confidence interval
Stand Deviation
p-value
Stock Drops over the Threshold
1-year historical volatility AUC
Upper 95% confidence interval
Lower 95% confidence interval
Stand Deviation
0.70
0.69
0.63
0.62
0.81
0.81
0.77
0.78
0.59
0.57
0.49
0.47
0.06
0.06
0.07
0.08
0.00
0.01
0.09
0.12
p-value
(***)
(***)
(*)
***,** and * are respectively at 1% ,5% and 10% significance level