The impact of economic policy uncertainty on real estate development in China
Bạn đang xem bản rút gọn của tài liệu. Xem và tải ngay bản đầy đủ của tài liệu tại đây (598.91 KB, 18 trang )
Journal of Applied Finance & Banking, Vol. 10, No. 4, 2020, 25-42
ISSN: 1792-6580 (print version), 1792-6599(online)
Scientific Press International Limited
The Impact of Economic Policy Uncertainty on
Real Estate Development in China
Miao Li1, Gaoqiang Wu2
Abstract
This paper analyzes the impact of economic policy uncertainty on real estate
development at the macro level in China. Using the Economic Policy Uncertainty
(EPU) Index released by Baker et al. (2016), we find that EPU has a leading and
negative effect on real estate development investment. And there is a positive
relationship between EPU innovations and the growth rate of real estate
development investment. Moreover, the restraining effect of EPU is more
pronounced in the state-owned enterprises’ investment and the part of construction
and installation investment. Based on the empirical evidences, we suggest that
government should pay attention to the negative impact of economic policy
uncertainty and maintain consistency and stability of economic policies.
JEL classification numbers: D81, R31, R38, G31
Keywords: Economic policy uncertainty, Real estate development, Real option
theory
1
2
PBC School of Finance, Tsinghua University.
School of Economics, Renmin University of China.
Article Info: Received: February 4, 2020. Revised: February 17, 2020.
Published online: May 1, 2020.
26
Miao Li and Gaoqiang Wu
1. Introduction
This paper explores the relationship between economic policy uncertainty (EPU)
and real estate development investment. In the past decades, real estate development
investment has experienced explosive growth and constitutes a significant fraction
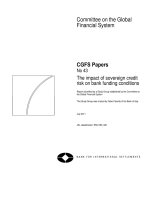
of fixed asset investment. Figure 1 shows the series of real estate development
investment and its contribution to China’s GDP. From 2000 to 2018, real estate
development investment has been growing more than 24 times, with an average
annual growth rate of 19.6%. In 2018, real estate development investment amounted
to 12 trillion RMB, which accounted for nearly 19% of fixed asset investment and
13.4% of GDP. Moreover, because of its high volatility, real estate development
investment has an impact on the macro-economy that is much larger than its relative
size (Davis & Van Nieuwerburgh, 2015). Zhang et al. (2012) find that a 1% increase
in real estate development investment induces a 3.15% increase in China’s GDP.
14000
16.00
12000
14.00
10000
12.00
10.00
8000
8.00
6000
6.00
real estate development investment: billion RMB
2018
2017
2016
2015
2014
2013
2012
2011
2010
2009
2008
2007
2006
2005
2004
2003
0.00
2002
2.00
0
2001
4.00
2000
2000
4000
real estate development/GDP: %
Figure 1: Real estate development investment and its contribution to GDP
Note: The data is from National Bureau of Statistics of China (NBSC).
In addition to its significance to economic growth, the dynamics of real estate
development investment has important implications for dealing with China’s
housing affordability problem. In the past decade, Chinese housing market has
experienced fast price growth (Wu et al., 2014). And the growth and volatility of
house prices are often ascribed to demand-side factors. But understanding housing
supply is also critical in alleviating the problem of soaring housing prices. In fact,
empirical investigations of housing supply have been lagging behind that on
housing demand and there is much to learn about the supply side of the housing
market. Real estate development investment generates a massive supply of new
houses. The annual floor area of new starts increases from 283 million square meters
in 2000 to 2.1 billion square meters in 2018. Understanding real estate development
investment can help understand new housing supply and housing market.
The Impact of Economic Policy Uncertainty on Real Estate Development in China
27
There are numerous factors that might affect real estate development investment.
One of the most important is policy change which will affect the environment in
which real estate developers operate and hence their investment behavior. Policy
uncertainty reflects the unexpected changes that might have a direct effect on firms’
investment and production decisions. Besides, China’s real estate market faces
frequent intervention from government due to its critical importance for China’s
economic growth. Policy uncertainty might play a more important role in shaping
real estate developers’ behavior. Therefore, it is of great interest to examine the
impact of policy uncertainty on China’s real estate development investment.
Existing studies have provided empirical evidence that economic policy uncertainty
can depress economic activities such as corporate investment, economic growth. It
is important to examine if the impact of economic policy uncertainty results in
similar or different effect on real estate development investment from other
macroeconomic indicators. These results may provide policy implications for
government on the real estate market.
Thus, this study tries to investigate the impact of economic policy uncertainty on
new housing supply at the macro level in China. The impact of uncertainty on
housing prices and housing market returns has been examined before, but there is
little focus on housing supply. We choose real estate development investment as the
key indicator of new housing supply and use the growth rate of real estate
development investment as the main dependent variables. To measure economic
policy uncertainty, we adopt the index developed by Baker et al. (2016) which has
been tested to be a good proxy of economic policy uncertainty. Using nationwide
data from 2004 to 2018, this paper finds that economic policy uncertainty has an
important impact on real estate development investment in China. First, an increase
in economic policy uncertainty can dampen real estate development investment
which is consistent with prior evidence for general corporate investment. Second,
there is a positive relationship between economic policy uncertainty variation,
which means that an increase in economic policy variation can promote real estate
development investment. Third, economic policy uncertainty has a more significant
effect on construction and installment investment and SOEs’ investment. These
results still hold when we apply a number of additional robustness checks. In
particular, this paper uses provincial panel data and an alternative proxy for
economic policy uncertainty. Until now, this paper is one of the first studies to
investigate the relation between economic policy uncertainty and real estate
development investment and these findings contribute to the literature and offer
meaningful suggestions to policy making on real estate market.
The rest of the paper proceeds as following. The second section reviews the existing
literature that is most related to this study and develops main hypotheses. The third
section presents research methods and describes the sample and variables. The
fourth section presents the empirical results and conducts robustness tests. The last
section concludes the entire paper.
28
Miao Li and Gaoqiang Wu
2. Literature Review and hypotheses development
Existing literature that is closely related to this paper can be divided into three parts.
The first strand is the measurement of economic policy uncertainty. There are many
methods to measure policy uncertainty such as measuring important meetings,
official turnover, and variances of important macroeconomic indicators. One of the
widely-used methods is an economic policy uncertainty index proposed by Baker
et al. (2016). They construct economic policy uncertainty indices using contents in
newspaper article for 23 countries, including all G10 economies. And for China
they use information from the South China Morning Post, a Hong Kong-based
English newspaper. This index provides a relatively objective estimation based on
newspapers and utilizes high-frequency data. Nowadays, this economic policy
uncertainty index has been proofed to be a good indicator of real economic policy
uncertainty and has been widely used in many empirical studies. To conduct the
robustness check, we also use an alternative measure of economic policy
uncertainty which is developed by Huang and Luk (2018). This index is constructed
using 10 mainland Chinese newspapers while Baker et al. (2016) uses only one
newspaper in Hong Kong. This index is proved to be not sensitive to media
censorship in China.
The second strand of literature is on the effect of economic policy uncertainty on
the housing market. Existing studies mainly focus on the impact of policy
uncertainty on housing market returns. Existing studies have studied German (Su et
al., 2016), Japan (Anoruo, Akpom, & Nwoye, 2017), America (André, BongaBonga, Gupta, & Muteba Mwamba, 2017) , other developed economies (Christou,
Gupta, & Hassapis, 2017; El Montasser et al., 2016) and developing economies
(Aye, 2018; W.L. Huang, Lin, & Ning, 2018). But the research on the relationship
between economic policy uncertainty and housing market returns has been
inconclusive. Most studies find that the EPU could help in predicting real housing
returns. But Aye (2018) finds no evidence of economic policy uncertainty causing
real housing returns except for Chile and China.
The third strand is on the effect of economic policy uncertainty on investment
behavior. Economic policy uncertainty has a significant influence on corporate
investment. Increased economic policy uncertainty may weigh on confidence and
thus decrease investors’ investment spending. There are many empirical studies
using the economic policy uncertainty index developed by Baker et al. (2016) to
examine the effect of economic policy uncertainty on corporate investment. Gulen
and Ion (2016) finds that a strong negative relationship between firm-level capital
investment and economic policy uncertainty, and policy uncertainty can depress
corporate investment by inducing precautionary delays due to investment
irreversibility. There are similar results for Chinese corporate investment. Wang et
al. (2014) examines how economic policy uncertainty influences corporate
investment for Chinese listed companies and they find that when the degree of
economic policy uncertainty increase, firms stand to lower their investment.
To summarize the above, despite previous literature demonstrating the impact of
The Impact of Economic Policy Uncertainty on Real Estate Development in China
29
economic policy uncertainty on corporate investment and on housing markets
returns, studies on the impact of economic policy uncertainty on real estate
development investment and new housing supply are relatively scarce. However, it
is worthwhile to explore the relationship between economic policy uncertainty and
real estate development investment due to the importance of real estate development
investment in promoting economic growth and stabilizing housing market. Prior
empirical studies suggest that economic policy uncertainty is an important predictor
for housing market and corporate investment.
Besides, real estate development investment requires a large capital funding but it
faces many risks and uncertainties. Due to the irreversibility of real estate
development, real options theory has strong advantages in describing behaviors in
real estate market (Titman, 1985; Quigg, 1993). According to the real options theory,
because of the irreversible nature of real estate development investment, an increase
in uncertainty will lead the developers to wait for more information by delaying
investment. In this way, an increase in EPU might delay real estate development.
Based on the existing studies, we propose the first hypothesis.
Hypothesis I: Economic policy uncertainty has a leading and negative impact on
real estate development investment.
Despite the level effect of economic policy uncertainty, there are studies focusing
on the innovations of economic policy uncertainty index. Brogaard and Andrew
(2015) employs both the level of economic policy uncertainty and the innovation of
economic policy uncertainty to investigate the asset pricing implications of
economic policy uncertainty. They find that an increase of 1 standard deviation in
level of economic policy uncertainty is associated with a 6.1% annualized abnormal
returns while innovations in economic policy uncertainty is associated with a
significant negative risk premium. Besides, Huang et al. (2018) also uses both
economic policy uncertainty and economic policy uncertainty innovation to
examine the relationship between economic policy uncertainty and housing market
at the macro level in China. And they find a negative relationship between economic
policy uncertainty and national housing climate index (NHCI) while a positive
relationship between economic policy uncertainty innovation and NHCI. Based on
these prior studies, we propose the second hypothesis.
Hypothesis II: Economic policy uncertainty innovation has a leading and positive
impact on real estate development investment.
3. Main Results
3.1
Research designs
To examine the first hypothesis that economic policy uncertainty has a negative and
leading effect on real estate development investment, we propose the following
regression:
30
Miao Li and Gaoqiang Wu
gInvt =α0 +α1 EPUt +α2 EPUt-1 +βXt + ∑12
i=2 ηi +εt
(1)
Here, gInv represents the growth rate of real estate development investment. EPUt
represents economic policy uncertainty for time t. EPUt−1 represents economic
policy uncertainty for time t-1. Xt represents the control variables that include
money supply indicator, long term loan interest rate and exchange rate, which are
consistent with Zhang et al. (2012) and Huang et al. (2018). ∑12
i=2 ηi represents the
fixed month effect in order to control monthly effect. εt is the omitted error.
To examine the second hypothesis that economic policy uncertainty innovation has
a leading and positive impact on real estate development investment, we add
innovation of economic policy uncertainty into the regression equation shown in the
following equation (2). Here △ EPUt represents innovations of economic policy
uncertainty at time t and △ EPUt−1 represents innovations of economic policy
uncertainty at time t-1.
gInvt =α0 +α1 EPUt +α2 EPUt-1 +α3 △EPUt +α4 △EPUt-1 +βXt + ∑12
i=2 ηi +εt
(2)
3.2
Variables Definition
This paper use time-series data at the macro level to examine the impact of
economic policy uncertainty on China’s new housing investment. The year-on-year
growth rate of real estate development investment is the main dependent variable in
this study. And we have compiled most of the data from the CEIC database, and all
the year-on-year growth rate data are calculated using cumulative monthly data.
Besides, D_M2, an indicator of money supply, represents the growth rate of M2.
LR is an indicator of 5-years and above loan rate and CBER represent the exchange
rate for Renminbi(RMB) from China’s central bank. The economic policy
uncertainty index we use is mainly the EPU index constructed by Baker et al. (2016)
and this index is acknowledged to be credible and has been widely used in the
literature. To check the robustness of empirical result, we also use the China EPU
index constructed by Huang & Luk (2018), which construct a new China EPU index
using 10 mainland Chinese newspapers. Table 1 shows the definitions of the
variables and data sources.
The Impact of Economic Policy Uncertainty on Real Estate Development in China
31
Table 1: Variables’ definition and Data sources
Variables
EPU
CNEPU
ginv
gsoeinv
Definition
economic policy uncertainty index
China economic policy uncertainty index
growth rate of real estate development investment
SOEs’ growth rate of real estate development
investment
gnonsoeinv non-SOEs’ growth rate of real estate development
investment
glandinv
growth rate of land purchase investment
gconinv
growth rate of Construction and installation
investment
D_M2
growth rate of M2
LR
5-years and above loan rate
CBER
exchange rate from China’s central bank
gsale
growth rate of commercial housing sale
Data sources
Baker et al. (2016)
Huang & Luk (2018)
CEIC database
CEIC database
CEIC database
CEIC database
CEIC database
CEIC database
CEIC database
CEIC database
CEIC database
3.3
Data Description
All the data are monthly data from January 2004 to December 2018. Table 2
describes the data. Panel A shows the mean, median, minimum, maximus, standard
deviation, skewness and kurtosis of all the variables. From the table 2A we can see
the average monthly year-on-year growth rate of real estate development investment
is 16.8% during the sample period, which is a fairly high level. Besides, the growth
rate of real estate development investment fluctuates from -5% to 34.8%, with
standard deviation of 9.7%. Dividing real estate development investment into stateowned and non-state-owned parts, there are no obvious differences between these
two parts. Similarly, there are little differences between land purchase investment
and Construction and installment investment. And we will conduct further empirical
analysis to discuss the heterogeneous impact of EPU on different part of real estate
development investment.
32
Miao Li and Gaoqiang Wu
Table 2A: Descriptive statistics
EPU
△EPU
ginv
gsoeinv
gnonsoeinv
glandinv
gconinv
D M2
LR
CBER
gsale
N Mean Median
180 180.9
132.5
180
4.7
5.8
180
16.8
17.8
168
18.4
14.1
168
17.3
18
180
18.5
18.3
180
16.6
18.7
180
16
16.5
180
6.1
6.1
180
6.9
6.8
180
21.3
20
min
32.6
-269.4
-5
-40.8
-5.7
-86.9
-7.9
4.9
4.9
6.1
-126.9
max
694.8
257.8
34.8
92.6
35
92.3
37.6
30.6
7.8
8.3
209
St.Dev
142.2
77.5
9.7
23.1
10.3
25.9
10.9
5.3
.9
.7
32.8
skewness kurtosis
1.7
5.7
-.1
4.4
-.1
2.1
1
5
-.2
2.2
-.5
5.8
-.4
2.3
.3
3.6
.1
2.3
.8
2.2
.8
10.2
Table 2B: Correlations between main variables
Variables
EPU
△EPU
ginv
gsoeinv
gnonsoeinv
glandinv
gconinv
D_M2
LR
CBER
lag_gsale
(1)
1.00
0.38*
-0.48*
-0.18
-0.46*
0.01
-0.59*
-0.55*
-0.50*
-0.31*
-0.22*
(2)
(3)
(4)
(5)
(6)
(7)
(8)
(9)
(10)
(11)
1.00
-0.02
0.08
-0.01
0.11
-0.09
-0.09
-0.04
-0.02
-0.05
1.00
0.52*
0.93*
0.35*
0.89*
0.49*
0.57*
0.41*
0.26*
1.00
0.18
0.26*
0.46*
0.24*
0.06
0.30*
0.11
1.00
0.40*
0.86*
0.42*
0.59*
0.35*
0.25*
1.00
-0.01
-0.09
0.02
0.10
-0.06
1.00
0.59*
0.66*
0.40*
0.25*
1.00
0.36*
0.29*
0.45*
1.00
0.09
-0.12
1.00
0.36*
1.00
Note: * shows significance at the 1% level
Panel B shows the correlation matrix of the variables. It can be seen that the EPU
and growth rate of real estate development investment are negatively correlated,
which is significant at the 1% level. And it is interesting to note that there is
significantly negative relationship between EPU and non-SOE real estate
development investment while there is negative but not significant relationship
between EPU and SOE real estate development investment. Similarly, EPU and
construction and installment investment are negatively correlated at the 1% level,
while there is no obvious relationship between EPU and land purchase investment.
These interesting evidences lay a solid foundation for the empirical analysis to
explore the heterogeneity of EPU’s influences.
Panel C presents the unit-root test for each variable. We use the ADF method to
perform unit-root test and the test results show that D_M2, LR and CBER exhibit a
unit-root. And thus, in the follow-up study we use the first-order differences which
have been proved to be stationary.
The Impact of Economic Policy Uncertainty on Real Estate Development in China
33
Table 2C: Unit-root test of main variables
Variables
ADF statistics
-2.769
critical value
(1%)
-3.484
critical value
(5%)
-2.885
critical value
(10%)
-2.575
EPU
△EPU
ginv
gsoeinv
gnonsoeinv
glandinv
gconinv
D_M2
LR
CBER
gsale
-16.67
-4.075
-7.030
-4.119
-8.928
-3.413
-1.705
-0.531
-2.377
-6.737
-3.484
-3.484
-3.488
-3.488
-3.484
-3.484
-3.484
-3.484
-3.484
-3.484
-2.885
-2.885
-2.886
-2.886
-2.885
-2.885
-2.885
-2.885
-2.885
-2.885
-2.575
-2.575
-2.576
-2.576
-2.575
-2.575
-2.575
-2.575
-2.575
-2.575
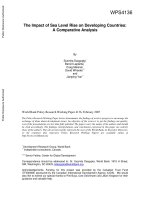
Figure 2 shows time series of EPU and the growth rate of real estate development
investment. During the sample period, we can see that EPU index rises sharply after
the global financial crisis in 2008, the European debt crisis in 2012 and the year
after 2016. During this full period, there is an overall negative relationship between
EPU and the growth rate of real estate development investment, which is consistent
with the result of correlation matrix in Table 2B. Besides, from these two timeseries data, it can be predicted that EPU might have a leading effect on real estate
development investment, especially in the year of 2008 and 2012. And this provides
preliminary evidence for hypothesis that EPU has a leading and negative effect on
China’s real estate development investment.
34
600
EPU
400
20
200
10
0
0
-10
Inv Growth
30
40
800
Miao Li and Gaoqiang Wu
2005m1
2010m1
2015m1
2020m1
date
Inv Growth
EPU
Figure 2: Time series of EPU and growth rate of real estate development
investment in China
Note: Inv Growth refers to the growth rate of real estate development investment
4. Advantages
4.1
The impact of EPU on real estate development investment
Firstly, this study conducts an empirical analysis on the effect of EPU on real estate
development investment in China according to the regression model (1). The
regression results are in Table 3 and we can see there is a negative relationship
between EPU and growth rate of real estate development investment. From the
regression (1) and (2), the coefficients are -0.026 and -0.027 for time t and t-1, which
are both significant at the 1% level, which means 1 unit increase in EPU will lead
the growth rate of real estate development investment to decline by 0.026-0.027
percent. Put EPU and EPU(-1) together in the regression (3), we can see that both
the coefficients of EPU and EPU(-1) are negative but the coefficient of EPU is
insignificant even at the 10% level. This indicates that EPU(-1) has a larger and
more significant effect on the growth rate of real estate development investment and
thus EPU is a leading indicator of real estate development investment.
The Impact of Economic Policy Uncertainty on Real Estate Development in China
35
Table 3: The impact of EPU on real estate development investment
(3)
-0.010
(-0.990)
EPU(-1)
-0.027***
-0.019**
(-7.268)
(-2.064)
D.D_M2
-1.019
-0.928
-0.966
(-1.645)
(-1.496)
(-1.563)
D.LR
19.404***
16.868***
17.658***
(3.273)
(3.200)
(3.142)
D.CBER
-32.893**
-37.461***
-34.640**
(-2.324)
(-2.824)
(-2.492)
lag_gsale
0.035*
0.040**
0.037*
(1.677)
(1.979)
(1.735)
_cons
20.807***
20.500***
21.021***
(6.738)
(6.760)
(6.750)
Obs.
179
179
179
R-squared
0.385
0.398
0.403
Month dummies
yes
yes
yes
Note. Significant level of 10%, 5%, 1% are marked by *, **, and ***, respectively.
Numbers in italics are p-values.
EPU
(1)
-0.026***
(-6.279)
(2)
Besides, this paper is also interested in the influence of an EPU variation on China’s
real estate development. Then we conduct empirical analysis based on the
regression equation (2). The empirical results are listed in Table 4. Regression (1)
employs the current period EPU and EPU variation; Regression (2) instead employs
the lagged EPU and EPU variation; Regression (3) puts all the current and lagged
EPU and EPU variation together. In all the regression results, the coefficients of
△EPU (EPU innovation) and lagged △EPU are positive at the 5% level. The
empirical results reveal that higher expected returns may motivate developers to
continue investing facing greater variation of policy uncertainty, which is consistent
with Wang et al. (2014). Besides, the coefficients of EPU and EPU(-1) are negative
at the 1% level which is the same as Table 3. What’s more, it can be concluded that
both EPU and its innovation have a leading effect on the growth rate of real estate
development investment.
36
Miao Li and Gaoqiang Wu
Table 4: The impact of innovations of EPU on real estate development investment
(1)
-0.030***
(-7.510)
(2)
(3)
EPU
-0.052***
(-2.897)
EPU(-1)
-0.031***
0.018
(-7.573)
(1.125)
0.021**
0.044***
△EPU
(2.345)
(3.332)
0.020**
0.019**
△EPU(-1)
(2.289)
(1.986)
D.D_M2
-0.973
-0.814
-0.866
(-1.576)
(-1.301)
(-1.375)
D.LR
17.521***
17.029***
17.493***
(3.153)
(2.941)
(2.904)
D.CBER
-33.539**
-37.698***
-33.288**
(-2.459)
(-3.030)
(-2.553)
lag_gsale
0.036*
0.038*
0.035
(1.720)
(1.885)
(1.651)
_cons
21.249***
20.941***
21.704***
(6.873)
(6.626)
(6.699)
Obs.
179
179
179
R-squared
0.407
0.417
0.425
Month dummies
yes
yes
yes
Note. Significant level of 10%, 5%, 1% are marked by *, **, and ***, respectively.
Numbers in italics are p-values.
4.2
Robustness test
4.2.1 Using provincial real estate development investment
The first robustness check is using the real estate development investment data from
31 provincial regions in place of national level data. The sample period is from 2004
to 2018 and the total number of observations is 5549. The result of panel data
analysis is listed in Table 5. We can see that both the coefficients of EPU and EPU
(-1) are significantly negative at the 1% level. And the coefficient of △EPU and
△EPU(-1) are significantly positive at the 1% level. This further validates the
conclusion that both EPU and EPU innovation have a significant leading effect on
the real estate development investment.
The Impact of Economic Policy Uncertainty on Real Estate Development in China
37
Table 5: Using provincial growth rate of real estate development investment
EPU
EPU(-1)
△EPU
(1)
-0.024***
(-32.377)
(2)
-0.028***
(-35.581)
(3)
-0.007***
(-4.841)
-0.022***
(-14.390)
(4)
-0.028***
(-35.970)
(5)
-0.031***
(-38.484)
0.022***
(14.390)
△EPU(-1)
0.020***
(13.246)
D.D_M2
-1.016***
-0.945***
-0.967***
-0.967***
-0.829***
(-9.791)
(-9.259)
(-9.486)
(-9.486)
(-8.227)
D.LR
19.881*** 17.342*** 17.898*** 17.898*** 17.524***
(23.170)
(20.461)
(20.968)
(20.968)
(20.998)
D.CBER
-34.907*** -37.338*** -35.713*** -35.713*** -37.559***
(-16.382)
(-18.039)
(-17.065)
(-17.065)
(-18.430)
lag_gsale
0.029***
0.032***
0.030***
0.030***
0.030***
(8.690)
(9.801)
(9.165)
(9.165)
(9.277)
_cons
20.544*** 20.689*** 20.987*** 20.987*** 21.135***
(49.898)
(51.529)
(51.769)
(51.769)
(53.276)
Obs.
5549
5549
5549
5549
5549
R-squared
0.376
0.396
0.398
0.398
0.414
Month dummies
yes
yes
yes
yes
yes
Note. Significant level of 10%, 5%, 1% are marked by *, **, and ***, respectively.
Numbers in italics are p-values.
4.2.2 Using Huang & Luk(2018)China EPU index
Secondly, we also use the China EPU index constructed by Huang & Luk (2018)
To check the robustness of empirical result. The China EPU index is constructed a
new China EPU index using 10 mainland Chinese newspapers3. The compilation
strategy of the China EPU index follows that of Baker et al. (2016) and they also
count the number of occurrences of articles discussing economic policy uncertainty.
Table 6 presents the result of using Huang & Luk China EPU index in place of
Baker et al. (2016) EPU index. From the table, we can see that both the coefficients
of EPU and EPU(-1) are significantly negative at the 1% level. And the coefficient
of △EPU and △EPU(-1) are significantly positive at the 1% level. This further
validates the above conclusion.
3
The ten newspapers are: Beijing Youth Daily, Guangzhou Daily, Jiefang Daily, People's Daily
Overseas Edition, Shanghai Morning Post, Southern Metropolis Daily, The Beijing News, Today
Evening Post, Wen Hui Daily and Yangcheng Evening News.
38
Miao Li and Gaoqiang Wu
Table 6: Using Huang & Luk(2018)China EPU index
CNEPU
CNEPU(-1)
∆CNEPU
(1)
-0.022***
(-6.907)
(2)
-0.038***
(-11.629)
(3)
0.020***
(3.859)
-0.053***
(-10.005)
(4)
-0.034***
(-10.034)
(5)
-0.043***
(-12.797)
0.053***
(10.005)
∆CNEPU(-1)
0.024***
(4.430)
D.D_M2
-0.958***
-1.011***
-1.012***
-1.012***
-0.989***
(-8.814)
(-9.262)
(-9.223)
(-9.223)
(-9.018)
D.LR
18.947*** 17.242*** 17.030*** 17.030*** 16.956***
(17.726)
(15.711)
(15.357)
(15.357)
(15.582)
D.CBER
-50.828*** -50.802*** -51.873*** -51.873*** -50.773***
(-22.821)
(-22.968)
(-23.200)
(-23.200)
(-23.411)
lag_gsale
0.044***
0.039***
0.040***
0.040***
0.037***
(14.294)
(13.559)
(13.570)
(13.570)
(12.534)
_cons
18.231*** 20.124*** 19.421*** 19.421*** 20.638***
(29.348)
(32.879)
(31.397)
(31.397)
(34.580)
Obs.
6086
6086
6086
6086
6086
R-squared
0.262
0.273
0.274
0.274
0.275
Month dummies
yes
yes
yes
yes
yes
Note. Significant level of 10%, 5%, 1% are marked by *, **, and ***, respectively.
Numbers in italics are p-values.
4.3
Impact of EPU on different parts of real estate development investment
4.3.1 Decompose real estate development investment into land purchase
investment and construction and installment investment
Land purchase investment and construction and installment investment are two
most important parts of real estate development investment. For example, in 2018
construction and install investment accounts for more than 60% of real estate
development investment while land purchase investment accounts for nearly 30%.
Land purchase investment is mainly influenced by land supply and land purchase
intention, while construction and installation investment mainly reflects actual
construction progress. In the housing construction cycle, construction and
installation investment has a more direct effect on new housing supply in the short
term. Therefore, discussing the heterogeneous impact of EPU on land purchase
investment and construction and installment investment can further predict new
housing supply.
Table 7 shows the empirical results. Regression (1) and (2) examines the impact of
EPU on growth rate of land purchase investment. Regression (3) and (4) examines
the impact of EPU on growth rate of construction and installment investment. As
can be seen from Table 7, the coefficients of lagged EPU in equation (1) and (2) are
The Impact of Economic Policy Uncertainty on Real Estate Development in China
39
insignificant from 0, while the coefficients of lagged EPU in equation (3) and (4)
are significantly negative at the 1% level. This indicates that EPU has leading and
negative effect on construction and installment investment while no significant
effect on land purchase investment. As for ∆EPU(-1), its coefficient in equation (2)
is positive but not significant while in equation (4) is significantly positive at the
10% level. This suggests that lagged EPU variation will increase the growth rate of
construction and installment investment. Taken all those together, it can be
concluded that EPU and EPU variation have significant effects on short-run new
housing supply through construction and installment investment, which might lead
to an increase in housing prices in the short run.
Table 7: Decomposing real estate development investment I
(1)
glandinv
0.002
(0.134)
(2)
(3)
(4)
glandinv
gconinv
gconinv
EPU(-1)
0.000
-0.039***
-0.042***
(0.018)
(-7.814)
(-9.609)
0.009
0.020*
∆EPU(-1)
(0.232)
(1.841)
D.D_M2
-2.932
-2.879
-0.318
-0.201
(-0.762)
(-0.734)
(-0.492)
(-0.329)
D.LR
29.862***
29.947***
12.582**
12.766*
(3.302)
(3.323)
(2.346)
(1.921)
D.CBER
12.958
12.855
-46.728***
-46.951***
(0.299)
(0.294)
(-3.568)
(-3.325)
lag_gsale
-0.113**
-0.114**
0.038*
0.036**
(-2.206)
(-2.290)
(1.858)
(2.254)
_cons
12.435
12.643
24.224***
24.676***
(0.455)
(0.470)
(9.535)
(7.846)
Obs.
179
179
179
179
R-squared
0.034
0.034
0.442
0.457
Month dummies
yes
yes
yes
yes
Note. Significant level of 10%, 5%, 1% are marked by *, **, and ***, respectively.
Numbers in italics are p-values.
4.3.2 Decompose real estate development investment into SOEs and nonSOEs
SOEs and non-SOEs might react differently to changes in economic policy. The
natural relations between SOEs and the government tends to make SOEs’ behavior
more pro-policy, namely, SOEs are more willing to invest in accordance with
government policies. Besides, SOEs in China rely more heavily on bank lending
and thus are more affected by economic policy uncertainty. What’s more interesting,
in China’s real estate market there are only 5 SOEs in the top 30 real estate
developers, which means housing supply market is in fierce competition.
Decomposing real estate development investment into SOEs and non-SOEs can
40
Miao Li and Gaoqiang Wu
help to further investigate the heterogeneous effect of EPU.
Table 8 shows the empirical results. Regression (1) and (2) shows the effect of EPU
on growth rate of SOEs’ real estate development investment; regression (3) and (4)
shows the effect of EPU on growth rate of non-SOEs’ real estate development
investment. For SOEs, the coefficient of lagged EPU ranges from -0.040 to -0.043,
which is significant at the 1% level. For non-SOEs, the coefficient of lagged EPU
ranges from -0.031 to -0.035, which is also significant at the 1% level. As for EPU
variation, the coefficient for SOEs is positive but not insignificant while for nonSOEs is significantly positive at the 1% level. Comparing the coefficients of lagged
EPU and EPU innovation, we can see that real estate development investment by
non-SOEs is less affected by economic policy uncertainty.
Table 8: Decomposing real estate development investment II
(1)
gsoeinv
-0.040**
(-2.578)
(2)
gsoeinv
EPU(-1)
-0.043***
(-3.447)
0.014
∆EPU(-1)
(0.791)
D.D_M2
-1.132
-1.054
(-0.659)
(-0.707)
D.LR
29.298**
29.478**
(2.033)
(2.155)
D.CBER
16.731
16.807
(0.395)
(0.695)
lag_gsale
-0.005
-0.007
(-0.096)
(-0.130)
_cons
23.035***
23.365***
(3.297)
(5.756)
Obs.
167
167
R-squared
0.089
0.091
Month dummies
yes
yes
Note. Significant level of 10%, 5%, 1% are marked by
Numbers in italics are p-values.
(3)
gnonsoeinv
-0.031***
(-5.435)
(4)
gnonsoeinv
-0.035***
(-6.215)
0.021**
(2.167)
-0.836
-0.719
(-1.325)
(-1.190)
12.884**
13.153**
(2.432)
(2.147)
-70.033***
-69.918***
(-4.503)
(-4.925)
0.045**
0.042***
(2.239)
(2.801)
22.046***
22.538***
(8.588)
(6.452)
167
167
0.406
0.426
yes
yes
*, **, and ***, respectively.
5. Conclusion
The previous literature has studies the relationship between EPU and corporate
investment or housing market returns. Clearly, it is also important to examine the
effect of EPU on real estate development investment which is “the engine of
economic growth” in China. Hence, this paper focuses on the impact of EPU and
EPU innovations on the real estate development investment. In addition, this paper
also examines the heterogeneous effect of EPU on SOEs’ and non-SOEs’ real estate
development investment and the heterogeneous effect of EPU on land purchase
The Impact of Economic Policy Uncertainty on Real Estate Development in China
41
investment and construction and installment investment.
To conclude, there are several noteworthy findings. First, we find that EPU is an
important indicator for China’s real estate development investment. EPU has a
leading and depressing effect on real estate development investment and 1 unit
increase in EPU index leads to the growth rate of real estate development investment
decreasing by about 0.026 percent. Second, there is a positive relationship between
EPU innovations and the growth rate of real estate development investment.
Moreover, the restraining effect of EPU is more pronounced in the state-owned
enterprises’ investment which means investments by non-state-owned developers
are less affected by economic policy uncertainty. Finally, the part of construction
and installation investment is more sensitive to economic policy uncertainty and
this indicates that new housing supply in the short run might be affected to a greater
extent.
Based on the above empirical evidences, we can see the economic policy
uncertainty caused by frequent changes of economic policies might inhibit real
estate development investment. The delay of real estate development investment
will decrease new house supply in the short run, and this will cause an upward
pressure on housing prices and this is not conducive to the steady development of
real estate market. In the past decades, the direction of real estate regulation changed
between looseness and tightness several times, which may offset the regulation
effect of the policy to some extent. Therefore, we suggest that government should
pay attention to the negative impact of economic policy uncertainty and maintain
transparency, consistency and stability of economic policies.
References
[1] Davis, Morris A., and Stijn Van Nieuwerburgh, Housing, finance, and the
macroeconomy, Handbook of regional and urban economics, Vol. 5, (2015),
753-811.
[2] Zhang, Jie, Jianhua Wang and Aiyong Zhu, The relationship between real
estate investment and economic growth in China: a threshold effect, The
Annals of regional science, 48.1, (2012), 123-134.
[3] Wu, Jing, Joseph Gyourko, and Yongheng Deng, Evaluating the risk of
Chinese housing markets: What we know and what we need to know, China
Economic Review, 39, (2016), 91-114.
[4] Baker, Scott R., Nicholas Bloom, and Steven J. Davis, Measuring economic
policy uncertainty, The quarterly journal of economics, 131.4, (2016), 15931636.
[5] Huang, Wei-Ling, Wen-Yuan Lin, and Shao-Lin Ning, The effect of economic
policy uncertainty on China’s housing market, The North American Journal of
Economics and Finance, (2018),100850.
[6] Su, David , et al., Economic policy uncertainty and housing returns in Germany:
Evidence from a bootstrap rolling window, Zbornik radova Ekonomskog
42
[7]
[8]
[9]
[10]
[11]
[12]
[13]
[14]
[15]
[16]
Miao Li and Gaoqiang Wu
fakulteta u Rijeci/Proceedings of Rijeka Faculty of Economics, 34(1), (2016),
43-61.
Anoruo, Emmanuel, Uchenna Akpom, and Young Nwoye, Dynamic
Relationship between Economic Policy Uncertainty and Housing Market
Returns in Japan, Journal of International Business and Economics, 5(2),
(2017), 28-37.
André, Christophe, et al., Economic policy uncertainty, US real housing
returns and their volatility: A nonparametric approach, Journal of Real Estate
Research, 39(4), (2017), 493-513.
Christou, Christina, Rangan Gupta, and Christis Hassapis,Does economic
policy uncertainty forecast real housing returns in a panel of OECD countries?
A Bayesian approach,The Quarterly Review of Economics and Finance, 65,
(2017), 50-60.
El-Montasser, Ghassen, et al., Cross-country evidence on the causal
relationship between policy uncertainty and housing prices, Journal of
Housing Research, 25(2), (2016), 195-211.
Aye, Goodness C, Causality between economic policy uncertainty and real
housing returns in emerging economies: A cross-sample validation
approach, Cogent Economics & Finance, 6(1), (2018), 1473708.
Gulen, Huseyin, and Mihai Ion, Policy uncertainty and corporate
investment, The Review of Financial Studies, 29(3), (2016), 523-564.
Wang, Yizhong, Carl R. Chen, and Ying Sophie Huang, Economic policy
uncertainty and corporate investment: Evidence from China, Pacific-Basin
Finance Journal, 26, (2014), 227-243.
Titman, S, Urban land prices under uncertainty, The American Economic
Review, 75(3), (1985), 505–514.
Quigg, L, Empirical testing of real option-pricing models, Journal of Finance,
48(2), (1993), 621–640.
Brogaard, Jonathan, and Andrew Detzel, The asset-pricing implications of
government economic policy uncertainty, Management Science, 61(1), (2015),
3-18.