SỬ DỤNG cây KHOAI mì (sắn) để PHÁT TRIỂN CHĂN NUÔI dê ở AN GIANG, VIỆT NAM tt tiếng anh
Bạn đang xem bản rút gọn của tài liệu. Xem và tải ngay bản đầy đủ của tài liệu tại đây (177.04 KB, 25 trang )
HUE UNIVERSITY
UNIVERSITY OF AGRICULTURE AND FORESTRY
LE THI THUY HANG
UTILIZATION OF CASSAVA FORAGES FOR GOAT
PRODUCTION IN AN GIANG PROVINCE, VIETNAM
Specialization: Animal Sciences
Code: 9620105
SUMMARY OF DISERTATION IN ANIMAL SCIENCES
HUE-2019
This dissertation is completed at: University of Agriculture and Forestry, Hue
University
Supervised by:
1. Assoc. Prof. Dr. Nguyen Xuan Ba
2. Dr. Dinh Van Dung
1streviewer: …………………………………..…………………………………..
2nd reviewer: ………………………………..…………………………………….
3rd reviewer: ………………………………..…………………………………….
The dissertation will be defended at the Council of dissertation assessment of Hue
University, 04 Le Loi Street, Hue city, at………….on……/……../2019
Dissertation can be further referred at:
1. National Library
2. Center for Information and Library of Hue University of Agriculture and
Forestry, Hue University
List of abbreviations, symbols and equivalents
ADF
ATP
BW
BSP
CP
CT
CNP
CH4
CO2
DM
EPG
FW
GHG
EPS
HT
HCN
LW
N
NDF
SCFA
TMR
VFA
WRC
Acid detergent fiber
Adenosine triphosphate
Body weight
Brewery spent grain
Crude protein
Condensed tannins
Cyanogenic potential
Methane
Carbon dioxide
Dry matter
Eggs per gram
Fresh weight
Green house gas
Self-produced polymeric substance
Hydrolysable tannins
Hydrogen cyanide
Live weight
Nitrogen
Neutral ditergent fiber
Short -chain fatty acid
Total mix ration
Volatile fatty acid
Water retention capacity
INTRODUCTION
1. PROBLEM STATEMENT
An Giang province in the South of Vietnam, is a watershed province in the
Mekong Delta, and one of the largest cultivated areas in the Mekong Delta. The
total area of agricultural land is more than 282,676 ha, of which paddy land
accounts for 85.2% (Statistic yearbook of An Giang, 2018). An Giang is one of the
two provinces in the Mekong Delta with hills and mountains, mostly in the
northwest of the province, in Tinh Bien and Tri Ton districts. This is the last
mountain cluster of the Annamites, so the geological features also have similarities
with the Southern Truong Son. An Giang has a tropical monsoon climate, with two
distinct seasons: rainy season and dry season. The temperature ranges from 200C
to 360C and rainfall from 1400 to 1600 mm. The rainy season is the least in
February and the highest in September. The average humidity is 75-80% (An
Giang hydrometeorological Station, 2017). Due to the topography, the land
resources are divided into different types: alluvial soil, alkaline soil, mountainous
land. Total area of hilly land in An Giang is about 29,320 ha, accounting for 8.6%
of total land area of the province. Agricultural cultivation in this mountainous area
is not favorable because of its low productivity, lack of water for irrigation in the
dry season, but when the rainy season comes, some districts are affected by floods
eg: the flooding in 2018 affected hundreds of hectares of rice and crops in the
Mekong Delta. As Naqvi and Sejian (2011) showed droughts, flooding and
depletion of natural resources, were caused by global climate change.
Based on the above problems and threats, we hypothesize that utilization of
cassava forage for improving goat production and reducing enteric methane
emission from goat production in An Giang province, Vietnam. This study was
designed to test the hypothesis by addressing the following specific aims were to
improve nutritive value of cassava stems and stored by urea treatment. In addition,
using brewers’ grain and biochar supplied to improve growth rate and reduce
methane emissions in a basal diet of cassava forage fed to growing goats.
2. THE OBJECTIVES
The overall aim of this thesis was to improve utilization of cassava forage
for increasing performance and reducing enteric methane emission from goat
production in An Giang province, Vietnam. The present study objectives were:
- To evaluate the potential productivity and nutritive value of cassava stems,
and cassava forage for goats in An Giang Province.
- To determine level of urea addition to cassava stems for storage to improve
nutritive value, especially its digestibility
1
- To examine the effect of biochar supplementation on feed intake,
digestibility, N retention in goats fed urea treated cassava stems
- To determine levels of brewery grain that affect feed intake, digestibility
and growth in goats fed sweet cassava foliage as basal diet.
- To determine levels of biochar that would reduce methane production in
goats fed a basal diet of fresh cassava foliage and brewery grain.
3. SIGNIFICANCE/INNOVATION OF THE DISSERTATION
The thesis contributes to the science of:
- Using urea to treat cassava stems is one of method to increase nutritive
value, reduce HCN content and can be storeed at least 8 weeks.
- Adding 4% brewery grain and 0.86% biochar (DM based) in Bach Thao
goat’s diet, that is basal of fresh cassava foliage has improved growth and reduced
enteric methane emission from goat production.
- The results of the study are of scientific value for managers, researchers,
universities, graduate students and agricultural students’ references.
- The present results of show that adding urea to cassava stems can
provide storage to use as feed goat for year around, specially in flooding or
rainy season.
- The study results of the dissertation serve as a scientific basis for
businesses and husbandry to use and coordinate goat diets towards reducing
methane emissions.
- Introducing cassava forage as goats feed, reducing the HCN content,
improving growth and reducing methane emission with supplementing
additive as brewery grain and biochar.
CHAPTER 1: LITERATURE REVIEW
In this chapter, there are main points following (i) Goat and cassava
production in An Giang province; (ii) the use of available feed resources for goat
production; (iii) introduction to some main local feed resources such as cassava
and their by-products and brewers’ grains and (iv) feed and feeding strategies for
methane mitigation from goat production. The literature review shows a potential
to use local feed resources for goat production for the two purposes of increasing
animal performance and reducing methane emission.
2
CHAPTER 2: EVALUATION OF THE POTENTIAL OF CASSAVA
FORAGE AS FEED FOR GOATS IN AN GIANG PROVINCE,
VIETNAM
INTRODUCTION
An Giang is one of the two provinces in the Mekong Delta with hills and
mountains, mostly in the northwest of the province, in Tinh Bien and Tri Ton
districts. An Giang is in the tropical monsoon climate, with two distinct seasons:
rainy season and dry season. The rainy season is the least in February and the rainy
season is the highest in September. The average humidity is 75-80%. The basic
climate is favorable for agricultural development. Due to the topography, the land
resources are divided into different types: alluvial soil, alkaline soil, mountainous
land. Hilly land is mainly distributed in two districts of Tri Ton and Tinh Bien, a
small part of Thoai Son district (Ba The area). The total area of hilly land in An
Giang is about 29,320 ha, accounting for 8.6% of the total land area of the
province. So, the area of grazing land is limited, the grassland is also limited. The
cassava was planted in there, it is not so much (representing 0.5% of agricultural
land). The production of cassava roots in this area was 28.7 tons/year. It is
estimated that an amount of cassava foliage is produced 61 thousand tonnes. The
reason is difficulties in drying the straw or other roughage in the rainy season, but
by- production is an underutilized resource for feeding livestock. The purpose of
planting cassava in this area is to harvest roots, cassava foliage is underutilized,
being left to rot in the monsoon season (flooding season) and burned in the dry
season. Even with a small number of cattle in the province by 98,758 heads in
2017 (Statistic yearbook of An Giang, 2018) a sufficient supply of roughage is not
easy to find during the rainy season, and cassava foliage is an underutilized
resource for feeding livestock, especially in the hilly land area. These areas are
suitable for goats raising. The design of this thesis responds to tendencies that have
been observed in the development of crop and livestock systems in Tinh Bien and
Tri Ton districts in An Giang province. The survey described in showed that there
is an increasing tendency to plant cassava both as a food crop and as a source of
starch for industrial processing. At the same time, there are major trends in
ruminant livestock numbers, with the population of goats increasing.
3
MATERIALS AND METHODS
The following indicators were used in the investigation of the survey
From secondary data:
- Planting area and cassava productivity in each district in the An Giang
province
- Number of goats raised in each district in the An Giang province
The following indicators were used to select 120 households (60 households have
grown cassava; 60 households have raised goats).
Data collection and calculation
In each district, we chose five households (from 60 selected households)
with cassava cultivators at eight months after growing and an area of 1000 m2/plot
to collection and calculation of fresh cassava forage productivity. Five positions
were selected in each plot of land by diagonal method. Land area of each position
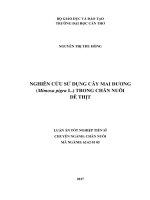
was 4m2 (Total area was 4 * 5 = 20m2). In each position, all cassava plant was cut
and weighed (except root). Cassava plants were the whole plant above the soil.
Cassava plant was divided into two parts: Cassava forage – which were two thirds
of the above ground part of cassava plant; weighed the cassava forage (1); and hard
stems (blue line on the right in figure 2.1) - which was one third above soil level,
weighted them (2).
In this case, cassava forage was divided into two parts: (3) Tenderstems + (4)
leaves (including peiole).
Tenderstems were called cassava stems (3)
Weight of cassva plant = (1) + (2)
Weight of cassva forage (1) = (3) + (4)
Chemical analysis
All samples of cassava forage and stems were analyzed for DM, CP and ash using
procedures described by AOAC (1990). ADF and NDF were analyzed according to
Van Soest and Robertson (1991). HCN and total tannin were analyzed according to
ISO 6703-1:1984 (TCVN 6181:1996), AOAC 955.35. by AOAC (2016).
Statistical analysis
Data was collected, preliminary calculations performed and stored in the Microsoft
Office spreadsheet EXCEL 2010. Data were analysed using General Linear Model
4
(GML); the basic model for analysis of variance (ANOVA); the constants
described as averages, the standard deviation was performed on the MINITAB
statistical software 16.
RESULTS AND DISCUSSION
Cassava production
Chemical composition of cassava
Table 2.1. Chemical composition of cassava parts
% DM
Variety of cassava
Bitter cassava
Sweet cassava
Bitter cassava
Cassava stems
Sweet cassava
Notes: FW: fresh weight
Cassava forage
DM, %
26.8
21.7
31.5
24.5
CP
NDF
13.4
13.8
4.9
6.1
49.4
47.0
66.1
65.8
Total
tannin
4.6
3.1
1.6
1.3
HCN
(mg/kg FW)
153
34.5
68.0
30.5
DM: Dry matter, CP: crude proetin, NDF: neutral detergent fiber, HCN: Hydrogen cyanide
Table 2.2. Yield of cassava proportion with different variety
Sweet cassava
Proportion
Bitter cassava
Proportion
Fresh cassava plant
Hard stems
Cassava forage
Cassava stems
Leaves + petiole
DM cassava plant
Hard stems
Cassava forage
Cassava stems
Leaves + petiole
CP of cassava forage
in DM (tons/ha)
(tons/ha)
%
(tons/ha)
%
13.2 ± 3.6
26.2 ± 7.2
8.7 ± 2.4
17.5 ± 4.8
33.5
66.5
22.1
44.4
17.2 ± 4.5
14.7 ± 3.8
4.9 ± 1.3
9.8 ± 2.5
54.0
46.1
15.3
30.7
5.5 ± 1.5
5.7 ± 1.6
2.1 ± 0.5
3.6 ± 1.0
49.1
50.9
18.4
32.5
6.4 ± 1.6
3.9 ±1.0
1.2 ± 0.3
2.7 ± 0.76
62.1
37.9
11.3
26.6
0.79 ± 0.23
-
0.52 ± 0.15
-
The fresh and dry weight proportion of cassava plant is shown in Table 2.
The cassava forage was differences between two varieties of cassava. The
proportion of sweet cassava forage was higher than the bitter cassava. These results
were different due to the differences in variety, farming conditions, regions, soil,
and fertilization and cutting time.
Goat production
Table 2.3. Farm size and purpose raising
Tri Ton
Tinh Bien
5
Total percentag
e%
Items
Farm size
(Household)
1-<10 heads/farm
10-20 heads/farm
> 20 head/farm
Purpose raising
(Heads)
Meat
Breeding
Total
Numbe percentag Numbe percentag
r
e%
r
e%
14
27
19
23.3
45
31.7
5
15
40
8.3
25
66.7
691
62.9
1,163
95.1
408
1,099
37.1
60
1,223
4.9
19
42
59
15.8
35.0
49.2
1,85
4
468
79.8
20.2
The purpose of raising goats here was mainly to sell meat at 79.8%, in
addition to raising goats with the purpose of selecting good ones in the herd to sell
goats for local market or neighbourhood; but account for a smaller percentage
(20.6%). In addition, markets for goat production (eg: milk, cheese, ...) are in the
cities providing farmers with better income and opportunities for further
development.
Table 2.4. Goat production systems in Tri Ton and Tinh Bien district
Number of farms in district
Percentage Tinh Percentage Total
Management Tri Ton
,%
Bien
,%
Intensive
31
51.7
35
58.3
66
Semi27
45.0
25
41.7
intensive
52
Extensive
2
3.33
0
0.00
2
Percentage
,%
55.0
43.3
1.67
Intensive systems are the main method of goat raising in An Giang, this
systems of complete confinement helps the farmers manage each individual, can
detect disease or manage oestrus in a timely manner, but feed had to controled
actively, while semi- intensive systems help goats have time to graze, develop the
right features and reduce the reserve of feed.
Table 2.5. Feed and feeding systems for goats in Tri Ton and Tinh Bien district
Tri Ton
Tinh Bien
percentage,
percentage,
Items
Household
Household
%
%
Feed
Natural grass
60
100
60
100
Natural grass + Leaves (except CL)
9
15
4
6.67
Natural grass + by-products
28
46.7
36
60
Natural grass + cassava forage
4
6.67
2
3.33
Natural grass + Grass growing
13
21.7
13
21.7
6
Natural grass + Commercial
concentrate
Supplements
Salt
Rice bran
Commercial Concentrate
No supplement
Note: CL: cassava leaves
6
10
5
8.33
15
9
5
31
25.0
15.0
8.3
51.7
23
11
5
21
38.3
18.3
8.33
35.0
CONCLUSIONS
In An Giang province, goat production is developing with promising
conditions of abundant feed resources, good government policies. However, some
constraints for production development such as low breed quality, lack of large
farms and improving nutrient of feed for year-round. Besides that, cassava forage
has potential in An Giang. The average dry matter cassava forages were 5 tons/ha
in 2017. They can be used as a protein source, as a replacement for grass for
ruminants but farmers did not use it because it is high HCN content. How to use
and preserve cassava (including the stems) as feed ruminants and against toxicosis
by reducing HCN content.
CHAPTER 3: USING UREA TO TREAT CASSAVA STEMS AND
EFFECT OF WATER SPINACH AND BIOCHAR ON FEED
INTAKE, DIGESTIBILITY AND N-RETENTION IN GOATS FED
UREA TREATED CASSAVA STEMS
INTRODUCTION
Cassava (Manihot esculenta Crantz) is a perennial woody shrub of the
family Euphorbiaceae. The forage can be used as a supplement for animals in
either fresh or wilted form or as hay (Phengvichith and Ledin, 2007; Wanapat et
al., 1997). At root harvest, 9 to 10 months after planting, the forage production can
be about 5 tonnes dry matter/ha (Mui, 1994). It is estimated that more than 2.5
milion tonnes of cassava forage are produced in Vietnam, of which about 15,000
tonnes are in An Giang, Cassava forage is usually thrown away after harvesting the
root, because of its content of cyanogenic glucoside, mainly linamarin and
lotaustralin (Alan and John, 1993).
Since the use of urea (CO(NH2)2 for straw treatment has been widely
studied and proved to be effective in the Tropics (Schiere and Ibrahim, 1989;
Chenost and Kayouli, 1997; Trach et al., 2001; ThuyHang el at., 2005), 3 or 4%
urea – treated straw viewed as a positive control together with untreated straw
7
being the negative control in the present studies to evaluate other treatments.
According to Thanh et al. (2013), cassava stems contain 33% DM but only 5.5%
crude protein (CP) in the DM. It was therefore hypothesized that there could be a
double benefit from ensiling the cassava stems with urea: (i) to provide the
ammonia needed by rumen organisms; and (ii) to improve the digestibility of the
stems DM as has been widely proven in the urea-ensiling of low-protein, fibrous
feeds such as rice straw (Trach et al., 1998). Major advances have been made
recently in the integrated use of the cassava plant as a means of intensifying for
ruminant livestock production. With this background, the specific objectives were
to determine the level of urea treated cassava stems that would facilitate the storage
and at the same time improve its digestibility. Then, determining the synergistic
effect of biochar and water spinach on growth of goat fed urea treated cassava
stems, shown to be a potential feed resource for goat by Thanh et al. (2013).
MATERIALS AND METHODS
EXPERIMENT 1
The treatments had five levels of urea (0, 1, 2, 3 and 4%, DM basis) added to
freshly chopped cassava stems; and five storage times (0, 2, 4, 6 and 8 weeks).
Each treatment combination was replicated 4 times. Two tonnes of cassava stems
were collected from farmers’ fields directly after root harvesting; and chopped by
hand. Representative amounts were analyzed for DM by infrared radiation
(Undersander et al., 1993) prior to hand mixing 20 kg quantities with the indicated
amounts of crystalline urea followed by storage in polyethylene bags which were
then sealed. After preservation for 0; 2; 4; 6 and 8weeks samples of cassava stems
treated with urea were taken for evaluation of physical appearance characteristics,
measurement of pH, chemical composition and in a comparative study on DM
degradation with untreated cassava stems.
EXPERIMENT 2
Experimental design
Four “Bach Thao” goats (14 ± 2 kg) were fed urea-treated cassava stems
alone (UCS) or with a supplement of water spinach at 1% of LW (DM basis)
(UCSW), with biochar at 1% of DM intake (UCSB) or with 1% water spinach +
1% biochar (UCSWB). The design was a Latin square with four treatments and
four periods, each lasting 15 days (ten days for adaptation and 5 days for collection
of faeces and urine). Between each period there was a period of 7 days for resting
during which time they were fed the diet destined for the subsequent period of the
experiment
8
Animals and management
The goats were housed in metabolism cages made from bamboo, designed to
collect separately faeces and urine. They were weighed between 06:30 and 07:30h
before feeding at the start and end of each experimental period.
Feeding and management
The biochar was made by burning rice husks in a top-lit, updraft (TLUD)
gasifier stove (Olivier 2010). The chosen amounts were offered twice daily in
troughs separate from the cassava stems and water spinach.
Water spinach was chopped by hand prior to being put into the feed troughs. The
chosen amounts were offered twice daily in troughs separate from the cassava
stems.
The cassava stems (no leaves) were harvested at 40-50cm above soil level at
intervals of 150 days when it had attained a height of 100 - 120 cm. The cassava
stems were chopped by machine, mixed with urea (3% DM basis; no water was
added) and ensiled in plastic bags after first extracting the air. They were ensiled
for 21 days, after which they were fed ad libitum as the basal diet of the goats.
Digestibility and N retention
During the data collection periods, the feces and urine were recorded twice
daily at 7:00 and 16:00 and added to jars containing 100 ml of 10% sulphuric acid.
The pH was measured and, if necessary, more acid added to keep the pH below
4.0. After each collection period: (i) a sample of 10% of the urine was stored at -4o
C for analysis of nitrogen (AOAC 1990); (ii) the feces were mixed and a sample
(10%) stored frozen at -20oC..
Chemical analyses
The samples of CS, UCS, WS, and BG were analyzed for DM, ash, CP, NDF
and ADF in feed offered and refused according to standard methods (AOAC,
1990). The feces were analyzed for DM and ash the urine and feces were analyzed
for N according to AOAC, (1990) methods. HCN content was determined
according to the standard methods of AOAC (2016). Total tannin content was
determined according to the method (955.35) of AOAC (2016). Metabolizable
energy of the diet (MJ/kg) were calculated from organic matter digestibility (OMD:
%) by formula of Mc Donald et al. (2002). The formula is: ME = 0.160*OMD.
The rumen fluid was analyzed for the pH and NH3.
Statistical analyses
Data were analyzed with the General Linear Model option of the ANOVA
program in the MINITAB software (Minitab 2016). Sources of variation were
9
levels of urea, storage time, random error for experiment 1. Sources of variation
were treatments, animals, periods and error for experiment 2.
RESULTS AND DISCUSSION
EXPERIMENT 1
Hygienic quality of cassava stems treated by physical evaluation
The evaluation of the physical appearance of the treated cassava stems with respect
to color, smell, and mold, the quality of treated cassava stems in the bags or bales
were considered to be good, except in the treatments 1(no urea). Cassava stems in
these treatments had no, or only a slight ammonia smell, and some fungi developed
on the surface of the bags.
Chemical compositions of cassava stems treated with difference levels of urea
and stored times
The magnitude of the CP increase of treated cassava stems varies according
to many factors such as material, environment and procedure of the treatment
process. Furthermore, the CP increases are related to the urea level in the
treatment, the water content of material, and the temperature. Variation of material
CP concentration determines the magnitude of the increase, and higher increases
were noted for cassava stems with low CP concentration after urea treatment.
Table 3.1. Effect of urea level and storage time on crude protein in cassava stems
Storage time, weeks
Urea
(%)
0
2
4
6
8
SEM
p-value
0
6.14 aE
6.11dEF
6.06eF
5.63dG
5.18eH
0.014 <0.001
1
7.69bF
8.43cE
8.48dE
8.0cEF
7.98dEF
0.147
0.009
cG
cG
cE
bE
2
8.01
8.08
9.74
9.71
9.40cF
0.065 <0.001
3
8.41dF
13.7bE
13.6bE
13.4aE
13.3bE
0.197 <0.001
eH
aE
aEF
aFG
4
10.0
15.3
14.9
14.2
14.0aG
0.172 <0.001
SEM
0.074
0.134
0.119
0.194
0.138
p-value
<0.001
<0.001
<0.001
<0.001
<0.001
abcd
Mean value in columns with different superscripts are significantly different
(p<0.05)
EFGH
Mean value in rows with different superscripts are significantly different (p<0.05)
SEM: standard error of mean
p- value: The level of statistical significance is different.
The HCN content in cassava stems treated with 2% or higher urea level after
2 weeks storing was lower than 100mg/kg DM (from 95.3 to 98.8mg/kgDM), and
lower than 50mg/kgDM after 4 weeks storing (35.6 – 43.4mg/kgDM) (Table 3.2).
This means that the goat (20kg live weight) will eat 19.9 to 24.3mg of HCN
(equivalent to 1-1.2mg / kg of LW), which is not yet enough to be toxic for goats.
The decrease in HCN with storage time may similarly be the result of the high pH
10
(>7.00) following 2 weeks of storage with urea and would appear to be related to
chemical reactions resulting in neutralization of the hydrocyanic acid by the
ammonia.
Table 3.2. Effect of urea level and storage time on HCN (mg/kgDM) content of cassava stems
Storage time, weeks
Urea
(%)
0
2
4
6
8
SEM
p- value
0
146.9E
111.2aF
69.6aG
46.6H
ND
2.103 <0.001
1
146.8E
108.3aF
47.6bG
ND
ND
0.794 <0.001
2
136.7E
96.3bcF
43.4bG
ND
ND
1.46 <0.001
3
147.7E
98.8bF
38.5cG
ND
ND
1.219 <0.005
4
142.8E
95.8cF
35. 7cG
ND
ND
0.571 <0.001
SEM
2.576
0.715
1.038
0.879
p-value
0.044
<0.001
<0.001
<0.001
Notes: ND: No detect
abcd
Mean value in columns with different superscripts are significantly different (p<0.05)
EFGH
Mean value in rows with different superscripts are significantly different (p<0.05)
SEM: standard error of mean
p- value: The level of statistical significance is different.
EXPERIMENT 2
Chemical composition of diet ingredients
Table 3.3. Chemical composition of diet ingredients (UCS is urea-treated cassava
stems) in experiment 2
% in DM
Items
DM, % CP ADF NDF
OM
WRC
pH
CS
33.4 5.50 51.8 66.3
93.5
UCS
23 .0 11.7 51.4 67.1
92.0
nd
6.92
Water spinach
13.6 18.1 27.6 36.2
93.4
nd
Biochar
90.4
4.60
Notes: nd: Not determined; WRC: Water retention capacity
CS: cassava stems; UCS: urea treated cassava stems
DM: Dry matter. CP: Crude protein; ADF: Acid detergent fiber; NDF: Neutral
detergent fiber, OM: Organic matter
Feed intake
Increasing intake of diet DM, and especially of the dietary concentration of
crude protein, with resultant improvements in N retention All these effects appear
to have been caused by the increased crude protein content of the diet when the
water spinach was fed (13.0 versus 9.4% in the DM). When the N retention data
were corrected for differences in N intake the effects of the water spinach were no
longer apparent
Table 3.4. Effect of biochar and water spinach on feed intake
11
Unit
(gDM/day)
Treatment
UCS
367a
0
0
367b
2.27d
UCSB
428a
3.84
0
432ab
2.59c
UCSW
300b
0
159
459ab
2.83b
SEM
p- value
UCSWB
352ab
3.91
163
519a
3.12a
UCS
15.10
0.002
Biochar
0.450
<0.001
Water spinach
3.306
<0.001
Total DM intake
19.97
0.009
DMI, % LW
0.048
<0.001
OMI
337c
391bc
428ab
488a
15.04
<0.001
(gDM/day)
CP in DM, %
11.4b
11.6b
14.05a
14.07a
0.512
0.003
ME (MJ/kgDM)
4.00
4.35
4.12
4.47
0.207
0.376
abcd
Mean value in rows with different superscripts are significantly different (p<0.05)
UCS: urea treated cassava stems; UCSB: UCS with biochar; UCSW: UCS with water
spinach; UCSWB: UCS with water spinach and biochar.
SEM: standard error of the mean
p- value: The level of statistical significance is different.
Biochar increased daily N retention by 46% on the diet of urea-treated cassava
stems and by 21% when water spinach replaced half of the urea-treated cassava
stems (Table 3.5). Comparable values for the increases in biological value of the
protein were 12 and 4%.
Table 3.5. Nutrient digestibility (%) and nitrogen balance in goats fed urea-treated
cassava stems supplemented with or without fresh water spinach and biochar.
Treatments
Items
UCS
UCSB
UCSW UCSWB SEM
p
Nutrient digestibility
(%)
Dry matter
59.4b
64.8a
60.8b
66.3a
0.88
0.001
Crude protein
53.2b
60.1ab
61.7ab
63.1a
1.54
0.010
Organic matter
59.4
65.0
61.6
66.8
1.78
0.066
N balance, g/d
Intake
8.13c
9.36bc
12.4ab
13.0a
0.782
0.001
bc
c
a
ab
Feces
3.79
3.65
5.09
4.81
0.245
0.003
Urine
1.30
1.17
1.42
1.25
0.217
0.874
Nitrogen retention
(g/day)
3.03b
4.42ab
5.84a
6.91a
0.607
0.004
b
ab
ab
a
% of N intake
37.4
47.3
46.9
52.9
2.55
0.008
% of N digested
69.9c
78.6b
80.0ab
84.3a
1.390
<0.001
Notes: a,b,c Mean values with the different letters in the same rows are significantly
different at the level of P≤0.05
UCS: urea treated cassava stems; UCSB: UCS with biochar; UCSW: UCS with water
spinach
12
CONCLUSIONS
Supplementation with 1% of biochar and 1% water spinach to a diet of ureatreated cassava stems, increased the DM intake by 41% , the apparent dry matter
(DM) digestibility and nitrogen (N) retention in goats. Biochar increased daily N
retention by 46% and the biological value of the absorbed N by 12%.
CHAPTER 4: EFFECT OF DIFFERENT LEVELS OF BREWERS’
GRAINS SUPLEMENTATION ON PERFORMANCE AND
METHANE EMISSION OF GOATS FED CASSAVA FORAGE
INTRODUCTION
Cassava (Manihot esculenta Crantz) is a major crop in Vietnam, grown on
570,000 ha producing annually some 1 million tonnes of roots (GSO, 2016). The
roots are used mainly for manufacture of starch and as an ingredient in livestock
feed. Growing the crop as a semi-perennial forage with repeated harvesting at 2 to
3month intervals is a recent development (Wanapat 1997; Preston and Rodriguez,
2004). Several reports have shown the benefits of the fresh forage as a source of
bypass protein in ruminant diets based on molasses-urea (Ffoulkes and Preston,
1978), rice straw (Do et al., 2002; fresh cassava stems (Trinh Xuan Thanh et al.,
2013) and ensiled cassava pulp-urea (Keopaseuth et al., 2017; Binh et al., 2017).
The use of fresh cassava forage as the sole diet of goats was pioneered by Sina et
al., 2017. Growth rates on a diet of fresh cassava forage were 65 g/day and were
more than doubled to 160 g/day when a small supplement (5%) of ensiled brewers’
grains was included in the diet, It was proposed that this “synergistic” effect of the
brewers’ grains was due to its role as a source of beta-glucan, a component of the
cell walls of cereal grains and fungi such as yeasts, that has been shown to have
prebiotic properties (Novak and Vetvicka 2008).The present experiment was
designed to provide further evidence for the prebiotic effect of brewers’ grains in a
basal diet of cassava forage fed to growing goats. Proportions of ensiled brewers’
grains above (6%) and below (2%) the 4% level were compared to identify the
optimum level.
MATERIALS AND METHODS
Experimental design
Four “Bach Thao” goats (14 ± 2 kg) were fed the 4 levels if ensiled brewers’
grains (0, 2, 4 and 6% DM basis) as the only supplement to a diet of ad libitum
13
fresh cassava forage (sweet variety). The design was a Latin square with four
treatments and four periods, each lasting 15 days.
Animals and management
The goats were housed in metabolism cages made from bamboo, designed to
collect separately feces and urine. They were vaccinated against Pasteurellosis and
Foot and Mouth disease and treated with Ivermectin (1ml/10 kg live weight) to
control internal and external parasites. They were weighed between 06:30 and
07:30h before feeding at the start and end of each experimental period.
Feeds and feeding
The cassava forage was harvested 50-60cm above soil level at intervals of
120 days when it had attained a height of 100 - 120 cm. Harvesting of the cassava
was done 2h prior to each feed, morning and afternoon. The forage was chopped
by hand prior to being put into the feed troughs. The brewers’ grains were stored
in closed plastic bags for every 5 days. The chosen amounts were offered twice
daily in troughs separate from the cassava forage. Feed refusals were weighed
every morning prior to giving the new feed. Samples of each diet component were
collected daily and bulked at the end of each period for analysis.
Digestibility and n retention
During the data collection periods, the feces and urine were recorded twice daily at
7:00 and 16:00 and added to jars containing 100 ml of 10% sulphuric acid. The pH
was measured and, if necessary, more acid added to keep the pH below 4.0.
Rumen parameters
Rumen fluid was taken by stomach tube 3h after the morning feed following
the last day of each collection period. During this time the goats were still on the
designated diet for that period.
Rumen gas emissions
At the end of each period the goats were confined individually in a gas-proof
chamber (a bamboo frame covered with polyethylene plastic) for sampling of
eructed gases and residual air in the chamber. Measurements of the concentrations
of methane and carbon dioxide were taken continuously over a 10-minute period,
using a Gasmet infra-red meter (GASMET 4030; Gasmet Technologies Oy,
Pulttitie 8A, FI-00880 Helsinki, Finland).
Analytical procedures
All of samples of feeds offered and refused, and of the feces, were analysed
for DM and Ash by AOAC (1990) methods. NDF and ADF were analyzed
according to the procedure of Van Soest and Robertson (1991). Nitrogen in urine
and ammonia in rumen fluid were determined by the Kjeldahl method (AOAC
1990). Metabolizable energy (ME) of the diet (MJ/kg) were calculated from
organic matter digestibility (OMD: %) by formula of Mc Donald et al. (2002). The
formula is: ME = 0.160*OMD.
14
Statistical analysis
Data were analyzed with the General Linear Model option of the ANOVA
program in the MINITAB software (Minitab 2016). Sources of variation were
treatments, animals, periods and error.
RESULTS AND DISCUSSION
Chemical composition
The crude protein (CP) of the cassava forage (leaf and petiole combined)
was considerably lower than the value of 21% CP in DM reported by Sina et al.,
2017 where the leaf alone had 29% CP in DM and the petiole 9.6% in DM.
Table 4.1. Composition of diet ingredients
% in DM
DM,
CP
NDF
ADF Ash
pH
%
Cassava forage
21.9
12.6
47.0
39.1 7.77
Brewers’ grains
23.7
26.4
36.8
26.6 5.37
4.35
Notes: DM: Dry matter, CP: cruduce protein, NDF: Neutral Detergent fiber;
ADF: Acid detergent fiber
Feed intake and digestibility
Increasing the proportion of cassava forage DM fed to goats from 0 to 47%
of total DM feed offered resulted in increased DM intake (DMI), organic matter
(OM) digestibility and nitrogen retention. In the present results, metabolizable
energy was increased by the level of brewers’ grains in the diet. The level of CP in
the treatment 3 was 7,5g CP/kg LW/day with the ME intake and daily gain of 3.80
MJ/day and 142g, respectively (Table 4.2).
Table 4.2. Feed intake in goats fed cassava forage supplemented with different levels of
brewers’ grains
Treatment
BG0
BG2 BG4 BG6 SEM
p
Items
DM intake, g/d
441c
486b
540a
468b
5.92
<0.001
Cassava forage
d
c
b
a
0.00
10.7
22.3
30.7
0.09
<0.001
Brewers’ grains
c
b
a
b
441
497
562
498
6.33
<0.001
Total DM
% of DM intake
0.00
2.15
3.97
6.16
0.05
<0.001
Brewers’ grains
12.9
14.0
13.5
14.6
0.54
0.192
Crude protein
b
ab
ab
ab
3.55
3.90
3.80
4.45
0.189
0.034
ME (MJ/day)
Notes: BG0; BG2; BG4 and BG6: Treatments supplemented brewers’grain levels of 0,
2, 4, 6% (DM basic)
abcd
Mean values with different letters within the same rows are significantly different
at the level of P≤0.05
15
Table 4.3. Nutrient digestibility (%) in goats fed cassava forage supplemented
with different levels of brewers’ grains
Items
Treatments
SEM
p
70.8b
1.66
0.021
70.8b
65.5b
2.7
0.036
58.2b
66.0c
56.6ab
1.05
0.001
67.4
70.6
63.0
4.34
0.248
BG0
BG2
BG4
BG6
CP
62.4a
69.9b
72.7b
DM
55.9a
67.2b
OM
53.0a
NDF
57.8
Notes: CP: crude protein; DM: dry matter; OM: organic matter, NDF: neutral
detergent fiber; BG0, BG2; BG4; BG6: Treatments supplemented brewers’grain
levels of 0, 2, 4, 6% (DM basic).
abc
Mean values with the different letters in the same rows are significantly
different
at the level of P≤0.05
Nitrogen retention
The effect of adding 4% brewers’ grains to the diet was a 65% increase in N
retention and a 14% increase in N retained per unit of N digested.
Table 4.4: N balance (g/day) in goats fed cassava forage supplemented with
different levels of brewers’ grain
Treatments
SEM
p
Nitrogen
BG0
BG2
BG4
BG6
Nitrogen balance, g/d
Intake
9.82
11.1
12.1
11.6
0.836
0.291
Feces
3.75
3.36
3.35
3.49
0.480
0.491
Urine
1.63a
1.27b
1.49ab
1.64a
0.066
0.024
Nitrogen retention
g/d
4.44b
6.48a
7.27a
6.51a
0.286
0.007
% of N intake
45.6
58.4
60.2
56.0
4.55
0.070
b
a
a
a
% of N digested
72.6
83.5
82.8
79.8
1.66
0.002
Notes: BG0, BG2; BG4; BG6: Treatments supplemented brewers’grain levels of
0, 2, 4, 6% (DM basic)
ab
Mean values with the different letters in the same rows are significantly
different
at the level of P≤0.05
Methane emissions
The ratio of methane to carbon dioxide in the mixture of eructed gas and air
in the plastic-enclosed chambers increased with a curvilinear trend as the daily
intake of brewers’ grains was increased.
The mechanism by which small quantities of brewers’ grain (4% of diet DM)
bring about these positive effects, benefitting animal performance, but increasing
16
ratio of methane and carbon dioxide is still to be identified. Here we suggest the
idea that substances in brewery grains (perhaps β-glucan or related compounds)
support biofilm formation which in turn increases the efficiency of microbial
growth (Leng, 2014).
Table 4.5. Mean values for the ratio methane: carbon dioxide in mixed eructed gas and
air in the plastic-enclosed chambers where the goats were enclosed over ten minutes
periods
Treatments
SEM
p
BG0
BG2
BG4
BG6
CH4/CO2
0.026b
0.027b
0.031ab
0.042a
0.003
0.013
Notes: BG0, BG2; BG4; BG6: Treatments supplemented brewers’grain levels of 0, 2,
4, 6% (DM basic)
ab,
Means within rows without common superscripts differ at P<0.05
CONCLUSIONS
Adding 4% of brewers’ grains to a diet of cassava forage increased the DM
intake, the apparent DM digestibility, the N retention and the biological value of
the absorbed nitrogenous compounds. The ratio of methane to carbon dioxide in
the mixture of cructed gas increased with a curvilinear trend as the level of
brewers’ grains in the diet was increased.
CHAPTER 5: EFFECT OF BIOCHAR SUPPLEMENTATION
LEVELS ON GROWTH AND METHANE EMISSIONS OF
GOATS FED FRESH CASSAVA FORAGE
INTRODUCTION
The population of goats in An Giang in 2017 was 6 times higher than in
2012 (Statistic yearbook of An Giang 2017). The relative price of meat from goats
is higher than that from cattle, eg: price of goat meat 3.2 USD/kg LW compared to
cattle (2.5 USD/kg LW) (Do Thi Thanh Van et al., 2018). Most goats are kept in
confinement in small scale systems with the feed supplied from around the
household or close by (eg: natural grasses, water spinach, sweet potato leaves…but
not cassava forage, that is traditionally thrown away, or burned, causing
environment pollution). This contrasts with the report of Preston (2001), that
cassava forage can be a valuable source of protein for feeding to many kinds of
animals. Brewers’ grains are the solid residue left after the distillation of
germinated cereal grains to produce beer and other alcoholic beverages. The
recent reports of benefits in growth and health of cattle and goats fed small
quantities of brewers’ grains (Thuy Hang et al 2018; Silivong et al 2018; Binh et al
2017) are believed to be related to their “prebiotic” qualities in enhancing the
action of beneficial microbial communities along the digestive tract of the animal
17
(Inthapanya et al 2019). Biochar is generated from the partial combustion or
fibrous biomass, and although primarily used as a soil amendment (Lehmann and
Joseph 2009; Preston 2015), it has recently been reported that at a level of 1% of
the diet DM enhanced the growth rate and reduced enteric methane emissions of
cattle (Leng et al 2012) and goats (Binh et al 2018; Silivong et al 2018).
The hypothesis underlying the research reported in this paper was that growth rate
and methane emissions of goats would reflect a dose response relationship to
biochar, which merited the study of levels of biochar in the range of 0 to 1.5% in diet
DM
MATERIALS AND METHODS
Experimental design
Twelve growing male goats of the Bach Thao breed, with an initial body
weight 16 ± 1 kg and about 3.5 – 4.5 months of age, were housed in individual
cages (Figure1) and given a basal diet of fresh cassava forage ad libitum plus 4%
(DM basis) of ensiled brewers’ grain. Treatments were 4 levels of biochar: 0, 0.5,
1.0 and .1.5% of diet DM. The design was a randomized completely block design
with three replicates of the four treatments. The trial was for 12 weeks after a
period of 15 days to accustom the goats to the diets.
Feeding and management
The Cassava forage (leaves, petioles and stems) were harvested at 60 days
intervals. The cassava forage was fed to animals 2- 3 hours after harvesting.
Harvesting was by hand-cutting the cassava stems at ground level then rejecting
the lower 50cm of “hard” stems. The brewers’ grains were brought from the
brewery in Kien Giang Province every 10 days. The biochar was produced by
burning rice husks in a top-lit, updraft (TLUD) gasifier stove (Olivier 2010). The
animals had free access to clean water for drinking.
Measurements
Live weight was recorded in the morning before feeding at the beginning
and at 10-day intervals until the end of the 90-day experiment. Live weight gain
was calculated from the linear regression of live weight (Y) on days from the start
of the experiment (X).
Feed consumption was recorded by weighing feeds offered and refusals
from individual animals every morning before offering new feed
Eructed gas emissions and analysis
At the end of the experiment the goats were confined individually in a closed
chamber for sampling of eructed gases and residual air in the chamber (Madsen et
al., 2010). Measurements of the concentrations of methane and carbon dioxide
were taken continuously over a 10-minute period, using a gasmet infra-red meter
(gasmet 4030; gasmet technologies oy, pulttitie 8a, fi-00880 helsinki, finland).
18
Analytical procedures
Samples of feed offered and refused were analysed for DM, crude protein
(CP) and ash by AOAC (1990) methods. NDF and ADF were determined by the
methods of Van Soest et al. (1991). The equivalent hydrogen cyanic acid content
(hcn) in forage of fresh cassava leaves was determined as per AOAC (2016).
Condensed tannins were determined by the method of AOAC 955.35 (2016). The
water retention capacity (WRC) of the biochar was determined by suspending 100g
(Wi) of dry biochar in 1 liter of water for 24h, after which it was filtered, and the
wet weight of biochar determined as Wf. The water retention capacity was
determined as: WRC = [Wf-Wi)]/Wi
Statistical analysis
Data were analyzed with the general linear model option of the anova
program in the MINITAB software (Minitab 2016). Sources of variation were
treatments and error. Production responses (feed intake, live weight gain and feed
conversion) were related to percent biochar in the diet using polynomial regression
equations from Microsoft Office Excel software.
RESULTS AND DISCUSSION
Composition of diet ingredients
Two batches of biochar were used in the experiment. The first batch, which
was fed during the 15-day adaptation period and the first 10 days of the growth
trial had a water retention capacity of 3.81 ml water/g dry biochar. The second
batch which was fed from day 10 of the feeding trial to the end after 90 days had a
much higher water retention capacity of 4.89.
Table 5.1. Composition of diet ingredients
DM, %
CP
Ash
% in DM
ADF
NDF
Tannin
HCN
ppm
WR
C
ml/g
Cassava
Forage
28.1
13.7
6.8
39.2
48.3
2.99
115
cassava
stems
26.8
5.4
10.9
41.2
51.4
Leaf +
petiole
29.4
22.1
2.7
37.3
45.1
Brewers’ grain
28.1
29.5
5.4
26.6
40.1
Biochar (1)
89.6
76.9
3.81
Biochar (2)
95.7
69.7
4.89
Notes: DM: Dry matter, CP: Crude protein; ADF: Acid detergent fiber; NDF: Neutral
detergent fiber; HCN: Hydrogen cyanic acid; WRC: Water retention capacity.
Feed intake
For all the growth criteria expected to be influenced by nutrient
manipulation of ruminant diets the responses were curvilinear with positive effects
19
from increasing biochar supplementation from 0 to 0.86% of the diet DM followed
by a decline as the biochar level was raised to 1.3% in diet DM.
Table 5.2. Feed intake in goats fed increasing levels of biochar in a diet of fresh
cassava forage
Biochar, % in diet DM
DM intake
SEM
p
(g/day)
B0
B0.5
B1.0
B1.5
Cassava forage
544b
560ab
623a
572ab
18.2
0.016
Brewers' grains
19.5
20.0
22.5
21.4
0.88
0.070
d
c
b
a
Biochar
0
2.11
5.58
7.74
0.265
<0.001
Total
564b
582ab
652a
601ab
19.2
0.010
CP, % in DM
14.2
14.1
14.0
14.0
0.075
1.00
Notes: B0; B0.5; B1.0; B1.5: Treatments supplemented biochar levels of 0;0.5;
1.0; 1.5 (% in diet DM)
acdb
Means without common superscript differ at p<0.05
SEM: Standard error of the mean
Growth and feed conversion
Biochar is not a nutrition source for the animals, but it will be an additive
effect on reduction of methane emissions from adding both biochar (increasing the
potential microbial habit) and nitrate to the diet of cattle fed a base diet of fresh
cassava root chips supplemented with fresh cassava leaves (Leng et al., 2012).
Table 5.3. Live weight and feed conversion in goats fed increasing levels of
biochar in a diet of fresh cassava forage
Biochar, % in diet DM
B0
B0.5
B1.0
B1.5
SEM
p
Live weight, kg
Initial
16.5
16.1
16.7
16.4
0.487
0.83
Final
25.5
26.6
28.3
26.3
0.828
0.18
b
ab
a
ab
LW gain, g/d
100
117
129
111
5.04
0.03
FCR
5.66
4.88
5.1
5.39
0.19
0.083
Notes: B0; B0.5; B1.0; B1.5: Treatments supplemented biochar levels of 0;0.5;
1.0; 1.5 (% in diet DM)
ab
Means without common superscript differ at p<0.05
FCR = DM consumed/weight gain
Methane emission
The ratio of methane and carbon dioxide in eructed gases from goats fed
cassava forage supplemented with different level of biochar.
The ratio of methane and carbon dioxide was the effect on the rumen
fermentation the improvement (decrease in methane production) was decreased
linear in goats fed increasing levels of biochar in a diet of fresh cassava forage.
Table 5.4: The ratio methane: carbon dioxide in eructed gases from
goats fed cassava forage supplemented with biochar
Biochar, % in diet DM
Items
B0
B0.5
B1.0 B1.5 SEM
p
20
CO2, ppm
CH4, ppm
982
32.4
0.033
669
18.2
686
16.3
709
15.7
0.000
CH4/CO2
0.028
0.025 0.02
6
<0.001
Notes: B0; B0.5; B1.0; B1.5: Treatments supplemented biochar levels
of 0;0.5; 1.0; 1.5 (% in diet DM)
abcd
Means without common superscript differ at p<0.05
a
b
c
d
CONCLUSIONS
Feed intake, live weight gain and feed conversion were improved by
increasing biochar supplementation from 0 to 0.86% of the diet DM followed by a
decline as the biochar level was raised to 1.3% in diet DM. Daily live weight gain
was icreased 26% by supplementation with biochar at 0.86 % in diet dry matter.
The ratio of rumen methane emissions and carbon dioxide were reduced
numerically 24% for the 0.86% biochar treatment relative to no biochar.
GENERAL CONCLUSIONS
The positive effects of storing (ensiling) the cassava stems with addition of
urea are the reduction in HCN levels and the possible synthesis of protein from the
ammonia derived from the urea and the fermentation of part of the carbohydrate in
the cassava stems. Urea treatment of the cassava stems (with 3% in DM) increased
the crude protein from 5.5 to 11.7% in DM and can be preserved up to 8 weeks.
Cassava stems treated with 3% urea in DM improves nutrietive value and
DM intake up to 18% by supplementing with biochar. Addition of water spinach
increased total DM intake by 25% while the combined effect of biochar plus water
spinach was to increase intake by 41%. Biochar increased daily N retention by
46% and the biological value of the absorbed N by 12%. Biochar provides no
protein to the diet, thus it is postulated that the increase in N retained and in its
biological value came about as a result of the biochar stimulating rumen
microbialgrowth resulting in an increase in synthesis and hence of absorption of
amino acids.
Adding 4% of brewers’ grains to a diet of cassava forage increased the DM
intake, the apparent DM digestibility, the N retention and the biological value of
the absorbed nitrogenous compounds. The benefits of such small quantities of
brewers’ grains are believed to be related to their “prebiotic” qualities in enhancing
the action of beneficial microbial communities along the digestive tract of the
animal.
Feed intake, live weight gain and feed conversion were improved by
increasing biochar supplementation from 0 to 0.8% of the diet DM followed by a
decline as the biochar level was raised to 1.3% in diet DM. Rumen methane
emissions were reduced with a linear trend as the level of biochar in the diet was
increased.
21
PUBLICATION LIST
This thesis is based on the work contained in the following papers:
Paper 1: Digestibility, nitrogen balance and methane emissions in goats fed cassava
forage and restricted levels of brewers’ grains. Livestock Research for Rural
Development.
Volume
30,
Article
#68
from
/>Paper 2: Effect of biochar and water spinach on feed intake, digestibility and Nretention in goats fed urea-treated cassava stems. Livestock Research for Rural
Development.
Volume
30,
Article
#93.
from
/>Paper 3: Effect of biochar on growth and methane emissions of goats fed fresh
cassava forage. Livestock Research for Rural Development. Volume 31, Article
#67. from />Paper 4: Effect on nutritive value of cassava (Manihot esculenta Crantz) stems of
ensiling them with urea. Livestock Research for Rural Development. Volume 31,
Article #92. from />
22