Optimization of a flow injection hydride generation atomic absorption spectrometric method for the determination of arsenic, antimony and selenium in iron chloridesulfate based water treatment chemical
Bạn đang xem bản rút gọn của tài liệu. Xem và tải ngay bản đầy đủ của tài liệu tại đây (267.72 KB, 10 trang )
Analytica Chimica Acta 439 (2001) 229–238
Optimization of a flow injection hydride generation atomic
absorption spectrometric method for the determination of arsenic,
antimony and selenium in iron chloride/sulfate-based water
treatment chemical
Teemu Näykki a,∗ , Paavo Perämäki a , Jyrki Kujala b , Anna Mikkonen b
a
b
Department of Chemistry, University of Oulu, P.O. Box 3000, FIN-90014 Oulu, Finland
Kemira Chemicals Oy, Oulu Research Centre, P.O. Box 171, FIN-90101 Oulu, Finland
Received 26 September 2000; received in revised form 3 March 2001; accepted 19 March 2001
Abstract
The flow injection hydride generation technique together with atomic absorption spectrometry was used for the determination of arsenic, antimony and selenium in the iron-based water treatment chemical FeClSO4 . Thiourea, l-cysteine and
potassium iodide–ascorbic acid were used as masking agents to diminish the interference caused by the very high iron concentrations in the samples. These reagents act also as prereductants for As(V) and Sb(V). Thiourea and l-cysteine did not
prevent the signal depression caused by such high iron content, but potassium iodide–ascorbic acid eliminated iron interference
well even up to 2500 mg Fe l−1 . The limits of detection (LODS) in aqueous solutions containing no iron were 0.037 g l−1 ,
0.121 g l−1 and 0.131 g l−1 for As, Sb and Se, respectively. The linear dynamic range was 0–10 g l−1 for As and 0–30 g l−1
for Sb and Se. The precision relative standard deviation was expressed as 2.6% for As, 4.4% for Sb and 2.9% for Se. The
precision determinations were done on the FeClSO4 matrix at the level 0.5–0.8 g l−1 for the elements to be analyzed. The
accuracies of the methods were tested by using two standard reference materials (SRM 361, LA Steel and SRM 2074, river
sediment). The concentrations obtained for As, Sb and Se were very close to the certified values. © 2001 Elsevier Science
B.V. All rights reserved.
Keywords: Atomic absorption spectrometry; Hydride generation; Flow injection; Arsenic; Antimony; Selenium; Iron interference; Water
treatment chemical
1. Introduction
It is commonly known that the transition metals interfere in the determination of hydride-forming elements when the hydride generation (HG) technique is
used [1,2]. Different mechanisms have been suggested
∗ Corresponding author. Present address: Finnish Environment
Institute (FEI), Research Laboratory, Hakuninmaantie 4-6,
FIN-00430 Helsinki, Finland. Fax: +358-9-4030-0890.
E-mail address: (T. Näykki).
for the interference effects observed [3,4]. The predominant mechanism is probably due to the reaction
of the interfering transition metal ions with the NaBH4
reductant, and the precipitate which is formed is able
to capture and catalytically decompose the evolved
hydrides [3]. For instance, Bax et al. [4] and Bye [5]
have stated that the precipitates are probably not elemental metals, but rather metal borides. Lugowska
and Brindle [6] investigated the redox processes occurring in transition metal solutions during reduction
by NaBH4 . Also they found, boron(III) as boride-like
0003-2670/01/$ – see front matter © 2001 Elsevier Science B.V. All rights reserved.
PII: S 0 0 0 3 - 2 6 7 0 ( 0 1 ) 0 1 0 0 1 - 7
230
T. Näykki et al. / Analytica Chimica Acta 439 (2001) 229–238
species causing the suppression of the signal in hydride generation [6].
Iron is a common transition metal that is present
at high concentrations in many type of samples.
However, only a few studies have been published
where the iron concentrations of the samples are as
high as in this work. Narsito et al. [7] found that
the interference caused by 200 mg l−1 iron was removed when 1% thiourea was used as a prereductant.
Wickström et al. [8] studied hydride generation and
the complexation reactions in an alkaline sample
solution. The hydrides formed were evolved by subsequent acidification of the sample solution. They
found that 0.3 mol l−1 tartrate completely removed
iron interference at the 500 mg Fe l−1 level and when
the iron concentration was 5000 mg l−1 , the signal
was depressed by only 15%. However, dissociation of
the metal complex can occur during the acidification
of the sample. Thus, the formation of free metal ions
and precipitation is possible. Boampong et al. [9]
used 3% l-cystine in 5 mol l−1 hydrochloric acid as
a masking agent to prevent the interferences of very
high concentrations of iron. Welz and Sucmanova [10]
proposed the use of l-cysteine instead of l-cystine
as a masking agent. Earlier Chen et al. [11] had observed that l-cysteine removed iron interference up to
1000 mg l−1 even though the solution became turbid
due to the formation of l-cystine when the iron(III)
concentration was greater than 200 mg l−1 . Generally l-cysteine has been proved to be very useful for
preventing iron interferences, but nearly all previous publications have focused on iron concentrations
below 1000 mg l−1 . Finally, it is worth noting that
iron(III) has also been used for minimizing interference effects of the other transition metals in the HG
technique. The high positive potential of the reduction
of iron(III) to iron(II) suggests a preferential reduction of this species. More seriously interfering metal
ions, such nickel(II) and copper(II), will be reduced
to the metals and precipitated only after all the iron
has been reduced. [12,13].
The extent of the transition metal interference depends very much on the HG system used. Severe interference was observed when we earlier used the
batch type hydride generation system described by
Siemer and Hagemann [14]. The flow injection (FI)
technique is less prone to transition metal interference [10,15]. There are at least two main reasons for
this observation. When using the FI system instead of
the batch system, the concentration of the reductant is
usually lower and formation of the interfering precipitates, e.g. borides, is decreased. Another reason can
be called kinetic discrimination. The reduction of the
hydride-forming elements is fast and the reaction is
completed before the reduction of the transition metal
ion to the interfering species. Also the separation of
the hydrides from the sample matrix is very fast in a
gas–liquid separator.
In this study, the parameters for the determination of As, Sb and Se from the PIX-110TM chemical
(FeClSO4 ) using flow-injection hydride generation
(FI-HG) were optimized. The PIX-110TM water coagulant is a FeClSO4 solution manufactured by Kemira
Chemicals Oy, containing approximately 12.0 wt.%
(180 g l−1 ) of Fe3+ , 22.3% of SO4 2− and 7.5% of
Cl− . Since As, Sb and Se are toxic, the European
Committee for Standardization (CEN) has laid down
the maximum limits for these elements and therefore
it is essential to monitor their low amounts in water
treatment chemicals [16].
2. Experimental
2.1. Instrumentation
A Perkin-Elmer model 5100 Zeeman atomic absorption spectrometer equipped with a Perkin-Elmer
model FIAS-400 flow injection system and an AS90
autosampler, controlled by Perkin-Elmer AA WinLab
version 2.61 software, was used for the measurements.
Silicone pump tubes (NaBH4 : 1.14 mm i.d.; carrier
HCl: 1.52 mm i.d.; sample loading and waste: 3.17 mm
i.d.) were used throughout this study, and all other
tubing was 1 mm i.d. PTFE. An electrically heated
quartz tube was used as an atomizer. Electrodeless discharge lamps, operated from an external power supply
(Perkin-Elmer EDL system 2) were used for the measurements. The instrumental parameters are shown in
Tables 1 and 2; they were mainly chosen according to
the manufacturer’s recommendations.
2.2. Reagents and standard solutions
All reagents were of analytical-reagent grade unless otherwise stated. Ultrapure water (18 M cm−1 ),
T. Näykki et al. / Analytica Chimica Acta 439 (2001) 229–238
Table 1
AA spectrometer settings used for the hydride generationAAS-measurements
Wavelength (nm)
Lamp current (mA)
Measured signal
Measuring time (s)
Slit width (nm)
Quartz cell temperature (◦ C)
Quartz cell length/i.d. (mm/mm)
Reaction coil length (mm)
Sample volume (l)
Background correction
As: 193.7
Sb: 217.6
Se: 196.0
As and Sb: 400
Se: 280
Integrated absorbance
As: 15
Sb and Se: 18
0.7
900
180/7.5
300
500
No
prepared with a USF Elga Maxima purification system, was used throughout. All glassware and plastic
containers were soaked in (1 + 1) nitric acid overnight
and rinsed five times with de-ionized water and five
times with ultrapure water prior to use.
The working standard solutions were prepared
daily by diluting the 1000 mg l−1 standard stock solution of As(V) (Merck) and the 4000 mg l−1 Sb(III)
solution (Merck). To prepare the selenium standard
stock solution (1000 mg l−1 ) appropriate amounts
of selenium salts NaHSeO3 (Merck, for Se(IV)) or
Na2 SeO4 ·10H2 O (Merck, for Se(VI)) were dissolved
in ultrapure water. A few drops of concentrated hydrochloric acid were added before dilution.
The iron stock solution was prepared from
PIX-110TM , because it was observed to contain less
arsenic than the commercial iron(III) chloride standard. The 20,000 mg l−1 stock solution of Fe(III) was
prepared by diluting 16,5289 g (1000 g ≈ 0.667 ml)
of PIX-110TM solution (purity not certified) to 100 ml
with 4.7 mol l−1 HCl.
Table 2
FIAS-400 flow injection program
generation-AAS-measurements
used
for
the
hydride
Flow injection program
Step
Time (s)
Speed of pump
1 (rpm)
Speed of pump
2 (rpm)
Prefill
Fill
Injection
15
10
15
100
100
0
120
120
120
231
Sodium tetrahydroborate solution (0.1–0.3% (w/v))
was prepared daily by dissolving the appropriate
amount of NaBH4 powder (Fluka) in ultrapure water.
The solution was stabilized with NaOH (Merck).
Hydrochloric acid (0.03–4.7 mol l−1 , Merck) was
used in samples and as a carrier solution. Different
concentrations of HCl were used in the optimization
of the operating conditions.
The stock solution of potassium iodide was prepared by dissolving 5 g of potassium iodide (Merck) in
100 ml of ultrapure water. The ascorbic acid stock solution was prepared by dissolving 5 g of l(+)-ascorbic
acid (Merck) in 100 ml of ultrapure water.
Thiourea stock solution (2.0 mol l−1 ) was prepared
by dissolving 38 g of thiourea, (J.T. Baker, purity >
99%) in 250 ml of 1.5–4.7 mol l−1 HCl.
l-Cysteine stock solution was prepared by dissolving 5 g of l-cysteine (Merck, for biochemistry,
purity > 99%) in 100 ml of 0.03–0.09 mol l−1 HCl.
Different concentrations of l-cysteine and/or HCl
were used to optimize the operating conditions.
The standard reference materials (SRMs) 361
Low-alloy Steel and 2704 Buffalo River Sediment
were obtained from the National Institute of Standards and Technology (NIST, Gaithersburg, MD).
The samples were prepared by dissolving 1 g of the
SRMS in 30 ml of aqua regia (HCl:HNO3 , 3:1 (v/v)).
2.3. Procedure
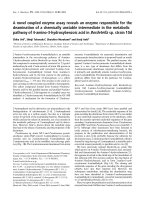
The FI system used consisted of two peristaltic
pumps: one was used for pumping the carrier and reductant solutions (HCl and NaBH4 , respectively) and
the other for pumping the sample solution (Fig. 1).
The carrier flow rate was 9 ml−1 min and the reductant flow rate was 5 ml−1 min. The 500 l sample loop
was used in all measurements.
The optimal instrumental parameters for As, Sb and
Se are given in Tables 3 and 4. Potassium iodide (0.5%
(w/v)) and ascorbic acid (1.0% (w/v)) were added as
prereductants for arsenic and antimony prior to analysis. The prereduction time used was 15 min. Selenium(VI) was reduced to selenium(IV) by heating the
sample in a beaker with HCl (4.7 mol l−1 ) at 90◦ C for
20 min.
The standard addition method was used when
PIX-110TM was analyzed. Dilutions of 1–225 ml (As)
or 1–72 ml (Sb and Se) were made before analysis.
232
T. Näykki et al. / Analytica Chimica Acta 439 (2001) 229–238
Fig. 1. Flow schematic of FIAS-400.
Iron was added to calibration standards to match
the iron content in the certified reference materials
when the accuracy of the method was tested. A more
detailed description of the method optimization and
validation is given in the next section.
Table 3
Optimal experimental conditions for the measurement of As and
Sba
Parameter
Optimal parameter
values
(mol l−1 )
HCl (carrier and samples)
Carrier gas (Ar) flow rate (ml min−1 )
As
Sb
4.7
∼65
1.5
∼100
a 0.5% (w/v) KI, 1.0% (w/v) ascorbic acid, 0.3% (w/v) NaBH
4
in 0.05% (w/v) NaOH.
Table 4
Optimal experimental condition for the measurement of Se
Parameter
Optimal parameter
values
HCl (carrier and samples) (mol l−1 )
Carrier gas (Ar) velocity (ml min−1 )
Prereduction temperature (◦ C)
Prereduction time (min)
NaBH4
4.7
∼65
90
20
0.1% (w/v) in 0.05%
(w/v) NaOH
3. Results and discussion
3.1. Selection of the prereduction agent
3.1.1. Arsenic and antimony
At the beginning of the study, the instrumental parameters were optimized using only aqueous As standards. The same parameters were used for Sb because
of the similar chemical nature of As and Sb. Optimum levels for carrier gas flow, reductant concentration, carrier-HCl concentration and the concentrations
of the prereductants were investigated using two-level
factorial designs. Measurements were performed without an interfering iron matrix. The results were processed with Modde for Windows version 3.0 software
(Umetri AB) [17]. Later, iron was added to the standard solutions and the optimization was repeated using
the parameters obtained from the previous stage. The
optimal concentrations of the various prereductants
were studied using iron contents up to 5000 mg l−1 .
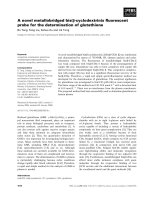
When optimizing the prereduction conditions, the
sample matrix contained 1500 mg l−1 of iron. The
optimal concentration of the ascorbic acid was investigated first and then kept at a constant level
(0.8% (w/v)) when optimizing the KI concentration (Fig. 2A). When the sample matrix contained
5000 mg l−1 iron 1.0% (w/v) ascorbic acid gave the
T. Näykki et al. / Analytica Chimica Acta 439 (2001) 229–238
233
Fig. 2. The effect of KI and ascorbic acid concentrations in the determination of As, when the iron concentration of the samples was:
(A) 1500 mg l−1 and (B) 5000 mg l−1 . Arsenic concentration in the samples was 1 g l−1 . HCl concentration of samples and carrier was
4.7 mol l−1 .
maximum sensitivity. The concentration of ascorbic
acid was kept at a constant level and the optimal KI
concentration was found to be 0.8% (w/v) (Fig. 2B).
The sensitivity obtained with thiourea and l-cysteine
was worse than that with KI. Using an iron concentration, <200 mg l−1 and l-cysteine as the masking
agent, the recovery of the signals of arsenic and antimony were excellent, as, for example, Welz [10] and
Chen [11] have reported. The use of concentrated iron
solutions caused a severe signal depression despite
the presence of l-cysteine; using a 1500 mg l−1 iron
matrix, the depression of the As signal was ony 50%
of the signal measured without iron.
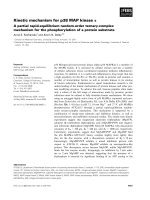
The prereduction times needed with the different
prereductants were investigated by measuring the response of 1 g As(V) l−1 solutions as a function of the
prereduction time (Fig. 3). For each measurement the
amount of As in the matrix/prereduction agents was
subtracted from the results. When thiourea was used,
the prereduction of As(V) occurred immediately. With
l-cysteine and KI–ascorbic acid the maximum sensitivity was achieved within 15 min. Fig. 3 shows also
Fig. 3. Variation of peak area for 1 g l−1 As as a function of prereduction time.
234
T. Näykki et al. / Analytica Chimica Acta 439 (2001) 229–238
the influence of the prereductants on the sensitivity.
The highest sensitivity was obtained with KI–ascorbic
acid. When KI–ascorbic acid was used a higher sensitivity (7%) was obtained in the presence of an iron
matrix. The reasons for this effect were not studied
further.
Memory effects were investigated by performing
about 10 successive atomizations from the samples
containing 1 g As l−1 and 5000 mg Fe l−1 . Immediately after, 10 successive atomizations were performed
without the iron matrix. For each measurement, the
amount of As in the matrix/prereduction agents was
subtracted from the results. Memory effects were not
observed in the presence of any prereduction agent.
Once again a dramatic decrease in the sensitivity
was observed when using prereductants other than
KI–ascorbic acid. When KI–ascorbic acid was used
in the presence of 5000 mg Fe l−1 , the sensitivity was
only 14% lower than that for the aqueous As standard.
Using thiourea or l-cysteine to prevent 5000 mg l−1
iron interference, depression of As-signals were over
75% compared to the signal measured without iron.
The existence of the matrix effect was studied by
observing the slopes of the calibration graphs obtained
with and without the iron matrix. The matrix effect
was observed when using thiourea and l-cysteine in
the presence of very high iron concentrations. The decrease in the calibration slope caused by the iron matrix was from 0.32 to 0.17 when thiourea was used
as prereductant. A similar effect was observed using l-cysteine, but with KI–ascorbic acid the measurements were practically free of the matrix effect
(change of slope 0.31–0.30).
3.1.2. Selenium
At first the optimal HCl concentration, prereduction time and prereduction temperature without an
interfering iron matrix were studied using two-level
factorial designs. Selenium(VI) was used in these
experiments. Prereductants, e.g. thiourea, can reduce
Se(VI) to the elemental state and the formation of hydride becomes impossible [18]. Therefore, different
prereduction agents for selenium were not examined.
The heating of the sample solution together with
hydrochloric acid has been observed to be the most
practical way to reduce Se(VI) to Se(IV). Using the
optimal parameters obtained from the previous stage,
the optimization was repeated in the presence of iron.
Table 5
The factors and their levels used for the optimization of parameters
for As and Sb by CCI designa
Factor
Low level (−)
High level (+)
NaBH4 (% (w/v))
HCl (mol l−1 )
Argon (ml min−1 )
KI (% (w/v))
Ascorbic acid (% (w/v))
0.1
1.5
50 (75)
0.1 (0.5)
0.1 (0.5)
0.3
4.7
100 (125)
1.0 (1.5)
1.0 (1.5)
a The star distance used was 0.35; values in brackets are for Sb.
The axial points of the design can be calculated using the equation:
(mean level) ± [(high level) − (mean level)] × star distance.
The most suitable prereduction agent, KI–ascorbic
acid, was used in the final optimization of the operating conditions for As and Sb by central composite
inscribed (CCI) design. In this design, each factor had
five-levels. The low and high levels of the design are
given in Table 5. The factor levels used for the optimization of Se parameters by CCI design are given in
Table 6.
3.2. Optimal parameters for As, Sb and Se
The final optimal parameters for As, Sb and Se are
shown in Tables 3 and 4. The memory effects and
the matrix effects for selenium were investigated using the optimal parameters as previously described for
As and Sb. As in the determinations of As and Sb,
a memory effect was not observed in the presence of
5000 mg Fe l−1 . However, the matrix effect was observed and, according to the results, the iron matrix
increased the sensitivity of the selenium determination by about 45% when the iron concentration of the
samples was 2500 mg l−1 . Using higher iron concentrations, the signals of the selenium determinations
Table 6
The factors and their levels used for the optimization of parameters
for Se by CCI-designa
Factor
Low level (−)
High level (+)
NaBH4 (% (w/v))
HCl (mol l−1 )
Argon (ml min−1 )
0.1
1.5
75
0.3
4.7
150
a The star distance used was 0.50; the axial points of the design
can be calculated using the equation: (mean level) ± [(high level)
− (mean level)] × star distance.
T. Näykki et al. / Analytica Chimica Acta 439 (2001) 229–238
were depressed and the sensitivity was lower. The increased sensitivity was probably due to an oxidizing
and complexing effect of Fe(III). It is known that elemental chlorine can sometimes be produced in the
sample solutions. According to the investigations carried out by Krivan et al. Se(IV) was slowly converted
to non-reactive Se(VI) due to back-oxidation by elemental chlorine [19,20]. If some iron is present in the
sample solution, it will form complexes with chloride,
thus preventing the formation of elemental chlorine.
This may partly explain the better sensitivity obtained
for selenium in the samples-containing iron.
The results also showed that when a lower prereduction temperature (50◦ C) was used, the selenium signal
from the aqueous standard solution was greater to that
from the solution-containing iron. When the temperature was raised to 70–90◦ C, the selenium signal from
the iron solution was larger. Thus, there is some evidence that selenium may be lost more easily from an
aqueous solution (as a volatile chloride or hydride, for
example), than from the solution having an oxidizing
iron(III). Anyway, prereduction of selenium with HCl
is a common practice in HG [18].
To minimize the matrix effects, the determination of
selenium in PIX-110TM was carried out using the standard addition method by adding 0.5–2.0 g l−1 Se(VI)
prior to prereduction.
3.3. Validation of the methods
Detection limits (blank+3σ ) and quantitation limits
(blank + 10σ ) for As, Sb and Se were determined
in aqueous solutions that contained no iron matrix.
The detection and quantitation limits are presented in
Table 7. The linear dynamic ranges for As, Sb and
Se (Table 8) were monitored in aqueous solutions.
Precision and reproducibility was determined using
the standard addition method.
235
Table 8
Linear dynamic ranges for As, Sb and Se in aqueous solutionsa
Element
Linear range
(g l−1 )
Arsenic
0–10
Antimony 0–30
Selenium 0–30
a
Calibration equation
R2 (n = 6)
y = 0.3516x + 0.0557 0.9981
y = 0.1173x − 0.0008 0.9997
y = 0.1055x − 0.0307 0.9964
y: integrated absorbance, x: concentration in g l−1 .
3.4. Precision
The precision of the methods was tested using
one-way variance analysis. The determinations were
performed according to the arrangement in Fig. 4.
The concentrations of As, Sb and Se in the samples
were between 0.5 and 0.8 g l−1 . In the determination
of As the samples prepared contained 800 mg Fe l−1 .
In the determination of Sb and Se the iron content of
the samples was 2500 mg l−1 .
The total variance of the results was composed of
the residual variance and the influence of the day on
2 = s 2 + s 2 ).
which the measurement was made (stot
res
day
A one-way F-test was used to test if the two variances
differed significantly from each other [21]. According
to the F-tests, the variance arising from the measure2 ) appeared to be significantly greater
ment day (sday
than the variance of the residual error for arsenic and
selenium (Table 9). Considering the low concentrations of the element determined it was concluded that
the precisions obtained (2–4% relative standard deviation, R.S.D.) were excellent.
3.5. Reproducibility
The reproducibilities of the methods when carried out by more than one analyst were evaluated
Table 7
Detection limits (blank +3σ ) and quantitation limits (blank +10σ )
in aqueous solutions for As, Sb and Se
Element
Limit of detection
(g l−1 )
Limit of quantitation
(g l−1 )
Arsenic
Antimony
Selenium
0.037
0.121
0.131
0.089
0.256
0.291
Fig. 4. Experimental arrangement used in the determination method
precision.
236
T. Näykki et al. / Analytica Chimica Acta 439 (2001) 229–238
Table 9
F-test values, the variance components and the precisions for As, Sb and Se using the experimental arrangement in Fig. 4
Element
As
Sb
Se
a
Mean (n = 25)
(g l−1 )
Variance of residual
2 )
errors (sres
Variance of
2 )
days (sday
0.776
0.541
0.491
1.291 × 10⁻⁴
5.103 × 10⁻⁴
1.334 × 10⁻⁴
2.701 × 10⁻⁴
4.152 × 10⁻⁵
7.487 × 10⁻⁵
Precision
F-test (MSdays /Msres )
g l−1
R.S.D. (%)
Fcalc
Ftheor (4, 20)a
0.020
0.023
0.014
2.6
4.4
2.9
11.46
1.41
3.81
2.87
2.87
2.87
Degrees of freedom (numerator, denominator).
Table 10
F-test values for As, Sb and Se using the experimental arrangement
in Fig. 5
Element
As
Sb
Se
a
Fig. 5. Experimental arrangement used in determination of reproducibility.
according to Fig. 5. The total variance of the results
is composed of the residual variance, the influence
of the day of measurement and the influence of the
2 = s 2 + s 2 + s 2 ). According to F-tests
analyst (stot
res
ana
day
(Table 10), the variance arising from the measurement day was significantly greater than the variance
of the residual error only for arsenic. The effect of the
analyst was insignificant. For antimony and selenium,
the only significant source of deviation was found to
be the residual errors. Thus, the total variance of the
determinations equaled that of the residual error. The
F-test (MSdays /MSres )
Fcalc
Ftheor (2,
29.48
0.08
1.10
3.63
3.63
3.63
16)a
F-test (MSanalyst /MSdays )
Fcalc
Ftheor (1, 2)a
5.3 × 10⁻⁴
2.49
0.47
18.51
18.51
18.51
Degrees of freedom (numerator, denominator).
variance components and the reproducibilities for As,
Sb and Se are presented in Table 11. The discrepancies
observed in the results were obviously due to the small
number of measurement days and analysts (two).
3.6. Accuracy
The accuracies of the methods were tested using
the standard reference materials SRM 361 Low-alloy
Steel and Buffalo Rivel Sediment SRM 2704. Three
replicates were prepared for all determinations and 5–8
successive atomizations were performed from each
sample. The certified and measured concentrations are
shown in Table 12. The results obtained are in good
agreement with the certified values.
Table 11
The variance components and the overall reproducibilities for As, Sb and Se using the experimental arrangement presented in Fig. 5
Element
As
Sb
Se
Mean value(n = 20)
0.774
0.542
0.493
a
ins.: insignificant.
Variance of residual errors
Variance of days
Variance of analysts
Reproducibility
2 )
(sres
2 )
(sday
2 )
(sana
g l−1
R.S.D. (%)
ins.a
0.032
0.023
0.016
4.2
4.3
3.3
10−4
1.576 ×
5.360 × 10−4
2.639 ×·10−4
8.974 ×
ins.
ins.
10−4
ins.
ins.
T. Näykki et al. / Analytica Chimica Acta 439 (2001) 229–238
237
Table 12
Analytical results of SRMs (mg kg−1 ). Mean ± 95% confidence limits
SRM
2704
361
a
Matrix
Sediment
LA Steel
Arsenic
Antimony
Selenium
Certified value
Found
Certified value
Found
Certified value
Found
23.4 ± 0.8
170 ± 10
22.8 ± 0.7
176 ± 5.8
3.79 ± 0.15
42 ± 1
3.77 ± 0.32
40.3 ± 1.4
1.12 ± 0.05
40a
1.09 ± 0.06
29.9 ± 2.4
Value uncertified.
Table 13
Limits for As, Sb and Se laid down by CEN for type 1 (highest
purity) iron chloride sulfate solutions
Element
Limits for FeClSO4 mg kg−1 Fe(III)
Arsenic
Antimony
Selenium
1.0
1.0
10.0
3.7. Contents of antimony, arsenic and selenium in
PIX-110TM
The methods developed were used to measure the
As, Sb and Se concentrations in the PIX-110TM .
The concentration of arsenic in the diluted sample
(1 ml/225 ml) was higher than the limit of quantitation, and the arsenic content of 52 g l−1 was obtained
(0.29 mg kg−1 Fe(III); calculated using a PIX-110TM
density of 1.5 g ml−1 and Fe(III) content of 12 wt.%).
The measured concentrations for antimony and selenium in diluted samples (1 ml/72 ml) were lower than
the limits of quantitation, so it was concluded that
results for selenium were <0.12 mg kg−1 Fe(III) and
for antimony <0.10 mg kg−1 Fe(III).
The European Committee for Standardization
(CEN) has laid down certain limits for toxic substances in different types of iron chloride sulfate
solutions used for the treatment of water intended for
human consumption. The measured arsenic, antimony
and selenium concentrations in PIX-110TM were
lower than the limits shown in Table 13 and therefore
it fulfills the requirements for a type 1 (chemical of
highest purity) iron chloride sulfate solution [22].
4. Conclusions
KI–ascorbic acid was found to be the most effective prereductant/masking agent for As and Sb
interference when the iron content was very high.
The use of thiourea or l-cysteine did not prevent
the signal depression caused by high iron content.
KI–ascorbic acid eliminated iron interference even
up to 2500 mg Fe l−1 . The FI-HG system used was
found to be very sensitive and the samples could be
diluted more than with the batch type hydride generation system used earlier. The absence of the memory
effects also showed the excellent performance of the
FI-system.
The methods developed for As, Sb and Se are rapid,
sensitive and can be used in routine analysis of samples containing high iron concentrations. The results
obtained for the standard reference materials showed
that the methods are accurate when very low analyte
levels are measured in high iron matrix concentrations.
Acknowledgements
The corresponding author is grateful to Kemira
Chemicals Oy for financial support for this work.
References
[1] G.F. Kirkbright, M. Taddia, Anal. Chim. Acta 100 (1978)
145.
[2] B. Welz, M. Melcher, Analyst 109 (1984) 569.
[3] B. Welz, M. Schubert-Jacobs, J. Anal. At. Spectrom. 1 (1986)
23.
[4] D. Bax, J. Agterdenbos, E. Worrell, J.B. Kolmer, Spectrochim.
Acta 43B (1988) 1349.
[5] R. Bye, Talanta 33 (1986) 705.
[6] E. Lugowska, I.D. Brindle, Analyst 122 (1997) 1559.
[7] Narsito, J. Agterdenbos, D. Bax, Anal. Chim. Acta 244 (1991)
129.
[8] T. Wickström, W. Lund, R. Bye, J. Anal. At. Spectrom. 10
(1995) 803.
[9] C. Boampong, I.D. Brindle, X. Le, L. Pidwerbesky, C.M.C.
Ponzoni, Anal. Chem. 60 (1988) 1185.
238
[10]
[11]
[12]
[13]
[14]
[15]
T. Näykki et al. / Analytica Chimica Acta 439 (2001) 229–238
B. Welz, M. Sucmanova, Analyst 118 (1993) 1425.
H. Chen, I.D. Brindle, S. Zheng, Analyst 117 (1992) 1603.
B. Welz, M. Melcher, Analyst 109 (1984) 577.
R. Bye, Anal. Chim. Acta 192 (1987) 115.
D.D. Siemer, L. Hagemann, Anal. Lett. 8 (1975) 323.
M. Yamamoto, M. Yasuda, Y. Yamamoto, Anal. Chem. 57
(1985) 1382.
[16] European Committee for Standardization, Chemicals Used
for Treatment of Water Intended for Human Consumption —
Iron(III) Chloride Sulfate, prEN 891, 1988, p. 8.
[17]
[18]
[19]
[20]
A.B. Umetri, P.O. Box 7960, S-90719 Umeå, Sweden.
H. Uggerud, W. Lund, J. Anal. At. Spectrom. 10 (1995) 405.
V. Krivan, J. Anal. At. Spectrom. 7 (1992) 155.
V. Krivan, K. Patrick, B. Welz, M. Melcher, Anal. Chem. 57
(1985) 1703.
[21] D.L. Massart, B.G.M. Vandeginste, S.N. Deming, Y. Michotte,
L. Kaufman, Chemometrics: A Textbook, 1st Edition,
Elsevier, Amsterdam, 1988, pp. 59–74.
[22] R. Nilsson, Vesitippa, Publication of Kemira Chemicals Oy
Kemwater 12 (2) (1996).