Are indian stock markets driven more by sentiment or fundamentals
Bạn đang xem bản rút gọn của tài liệu. Xem và tải ngay bản đầy đủ của tài liệu tại đây (1.91 MB, 124 trang )
MBA FINANCE
Are Indian Stock Markets Driven
more by Sentiment or
Fundamentals?
A Case Study Based on Relationship
Between Investor Sentiment and Stock
Market Volatility in Indian Markets
Himanshu Labroo
Student ID: 1749671
8/1/2013
A Thesis presented to Dublin Business School and Liverpool John
Moores University in partial fulfillment of the requirements for the
award degree of Masters of Business Administration in Finance under
the supervision of Mr. Michael Kealy.
Table of Contents
List Of Tables/Illustrations: .................................................................................................................... 5
1)
Figure 1.1: Factors Influencing Stock Prices..................................................Error! Bookmark not defined
Acknowledgements ................................................................................................................................. 7
Chapter 1: Introduction .......................................................................................................................... 9
1.1 Introduction ................................................................................................................................ 10
1.2 Investor Sentiment and Stock Market Volatility ......................................................................... 10
1.3 Efficient Market Hypothesis ........................................................................................................ 11
1.4 The Indian Stock Market ............................................................................................................. 12
1.5 Objectives of This Research ....................................................................................................... 14
1.6 Research Structure ...................................................................................................................... 15
1.7 Recipients of the research .......................................................................................................... 16
1.8 Scope and Limitations to the research ....................................................................................... 16
Chapter 2: Literature Review: ............................................................................................................... 18
2.1 Literature Review ........................................................................................................................ 19
2.2 Investor sentiment and the World.............................................................................................. 19
2.3 The Impact of investor sentiment ............................................................................................... 20
2.4 Classical Finance and Investor Sentiment ................................................................................... 21
2.5 Arguments against Classical Finance Theory .............................................................................. 22
2.6 Behavioral Finance ...................................................................................................................... 24
2.7 Studies taken up on the Subject of Behavioral Finance.............................................................. 26
2.8 Terrorist activities and Investor Sentiments ............................................................................... 31
2.9 Impact of Oil Prices ..................................................................................................................... 32
2.10 Volatility .................................................................................................................................... 33
2.11 Conclusion on Literature Review .............................................................................................. 36
Chapter 3: Research Methods and Methodology ................................................................................. 37
3.1 Introduction ................................................................................................................................ 38
3.2 The Research Philosophy ............................................................................................................ 40
3.3 The Approach Layer .................................................................................................................... 41
3.4 Research Strategy ....................................................................................................................... 43
3.5 The Choices Layer ....................................................................................................................... 45
3.6 Time Horizons Layer .................................................................................................................... 47
3.7 Data Collection and Data Analysis .............................................................................................. 47
2
3.7.1 Secondary data collection .................................................................................................... 48
3.7.2 Primary Quantitative Data Collection .................................................................................. 48
3.8 Data Analysis ............................................................................................................................... 49
3.8.1 Population and Sample ........................................................................................................ 49
3.8.2 Ethical issues in data collection ........................................................................................... 50
Chapter 4: Data Analysis and Findings .................................................................................................. 52
4.1 An Overview ................................................................................................................................ 53
Global Events ................................................................................................................................ 53
Human Nature............................................................................................................................... 53
Market Scandals ............................................................................................................................ 53
Trends ........................................................................................................................................... 54
4.2 Analysis of Quantitative Data...................................................................................................... 55
4.2.1 Questionnaire for Sentiment of Investors and Further Details .......................................... 55
6) How would you rate the effect that the increase in crude oil prices globally had on
your stock market sentiment? (rate- 1 being “not at all” and 5 being “ greatly” ) ..................... 61
7) How would you rate the effect that recent scams (Satyam, 2g, 3g) had on your
stock market sentiment? (rate- 1 being “not at all” and 5 being “ greatly” ) .............................. 62
8) How would you rate the effect that Mumbai terror attacks of 2008 had on your
stock market sentiment? ( rate- 1 being “not at all” and 5 being “ greatly” ) ............................. 63
9) How would you rate the effect that the ever increasing inflation has had on your
stock market sentiment? ( rate- 1 being “not at all” and 5 being “ greatly” ) ............................. 64
4.3 Analysis of Secondary Quantitative data .................................................................................... 67
4.3.1 Volatility of BSE-Sensex from 2008-2012............................................................................. 67
4.3.2 OVERVIEW OF BACSI ............................................................................................................ 68
Impact due to Fluctuations Oil Prices ........................................................................................... 71
Impact Due to Global Recession ................................................................................................... 74
Impact due to terror attack........................................................................................................... 76
Impact due to Financial Scandal: .................................................................................................. 79
Satyam Scandal: ............................................................................................................................ 80
RESULTS FOR PEARSONS CORRELATION........................................................................................... 83
Correlation between average daily return and investor sentiment ................................................ 83
Correlation between stock market volatility and average daily returns ........................................ 85
Chapter 5: Conclusion ........................................................................................................................... 87
5.1 Introduction ................................................................................................................................ 88
3
5.2.1 Conclusion on Objective 1: To ascertain the attitudes and sentiments of the
investors in India in the current scenario as well as in the recent past........................................ 88
5.2.2 Conclusion to objective 2 and 3: To examine if there is any relationship between the
important events and Investor Sentiment and to examine if there is any relationship
between the important events and the Stock Market Volatility. ..................................................... 90
5.2.3 Research Objective 4: To examine the relationship between investor sentiment and
the stock market volatility in India taking the important events into consideration. ...................... 92
5.3 Conclusion on the research question ......................................................................................... 92
Chapter 6: Self Reflection on Own Learning & Performance................................................................ 93
6.1 Introduction ................................................................................................................................ 94
6.2 My personality Type.................................................................................................................... 94
6.3 Learning Styles ............................................................................................................................ 95
6.3 Skills acquired during the learning process ................................................................................ 97
6.4 My Learning Style Preference ..................................................................................................... 99
6.5 Conclusion ................................................................................................................................. 101
References and Bibliography .............................................................................................................. 102
Appendices .......................................................................................................................................... 111
Appendix -1 ......................................................................................................................................... 112
Appendix-2 .......................................................................................................................................... 114
Appendix 3 .......................................................................................................................................... 116
4
List of Tables/Illustrations:
1) Figure1.1 1 Factors Influencing Stock Prices..............................................14
2) Figure2.1 1: The Sentiment Seesaw by M Baker & J Wurgler (2006)……27
3) 3.1 1 The Research Onion..............................................................................38
4) 3.1 2 Table for Research Strategy..................................................................44
5) 4.1 1 Agree or Disagree? “Now is a good time to invest”.............................55
6) 4.1 2 Current sentiment about the stock market?.........................................56
7) 4.1 3: Outlook for the next financial year.....................................................57
8) 4.1 4; Tolerance for Investment risk?...........................................................58
9) 4.1 5: Impact of the Global recession of 2008..............................................59
10) 4.1 6: The Impact of global crude oil prices.................................................60
11) 4.17: The impact of financial Scandal..........................................................61
12) 4.1 8: The effect of 2008 Terror Attack.........................................................62
13) 4.1 9: The Impact of Inflation.......................................................................62
14) 4.1 10: The impact of Budget Announcement.............................................63
15) 4.1 11: Impact of Government Change........................................................64
16) 4.1 12: Volatility of Bombay Stock Exchange from 2008-2012..................67
17) 4.1 13: Consumer index of India................................................................. 68
18) 4.1 14: Investor sentiments during the period 2008-2011.......................... 69
19) 4.1 15: Result of T-Test on oil Prices...........................................................70
20) 4.1 16: Result of T-Test on impact due to Global recession........................73
21) 4.1 17: Result of T-Test on Impact due to Terror Attack............................76
22) 4.1 18: Result Of a T-Test on Impact due to a Financial Scandal.............80
23) 4.1 19:Correlation between average return and investor sentiment.......83
24) 4.1 20:Correlation between stock market volatility and Average Return...84
25) 4.1 21 Correlation Between Stock market Volatility and
Investor Sentiments......................................................................................85
26) 6.1 1: Honey & Mumford Learning Cycle………………………………..95
5
27) 6.1 2 The Honey and Mumford Learning Styles cycle...............................98
28) 6.1 3: Pragmatists and Activists.................................................................99
6
Acknowledgements
I would like to thank my research supervisor – Mr. Michael Kealy for his guidance
and valuable advice throughout this dissertation process. His support was greatly
appreciated throughout.
I would like to thank all the individuals who participated in the research surveys
giving their time and expertise. The contributions that were made proved to be very
valuable in conducting this research study.
I would like to thanks to all my lecturers. The knowledge they have shared with me
has furthered my education greatly. I have learned a great deal over the year and their
advice has been invaluable
Finally, I would also like to thank my friends and family. They were a great help to
me during this process. The support they provided was ongoing for which I am deeply
grateful.
7
Abstract
The aim of the research paper is to examine the relationship between investor
sentiment and stock market volatility in the context of Indian stock market. There is
much research into the relationship between the two but very rarely taking India as a
case, being the tenth largest economy of the world. Moreover, there has been scant
research done on impact of political and economic events on investor sentiment and
the stock markets. There is very little research determining if the events do make an
impact on the sentiment of investor.
The research is based on taking four events into consideration over a period of five
years (2008-2012) for investors. Simultaneously, the stock market volatility has also
been studied for the same period of time of the BSE-Sensex (Bombay Stock
Exchange- Sensitive Index). The events are Global Recession of 2008, Mumbai
Terror Attack in 2008, the major Indian IT company Satyam Computer Systems scam
and the fluctuations in Global oil prices after the Middle East crisis.
The data of volatility, sentiments and average daily returns have been collected from
various sources like BSE for the same period. To find the impact of each situation on
the average daily returns, investor sentiments and volatility, SPSS was incorporated.
Adding to this, a survey was also carried out through questionnaires distributed to
investors to find the sentiments during that period and currently. To strengthen the
research, various financial journals and literature on the subject were reviewed.
The research found while the Satyam scam had an impact on the average daily
returns, it didn’t have a significant impact on the stock market volatility. Interestingly
it showed that it had a very significant impact on the investors. For oil prices, research
showed that the Egyptian turmoil didn’t have a significant impact on the average daily
returns but it had a significant impact on the volatility as well as the investor
sentiment which has been vindicated by the survey. Also, the Global Recession had
very significant impact on all the factors viz. the daily returns, volatility and the
sentiment. On Terror Attacks, the research showed that while there was not a
significant impact on the stock market volatility but impact on the daily returns and
investor sentiment was substantial.
8
Chapter 1: Introduction
9
1.1 Introduction
Financial professionals know very well the fact investors psychology impacts the
financial markets. The investor’s mood and its influence on the market movements is
regularly discussed in various financial periodicals, on television, internet and radio.
As pointed out by Daniel Kahneman in a speech titled "Psychology and Market" at
North-Western University in 2000: "If you listen to financial analysts on the radio or
on TV, you quickly learn that the market has a psychology. Indeed, it has character. It
has thoughts, beliefs, moods, and sometimes stormy emotions."
"Are Indian Stock Markets driven more by Sentiments than Fundamentals ". This
inquisitiveness led the researcher to take up the research. This research project is the
quest to find an answer to this question which perhaps affects & intrigues every
probable investor or trader in the Indian Stock Market. More importantly, this project
examines the impact of various important events which have occurred in the last five
years that might have had an impact on the investor sentiments and the volatility of
the stock market and whether both these aspects are related to each other.
1.2 Investor Sentiment and Stock Market Volatility
While some researchers may refer to investor sentiment as a propensity to trade on
noise rather than information, the same term is used colloquially to refer to investor
optimism or pessimism. On the other hand, Volatility is a symptom of a highly liquid
stock market. Pricing of securities depends on volatility of each asset. Volatility is the
variability of the asset price changes over a particular period of time and it’s very
tough to predict it consistently and correctly. In financial markets volatility presents a
strange paradox to the market participants, academicians and policy makers. Without
volatility superior returns cannot be earned, since a risk free security offers poor
returns. But if it is high, it will lead to losses for the market participants and represents
costs to the overall economy. An increase in stock market volatility brings a large
stock price change of advances or declines. Investors may interpret a raise in stock
10
market volatility as an increase in the risk of equity investment and consequently they
shift their funds to less risky assets.
To many among the general public, the term volatility is simply synonymous with
risk: in their view high volatility is to be deplored, because it means that security
values are not dependable and the capital markets are not functioning as well as they
should. Merton Miller (1991) the winner of the 1990 Nobel Prize in economics writes in his book Financial Innovation and Market Volatility …. “By volatility public
seems to mean days when large market movements, particularly down moves, occur.
These precipitous market wide price drops cannot always be traced to a specific news
event. Nor should this lack of smoking gun be seen as in any way anomalous in
market for assets like common stock whose value depends on subjective judgment
about cash flow and resale prices in highly uncertain future. The public takes a more
deterministic view of stock prices; if the market crashes, there must be a specific
reason”.
1.3 Efficient Market Hypothesis
This is an investment theory which states that it is impossible to predict the market
because the stock market efficiency causes existing share prices to always incorporate
and reflect all relevant information. According to the hypothesis, the stocks always
trade at their fair value on stock exchanges, making it impossible for investors to
either purchase undervalued stocks or sell stocks for inflated prices. Thus it would be
impossible to outperform the overall market through expert stock selection and/or
market timing and the only way to gain returns is by purchasing riskier investments.
The Efficient Market Hypothesis claimed the rationale that fundamentals determine
the market trends and that the market has 100% informational efficiency. This
Hypothesis however came under severe criticism after the Wall Street Crisis of 1987.
Investors & Analysts also suggested that actually there are certain Cognitive Biases
that affect the stock prices. This school of thought, known as "Behavioral Finance",
seemed even more authentic at times when the context was India. History is replete
with instances when a high impact News elicited a knee jerk reaction from the
11
investors leading to a slew of purchasing or selling decisions thereby affecting stock
prices in an unexpected manner. However there were also instances where market
fundamentals seemed to totally override any sort of emotional or sentimental wave.
1.4 The Indian Stock Market
With over 20 million shareholders and over 10,000 listed companies on all the stock
exchanges, India has the third largest investor base in the world after United States of
America and Japan. The Indian stock markets are serviced by 9400 stock brokers
approximately. Foreign brokers account for 29 of these. Any market that has
experienced this sort of growth has an equally substantial demand for highly efficient
settlement procedures. In India 99.9% of the trades, according to the National
Securities Depository, are settled in dematerialized form in a T+2 rolling settlement
the capital market is one environment.
Indian stock markets, in the recent years, have sharply risen on the back of improving
macroeconomic fundamentals and large inflow of foreign money. Large foreign
investments have brought greater transparency and liquidity into the Indian market.
India entered the International Financial Markets to mobilize resource towards the end
of the 1970s around the time of the launch of Fourth Five Year Plan. The Indian Stock
Markets are in a way the engines which drive the vehicle of our democracy by
pumping in the much needed capital. Their behavior and trends have intrigued many a
scholar, many an analyst and many an investor. As time evolved, scholars and
intellectuals propounded various theories and came up with different propositions
with respect to the Stock Markets.
While the US remains the largest of the financial markets; the euro zone has emerged
as a financial powerhouse indeed. The euro zone, U.K. and U.S. account for some
80% of all cross border capital flows. In contrast, Japan is strikingly isolated; its
capital flows are smaller than China although china’s stock of financial assets is only
one –quarter of the size of Japan’s. The underlying force for integration is that people
want freedom to make economic decisions and to access different forms of finance,
12
risk
management
techniques
and
investment
and
portfolio
diversification
opportunities. In a country like India where the stock market is undergoing significant
transformation with the liberalization measures, there are also concerns regarding its
exposure to risk in case of global/regional crises i.e. need to know how far contagion
can affect the Indian stock market in a more and more globally integrated
environment. The degree of financial openness is an empirical question which needs
to be resolved and if policy makers are to know the structure of their economies and
implement policies that will be effective in achieving their aims. The Indian capital
market has been experiencing a process of structural transformation in that the
operations in the Indian capital market are being conducted on the standard equivalent
to those in the international developed markets.
The Indian Capital Markets are mainly affected by two E’s –
1. Earnings/Price Ratio – It is an important factor affecting the stock price of a
company. It gives us a fair idea of company’s share price when it is compared to its
earnings. The stock becomes undervalued if the price of the share is much lower than
the earnings of a company. But if this is the case, then it has the potential to rise in the
near future. The stock becomes overvalued if the price is much higher than the actual
earning of the company.
2. Emotions/ Sentiments - They are a huge part of investing. Was it the case that only
earnings drove the Indian Sensex to a high of 21,000 points in January 2008 and a low
of 8700 points in October 2008? Not really. Emotions played a big part in both the
rise and fall of the Sensex. When we get positive news about a company, it increases
the buying interest in the market. On the other hand, when there is a negative press
release, it ruins the prospect of a stock to increase in value.
13
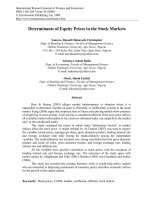
Stock Price Factors
Figure 1.1 2 Factors Influencing Stock Prices
It has been noted that investors show sensitivity to reference points. When a certain
stock price falls because of some disappointing news, many investors are averse to
selling it at a loss. Here the reference point is the original cost of purchase. Investors
have a tendency to hold on to their losses. But some investors wait in anticipation that
the stock price would return to their purchase price before they decide to sell it
without rationally evaluating the situation. It can be said in other words that the
investors generally “hate to lose”.
1.5 Objectives of This Research
In order to understand the main research question, the researcher will conduct
fundamental research which will address the following objectives.
1. To ascertain the attitudes and sentiments of the investors in India in the current
scenario as well as in the recent past
14
2. To examine if there is any relationship between the important events and
investor sentiments
3. To examine and ascertain the relationship between various important events
and stock market volatility.
4. To examine the relationship between investor sentiment and the stock market
volatility in India taking the important events into consideration.
1.6 Research Structure
The layout of this dissertation begins with chapter one, the introduction which is here.
This outlines the background of the research, approach to the research question, the
research objectives and the overall flow of the dissertation.
Chapter two examines the academic literature in the area of investor sentiment and
stock market volatility. It also throws light on the various literatures available on
Behavioral Finance as this subject area under which the research has been taken up. A
review of literature was undertaken with over seven main headings starting from
Investor sentiment and the world to importance of behavioral finance to impact of
terrorism on investor sentiments to studies on some of investor proxies and moods.
Chapter three talks about the research methodology which provides details of the
research approach followed, the data collection method used, the type of analysis
being performed and the population used.
Chapter four, this is the section where the data analysis is done and the findings of
this research are highlighted and discussed.
Chapter five is the conclusion section. This is where conclusions are made based on
the findings from chapter four. Also summations are based on literature review.
Recommendations are also made in this section.
Chapter six is the self-reflective learning section which reflects on the learning that
has occurred during the research process. This section will include reference to
specific events which served process for learning out of this dissertation.
15
Resources such as the questionnaire used and various other sources are included in the
Appendix.
1.7 Recipients of the research
A number of studies have been done in other countries but there has been no
comprehensive study concerning Investor sentiment in India. Moreover, the study of
this nature should be conducted at periodical intervals, the reason being that the
investors’ attitudes do change from time to time.
No studies have been carried out for the Indian stock markets in context of major
political event such as a terrorist attack. Though there have been studies carried out on
the impact of macro-economic events on the stock market substantially (Bennet et al.,
2011), major economic events such as worldwide fluctuations in the oil prices and
domestic financial scams and their impact on the stock market has not been
extensively studied in the recent past.
The intended audiences of this research are the investors (both institutional and retail)
of India, the Foreign Institutional Investors (FIIs) who are keen to invest in India, and
the various stock broker companies in India and around the world. This research can
be of interest to various professionals and students who want to pursue their carrier in
the area of Behavioral Finance. It aims to focus on the area of behavioral finance
which is an interesting and burgeoning subject in the contemporary world.
1.8 Scope and Limitations to the research
To demonstrate overall feel of the present mood and the past impact on the
sentiments, the researcher has carried out a survey on the investors in India with the
help of two investment banks. It’s about how they feel about the socio-economic
events and how it affects their sentiments. The events range from terrorism to rise in
16
oil price to the global recession which took place in 2008 and had engulfed major
European countries out of which a few of are still struggling to come out.
There were many practical issues concerning this research which needed to be
addressed before commencing. Firstly, in relation to the primary quantitative research,
due to confidentiality procedures of the two investment banks in India, it was not
possible to obtain the contact information of the investors. Moreover a few investors
have not even written up their names. The population size was 90. A larger size would
have been better however given the restrictions due to confidentiality and the ease of
access this was not possible.
17
Chapter 2: Literature Review:
18
2.1 Literature Review
Casual observation suggests that the content of news about the stock market could be
linked to investor psychology and sociology. However, it is unclear whether the
financial news media induces, amplifies, or simply reflects investors’ interpretations
of stock market performance (Tetlock, 2007).
2.2 Investor sentiment and the World
Defining Investor Sentiment: Investor sentiment can be defined as the feeling or tone
of a market (i.e. crowd psychology). It is shown by the activity and price movement
of securities. While some researchers may refer to investor sentiment as a propensity
to trade on noise rather than information, the same term is used colloquially to refer to
investor optimism or pessimism. The term sentiment also has connotations with
emotions, so the media may refer to it as investor fear or risk-aversion. For example,
rising prices would indicate a bullish market sentiment. A bearish market sentiment
would be indicated by falling prices. Although they do not find a statistically or
economically significant effect of “bullish” messages on returns, Antweiler and Frank
(2004) do find evidence of relationships between message activity and trading volume
and message activity and return volatility. Similarly, Coval and Shumway (2001)
establish that the ambient noise level in a futures pit is linked to volume, volatility,
and depth—but not returns.
Malcolm Baker (2007) studied that, the question is no longer, as it were a few decades
ago, whether investor sentiment affects stock prices, but rather how to measure
investor sentiment and quantify its effects. In particular, stocks of low capitalization,
younger, unprofitable, high volatility, non-dividend paying, growth companies, or
stocks of firms in financial distress, are likely to be disproportionately sensitive to
broad waves of investor sentiment. The question whether investor sentiment has an
impact on stock prices is of foremost importance because investor sentiment can lead
19
to market bubbles followed by massive devaluations,
Brown and Cliff (2004)
explained.
Finter, Niessen-Ruenzi, Ruenzi, in 2011, proposed that the real estate bubble crash in
2008, which happened to take place in the United States and had a grip on the whole
world later on, underlines the severe consequence of investor sentiment on asset
prices. Most of the papers on sentiment focus on the U.S. stock market and rely on the
notion that it is mainly retail investors who are affected by sentiment waves and who
cause stock prices to drift away from their fundamental values (Kumar and Lee
(2006)). These papers implicitly take into account that institutional investors are more
rational in their trading behavior whereas retail investors are responsible for the
impact of sentiment on markets. Therefore, it is important to test the robustness of
findings from the U.S. market for other markets that are characterized, for example,
by a different demographics and composition of the investor population. This is the
gap which is prevalent in the various researches done till date on this subject.
There have been a very few researches done on the Indian Stock market related to the
same issue of the investor sentiments and the resulting effect on volatility. Also, to
check the various effects of various events which might or might not affect both, there
have been very few of the evidences put forward concerning the Indian market. A
different composition and demographic would change the whole scenario of the
relationship between the investor sentiments and stock market volatility. This would
in-turn give a better understanding and scope for further researches and analysis on
the researches done in the future. Thus, this project will be an attempt to fill the gap
mentioned above.
2.3 The Impact of investor sentiment
The impact of investor sentiment on the returns of equities has been empirically
tested. Many studies suggest that sentiment does influence asset prices (Lee, Shleifer,
and Thaler, 1991; Lee et al., 2002; Brown and Cliff, 2005; Baker and Wurgler, 2007;
Ho and Hung, 2009; Baker, Wurgler, and Yuan, 2009). These studies find a positive
contemporaneous relationship between investor sentiment and stock market returns.
20
Furthermore, the research also studies how stock market volatility is impacted by
investor sentiment (Brown, 1999; Lee et al., 2002). The results of these studies show
that investor sentiment and stock market volatility are correlated.
An exogenous shock in investor sentiment can lead to a chain of events, and the shock
itself could in principle be observed at any or every part of this chain. It will show up
in investor beliefs, which will be surveyed. These beliefs might then translate to
observable patterns of securities trades, which are recorded.
2.4 Classical Finance and Investor Sentiment
In classical finance, there is typically no room for the presence of investor sentiment.
Such theories have mostly ignored or assumed away investor sentiment, arguing that
in the highly competitive financial market, suboptimal trading behaviors such as
paying attention to signals unrelated to fundamental value will be quickly eliminated.
In short, classical finance revolves around two basic premises, that when taken
together implies the lack of prolonged arbitrage opportunities
a) Financial markets are information efficient.
b) Market participants are rational
First, the cornerstone of modern financial economics, the Efficient Markets
Hypothesis, maintains that asset prices should reflect all available information about
the fundamental value of the underlying security. Assuming no frictions, the price of a
security should equal its fundamental value, defined as the discounted sum of future
cash flows. Mathematically, this means that the price Pt of a particular stock or
portfolio equals the expected forecast
(P*t+1) times of subsequent cash flows and investment risks, conditional on all
information available at the current time period. This can be stated concisely as:
Pt = Et [P*t+1jIt]…………………………………………………………(1)
21
Hence, the Efficient Markets Hypothesis says price equals the optimal forecast of it.
This implies that any surprising movements in the stock market must originate with
new information about the fundamental value P*t+1 (Fama 1965). From this, it then
follows that fundamental value is comprised of a predicable component and an
unpredictable component:
P*t+1=Pt+ut………………………….…………………………………………… (2)
Here, ut represents the forecast error and must be uncorrelated with any information
available at time t; otherwise it would not be taking into account all available
information (Shiller 2003). Since the price Pt is also information, Pt and ut must also
be uncorrelated with each other.
2.5 Arguments against Classical Finance Theory
Consistent with the market efficiency paradigm is the presumption that individuals
behave rationally and fully take into account all available information in the decisionmaking process. Therefore, when there is new information about a security, rational
investors will quickly respond, leaving no room for excess risk-adjusted returns based
on the information signal. Through motivations of self-interest and the forces of
arbitrage, modern finance has traditionally assumed that irrational investors will be
quickly eliminated from the market, along with risk-free profit opportunities.
In real life financial markets however, there are limits to arbitrage. Trading costs,
including transaction costs, information costs, and financing costs may prevent
rational arbitrageurs from taking advantage of market mispricing. Since real life
financial markets are far from perfect, these frictions may make it difficult to find and
take advantage of a perfectly substitutable asset (Shleifer 2000).
However, even after taking into account fundamental risk and transaction costs,
standard financial theories still have a hard time explaining prolonged mispricing and
unexploited arbitrage opportunities. For example, financial puzzles such as the closedend fund discount and IPO under pricing are empirical observations that provide
evidence that markets may not always be informationaly efficient. To explain these
22
anomalies, one approach has been to appeal to behavioral explanations that relax the
strict rationality requirement of standard theories.
Baker and Wurgler, (2007) highlight that it has been increasingly difficult to explain
some financial events by traditional theory of finance. Such events include investors
subject to emotions who not always value asset prices as the net present value of its
discounted future cash flows. In this context sentiment can be defined as beliefs about
future cash flows and investment risks that are not rationally justifiable taking into
account the information available to the investor. Stock price volatility during crashes
defies the explanatory power of traditional financial models. The traditional models,
in which the investors without emotions force capital market prices to equal the
rational present value of expected future cash flows, have a substantial difficulty
explaining stock market volatility. Researchers in finance have thus been working on
to supplement the traditional models which can’t justify the crashes. Shiller (1987)
demonstrated that most investors interpreted the crash as the outcome of other
investors’ psychology rather than fundamental financial variables such as earnings or
interest rates.
Moreover market efficiency, in the sense that market prices reflect fundamental
market characteristics and that excess returns on the average are levelled out in the
long run, has been challenged by behavioral finance. There have been a number of
studies pointing to market anomalies that cannot be explained with the help of
standard financial theory, such as abnormal price movements in connection with
IPOs, mergers, stock splits and spin-offs. Throughout the 1980s and 1990s statistical
anomalies have continued to appear which suggests that the existing standard finance
models are, if not wrong, probably incomplete. Investors have been shown not to react
to new information but to be overconfident and to change their choices when given
superficial changes in the presentation of investment information (Olsen, 1998).
During the past few years there has, for example, been a media interest in technology
stocks. Most of the time, as we know in retrospect, there was a positive bias in media
assessments, which might have lead investors in making incorrect investment
decisions. So, these anomalies suggest that the principles which underlie concerning
rational behaviour are from the efficient market hypothesis and thus are not entirely
23
correct and it is needed to be looked at including other models of human behaviour as
have been studied in other forms of social sciences (Shiller, 1998).
2.6 Behavioral Finance
In particular, behavioral finance has been an increasingly fruitful branch of research
that, in short, takes account of deviations from perfect rationality and explores the
ways this may affect market outcomes, asset prices, and even the behavior of other
investors. With regards to investor sentiment, behavioral finance offers models that
are much more flexible about investor behavior
Barberis and Thaler, in their paper “A Survey of Behavioral Finance”
in 2003,
explained that the traditional finance paradigm, seeks to understand financial markets
using models in which agents are “rational”. Rationality means two things. First,
when they receive new information, agents update their beliefs correctly, in the
manner described by Bayes’ law1. Second, given their beliefs, agents make choices
that are normatively acceptable, in the sense that they are consistent with Savage’s
notion of Subjective Expected Utility (SEU)2.
They further go on and say that the traditional framework is appealingly simple, and it
would be very satisfying if its predictions were confirmed in the data. Unfortunately,
after years of effort, it has become clear that basic facts about the aggregate stock
1
Bayes' Theorem, published posthumously in the eighteenth century by Reverend Thomas Bayes,
says that you can use conditional probability to make predictions in reverse. Mathematically, Bayes'
theorem gives the relationship between the probabilities of A and B, P(A) and P(B), and the conditional
probabilities of A given B and B given A, P(A|B) and P(B|A).
Subjective expected utility is a method in decision theory in the presence of risk, promoted by L. J.
Savage in 1954 following previous work by Ramsey and von Neumann.The theory of subjective
expected utility combines two subjective concepts: first, a personal utility function, and second a
personal probability distribution (based on Bayesian probability theory).
2
24
market, the cross-section of average returns and individual trading behavior are not
easily understood in this framework.
According to them, Behavioral Finance is a new approach to financial markets that
has emerged, at least in part, in response to the difficulties faced by the traditional
paradigm. In broad terms, it argues that some financial phenomena can be better
understood using models in which some agents are not fully rational
More specifically, it analyzes what happens when we relax one, or both, of the two
tenets that underlie individual rationality. In some behavioral finance models, agents
fail to update their beliefs correctly. In other models, agents apply Bayes’ law
properly but make choices that are normatively questionable, in that they are
incompatible with SEU. It is important to note that most models of asset pricing use
the Rational Expectations Equilibrium framework (REE), which assumes not only
individual rationality but also consistent beliefs (Sargent, 1993). Consistent beliefs
means that agents’ beliefs are correct: the subjective distribution they use to forecast
future realizations of unknown variables is indeed the distribution that those
realizations are drawn from. This requires not only that agents process new
information correctly, but that they have enough information about the structure of the
economy to be able to figure out the correct distribution for the variables of interest.
Behavioral finance departs from REE 3 by relaxing the assumption of individual
rationality. An alternative departure is to retain individual rationality but to relax the
consistent beliefs assumption: while investors apply Bayes’ law correctly, they lack
the information required to know the actual distribution variables are drawn from.
This line of research is sometimes referred to as the literature on bounded rationality,
or on structural uncertainty. For example, a model in which investors do not know the
growth rate of an asset’s cash flows but learn it as best as they can from available
data, would fall into this class.
In particular, behavioral finance has been an increasingly fruitful branch of research
that, in short, takes account of deviations from perfect rationality and explores the
ways this may affect market outcomes, asset prices, and even the behavior of other
Rational expectations (RE) is a collection of assumptions regarding the manner in which economic
agents exploit available information to form their expectations. In its stronger forms,
RE operates as a coordination device that permits the construction of a “representative
agent" having “representative expectations”.
3
25