GWAS: Fast-forwarding gene identification and characterization in temperate Cereals: Lessons from Barley – A review
Bạn đang xem bản rút gọn của tài liệu. Xem và tải ngay bản đầy đủ của tài liệu tại đây (2.25 MB, 17 trang )
Journal of Advanced Research 22 (2020) 119–135
Contents lists available at ScienceDirect
Journal of Advanced Research
journal homepage: www.elsevier.com/locate/jare
GWAS: Fast-forwarding gene identification and characterization in
temperate Cereals: lessons from Barley – A review
Ahmad M. Alqudah a,⇑, Ahmed Sallam b, P. Stephen Baenziger c, Andreas Börner a
a
Resources Genetics and Reproduction, Department Genebank, Leibniz Institute of Plant Genetics and Crop Plant Research (IPK), Corrensstr. 3, OT Gatersleben, D-06466 Stadt
Seeland, Germany
b
Department of Genetics, Faculty of Agriculture, Assiut University, 71526- Assiut, Egypt
c
Department of Agronomy & Horticulture, University of Nebraska-Lincoln, 68583-Lincoln, NE, USA
g r a p h i c a l a b s t r a c t
a r t i c l e
i n f o
Article history:
Received 5 August 2019
Revised 7 October 2019
Accepted 31 October 2019
Available online 4 November 2019
Keywords:
Association mapping
Hordeum vulgare L
Gene identification
QTL mapping
Barley breeding, GWAS
a b s t r a c t
Understanding the genetic complexity of traits is an important objective of small grain temperate cereals
yield and adaptation improvements. Bi-parental quantitative trait loci (QTL) linkage mapping is a powerful method to identify genetic regions that co-segregate in the trait of interest within the research population. However, recently, association or linkage disequilibrium (LD) mapping using a genome-wide
association study (GWAS) became an approach for unraveling the molecular genetic basis underlying
the natural phenotypic variation. Many causative allele(s)/loci have been identified using the power of
this approach which had not been detected in QTL mapping populations. In barley (Hordeum vulgare
L.), GWAS has been successfully applied to define the causative allele(s)/loci which can be used in the
breeding crop for adaptation and yield improvement. This promising approach represents a tremendous
step forward in genetic analysis and undoubtedly proved it is a valuable tool in the identification of candidate genes. In this review, we describe the recently used approach for genetic analyses (linkage mapping or association mapping), and then provide the basic genetic and statistical concepts of GWAS, and
Peer review under responsibility of Cairo University.
⇑ Corresponding author.
E-mail addresses: , (A.M. Alqudah).
/>2090-1232/Ó 2019 The Authors. Published by Elsevier B.V. on behalf of Cairo University.
This is an open access article under the CC BY-NC-ND license ( />
120
A.M. Alqudah et al. / Journal of Advanced Research 22 (2020) 119–135
subsequently highlight the genetic discoveries using GWAS. The review explained how the candidate
gene(s) can be detected using state-of-art bioinformatic tools.
Ó 2019 The Authors. Published by Elsevier B.V. on behalf of Cairo University. This is an open access article
under the CC BY-NC-ND license ( />
Introduction
Natural variation is a valuable and sustainable resource of the
phenotypic and genetic diversity within plant species (e.g. barley,
Hordeum vulgare L.) worldwide that offer beneficial traits for plant
breeding. The phenotypic variation within-species caused by spontaneously natural genetic mutations that maintained in nature by
evolutionary, artificial and natural selection processes [1]. Natural
variation brought great advances to understand crop morphology
and their response to biotic and abiotic stresses. The understanding
of natural variation in crop plants through thousands of years for
domestication e.g. in barley about 10,000 years ago [2] can be seen
in the genetic modification of developmental traits and adaptive
features. Natural variation studies in wild species elucidated the
molecular basis of phenotypic differences related to domesticated
plant adaptation that is important to interpret the maintenance
and evolutionary significance of phenotypic variation [3]. For
instance, Six-rowed 1 (VRS1) and Non-brittle rachis 1 (btr1) or
Non-brittle rachis 2 (btr2) genes in barley have clear impact on
spike architecture phenotype as a consequence of domestication
[4,5]. During domestication, loss of function in VRS1 gene converted the two-rowed barley to six-rowed that increased the grain
number per spike and the deletions in Btr genes make non-brittle
rachis that improved grain retention. Analyses of natural variation
within wild and/or domesticated, cultivated plants diversity can
help to utilize the diverse resources for crop improvement efficiently and improve the knowledge of the genetic basis of cultivated crop improvement. Genetic analyses of natural quantitative
variation in crop plants were developed a few decades ago [1]. A
genebank provides a rich source of genetic variation that had been
greatly used to improve cultivars through incorporating the
desired alleles into breeding programs for increasing grain yield
and improving tolerance to abiotic and biotic stresses [6]. The
genetic bottlenecks that happened during domestication and modern breeding processes lead to a narrowing of the genetic variation
in cultivars that negatively affects productivity, adaptation and
yield sustainability [6].
Barley is grown in areas where other close relative cereal crops
like wheat (Triticum spp.) are poorly adapted and it is now cultivated in all temperate regions of the world. Therefore, barley
became a basic crop for human civilization and approximately
70% of production is used for animal feed, 20–25% malting, and
5–10% for food [7]. Presently, it is ranked as the fourth most important cereal crop in the world [8] while Europe and the Russian Federation produce 65% of global production. Being related to wheat
and with it is economic and agronomic importance, numerous
genetic and genomics studies in barley have been used as a model
crop for wheat. Barley’s research has dramatically expanded in the
last few decades with more than 25,000 publications since 1980
based on Web of ScienceTM. Barley has many features of a model
species. Since barley has over 400,000 accessions in gene banks
[9], it offers an excellent resource to efficiently exploit genetic
resources and their utility for breeding programs. In combination
with a new ordered high-quality reference genome sequence
assembly [10], barley became a crop with a much more tractable
genome. Consequently, barley remains an important model plant
that can be used to understand the genetic basis of adaptation to
various abiotic and biotic stresses (predicted with climate
change).
The recent advances in DNA sequencing paved the way to
genetically improve the important traits (grain quality, biotic and
biotic stress tolerance, etc). Next-generation sequencing (NGS)
e.g. genotyping-by-sequencing (GBS) provide thousands of single
nucleotide polymorphism (SNPs) covering the most genomic
region in barley chromosomes. Many powerful statistical genetics
methods were proposed to identify alleles controlling target traits.
Genome-wide association study (GWAS) is one of those useful
methods and it is successfully used to identify candidate genes
for many important traits in barley as it tests the association
between the marker type (e.g SNP) and the phenotype of a target
trait. There are many considerations and recommendations that
should be taken into account when geneticists decide to perform
GWAS. In the current review, we will discuss the advantages and
distances of GWAS, different methods for performing GWAS, and
a brief guide of interpreting GWAS results. We focused on barley
studies in our review as a excellent example of a crop that has a
significant genetic improvement due to the identification of many
useful QTLs and genes, that were used in marker-assisted selection,
using GWAS.
Genetic studies of complex traits
Forward genetics aims to screen the phenotype of many individuals that are genotypically different. Understanding the relationship between genetic polymorphism and the phenotypic
variation observed among individuals is one of the fundamental
interests. This basic relationship has been extensively studied since
Mendel demonstrated that this relationship is inherited. Revealing
the genetic factors underlying complex characters such as agronomically important traits like grain yield requires an understanding of allelic variation at a specific locus level that controls the
phenotype and the genetic architecture of a given trait. The variation of the plant phenotype is directly connected back to the
underlying causative loci using mapping approaches. To achieve
this goal, phenotypic and genotypic differences among the individuals are studied either using bi-parental QTL mapping populations
(linkage mapping) or association mapping populations (LD mapping) of unrelated individuals. Therefore, both mapping
approaches aim to identify molecular markers that are linked to
QTL.
These approaches became attractive and useful because they
utilize the advances in genome sequencing and high-quality and
density SNP arrays for many crops, including barley. Recently
through NGS, most of the populations are genotyped by either a
9 K iSelect Illumina Infinium array [11] that contains 7,842 genebased SNPs of which 6,094 SNPs have known physical positions
(the location of identifiable landmarks of SNP on the chromosome
which always measured in base pairs), or a 50 k Illumina Infinium
iSelect genotyping array contains 44,040 SNPs which represent
29,415 unique gene pseudomolecules annotations [12]. The 50 K
array increased the density of the high-quality markers i.e. a higher
number of SNPs (14,626 SNPs) compared with 4,570 SNPs in 9 K
[13]. The NGS offers an effective and relatively low-cost approach
to rapidly map the population using GBS. The GBS technique uses
restriction enzymes to reduce the complexity of DNA samples
and then produce high-quality polymorphism data [14]. Early use
of GBS found 1,596 SNPs [15], hence the 50 K chip provided better
coverage of the genome. Even though genotyping using SNP is
121
A.M. Alqudah et al. / Journal of Advanced Research 22 (2020) 119–135
Table 1
The main advantages and limitations of QTL mapping and GWAS mapping approach.
QTL mapping
GWAS mapping
Advantages
limitations
Advantages
limitations
Bi-parental crosses
Contrasting and crossable parents and
multiple generations required to develop
pedigrees
A limited number of genotypes based on the
success of crossing
Low allele richness
No parents or crossing
Population structure effect with
spurious relatedness
Unlimited number of contrasting
accessions
Assumes dense markers with high
allele richness
Large numbers of phenotypic
variation
Highly dense map
Higher resolution and tests at
marker positions
The high number of individuals are
required
Low allele frequency
Fewer markers required
Expecting the segregating trait(s)
More robust in heterogeneity
Less prone to false positives
Lower resolution based upon the number of
recombination
Narrower genetic base
Markers are usually sparse due to the
recombination
Tests between markers
extremely efficient and reliable, the GWAS performed over the past
decade explored some drawbacks that should be considered.
GWAS based on SNP relies on the pre-existing genetic variant reference that is used for sequencing and mapping the individuals.
Such specific design leads to missing pinpoint causal variants and
cannot detect most of the genetic signals or rare mutations of complex traits. Based on the Web of ScienceTM database, since 1991
around 1300 QTL studies using parental populations are listed
compared to only 90 GWAS publications in barley.
In the next sections, QTL mapping and GWAS methods will be
discussed with more focus on the GWAS method.
QTL mapping (linkage mapping)
The linkage or QTL mapping approach is commonly used to
identify genomic regions (QTL) controlling target traits. The
family-based mapping analysis depends upon the genetic recombination and segregation during the construction of mapping populations in the progenies of bi-parental crosses that consequently
affect the genetic mapping resolution and allele richness. QTL mapping has proved and remains a powerful approach to identify loci
that co-segregate with the trait of interest in the research population. This approach can be applied in different types of populations
e.g. F2 populations, double-haploid (DH) populations, backcross, or
recombinant inbred lines (RILs) families, using restriction fragment
length polymorphism (RFLP), amplified fragment length polymorphism (AFLP), microsatellite or simple sequence repeat (SSR), and
SNP markers.
QTL analysis has been widely applied in barley for the genetic
dissection of agronomic traits using genetic maps constructed from
RFLP markers [16,17] or applying other genetic maps using e.g.
SSRs [18]. QTL analysis for developmental and yield traits was carried out in DH and RIL mapping population using AFLP [19] while
SSR markers were used to detect QTL for physiological, biochemical, agronomic and yield traits in RIL population [20,21]. Recently,
SNP chip started to be used in QTL studies e.g. Huang et al. [22]
used them in a RIL population to discover QTL for agronomic traits
and fusarium head blight. GBS is also used for QTL analysis in RIL
that allowed them the detection of the Breviaristatum-e (ari-e)
locus [15].
Multiple environment trials (i.e. locations and/or years) for
studying complex traits are commonly used to assess the performance of genotypes across a range of environments, including
QTL Â environment interaction (QEI) to find important and broadly
adapted QTL. There are several studies focused on agronomic traits
such as heading date, thousand-grain weight (TGW) and plant
height in barley using this approach e.g. [23,24]. Many QTL studies
have been carried out to study the genetic factors underlying
Misleading natural variation
Low heritability value
Many more markers required
Type I or II error (false positive
association)
drought-related traits in barley, revealing that most of the detected
QTL control developmental and adaptive traits in addition to
drought tolerance. Rollins et al. [25] detected numerous QTL under
dryland conditions using SSR and diversity arrays technology
(DArT)-markers for constructing a genetic linkage map in the RIL
population. Using such a combination of markers, QTL analysis
demonstrated that heading date related-genes (in particular the
vernalization genes Vrn-H1 and Vrn-H2) had pleiotropic effects
on yield-related traits and biomass.
The major fundamental limitations in QTL mapping are that the
diversity of segregating alleles between the parents can be only
tested, and the mapping resolution solely relies on the number of
recombination events that occurs during the population development [26]. Developing pure lines (homozygous lines) for mapping
populations is time-consuming and results in a low resolution of
mapped QTL as an outcome of a low number of recombinations
caused by the few numbers of genotypes resulting in a narrow
genetic base with low allele richness (Table1). Through conventional breeding, six to eight generations of introgressions or selfing
are needed to form pure lines (homozygous lines) of RILs or nearisogenic lines (NILs) populations while two generations to form a
DH population with a lower chance of recombination rate events
than RIL population [27]. This may be due to the fact that DH lines
only go through one round of recombination while RILs, on the
other hand, go through many rounds of recombination. Homozygous lines can be also produced from F2 using a single seed descent
method where one seed is harvested from each F2 line and then
grown into an F3 and so on until F8 to F10 generations with high
levels of homozygosity at virtually all loci. Finally, the members
of a family-based mapping population will contain different
amounts of recombination among loci.
To avoid these limitations, improvement in the mapping resolution within the mapping population can be dramatically improved
by increasing the number of intercrosses using multiparent RILs
[28]. There are many positive features in using this approach. It
requires high-density markers in case of a high recombination rate
(RIL lines) for mapping QTL and to identify tightly linked markers.
It is also robust to understand the heterogeneity at the locus level.
Advanced molecular technologies e.g. GBS allowed for rapid and
cost-effective genotyping (hundred to thousands of markers) with
high allele richness that make QTL mapping robust and useful for
identifying the target region of complex traits.
Genome-wide association study (GWAS)
Association analysis using GWAS is a powerful tool being effectively and efficiently used for genome-phenotype associations and
causative loci/genes identification. The basic scenario in GWAS is
122
A.M. Alqudah et al. / Journal of Advanced Research 22 (2020) 119–135
to calculate the association between each marker and a phenotype
of interest that has been scored across unrelated lines/individuals
(unrelated individuals means distantly related and heterogeneous
individuals) of a diverse collection [29]. Robustness and effectiveness of GWAS in the dissection of complex traits in crops including
barley had been demonstrated and expected to become more efficient to identify the causative loci/gene(s) for quantitative traits
with a help of the currently available large populations and highthroughput sequencing technology. High-resolution mapping can
also be attributed to historical recombination events [30] and the
greater allele numbers that are incorporated in GWAS. In the association mapping populations, historical recombinations that accumulated over generations with historical Linkage Disequilibrium
(LD, over dozens/hundreds of generations) persist among the representative accessions and improved the resolution for association
analysis through the rapid decay of LD. Unlike association mapping
populations, family-based populations, particularly DH populations, having a limited number of recombination events will often
generate populations with relatively low mapping resolution and
wide recombination value for a pair of loci, hence a larger linkage
block that increases LD.
The application of sophisticated analytical approaches has
started to extend the utility of different genetic resources for
studying the natural variation that can be ultimately used in
improving the crop. This approach has been studied extensively
in humans and also started in plants since the beginning of this
century [31]. Early reports used this approach in plants were on
diverse maize (Zea mays L.) population [32] and Arabidopsis [33],
thereafter the approach was used in other crops and the number
of published reports increased, see the review by Rafalski [30]. In
barley, this approach started ten-years ago [34,35].
Recently, GWAS has become a key approach for mapping quantitative traits and studying the natural variation. GWAS with highdensity genotyping platforms provides enough marker density to
dissect the genetic architecture of traits of interest in barley.
Through screening large and diverse collections with ample
genetic marker density, GWAS can detect causal loci underlying
natural phenotypic variation. For instance, GWAS analysis using a
9 k SNPs chip from IlluminaTM [11], a gene-based chip providing
a high genetic resolution that can help to uncover novel alleles that
improve productivity and adaptation. In barley, the GWAS
approach will become more robust and informative using the
newly developed 50 k Illumina Infinium iSelect genotyping array
for barley [12].
Natural variation of phase transition especially heading date is
one of the critical traits that are highly associated with adaptation
and yield [36]. Understanding the natural variation of heading date
is important to increase our knowledge regarding the natural
diversity of other developmental traits such as leaf area, plant
height, tillering, grain number, or other agronomic traits [37–42].
The main objectives of performing GWAS are to identify causative factors for a given trait and/or to determine the genetic architecture of the trait. The number of loci underlying the phenotypic
variation of traits differs i.e. the trait can have a simple genetic
architecture with a low number of large-effect loci (e.g. barley spot
blotch) or a complex genetic architecture and controlled by many
loci (polygenetic e.g. heading date) [43].
Important factors affecting the power of GWAS
The power of GWAS to detect the true association is determined
by many factors which should be taken into account when geneticists and breeders perform GWAS for target traits, Table1 summarized the advantages and limitation of GWAS which are described
as follow:
First: phenotypic variation. The raw phenotypic data should be
filtered from the outliers which are noisy data points for further
analysis. Keeping these points can shift the phenotypic data from
a normal distribution which is considered as a limitation of GWAS
that can later affect the natural diversity analysis. The simple way
to know how many outliers are in the phenotypic data and
whether they are effective or not is to use a boxplot that can easily
visualize the data and extreme outliers should be excluded. Meanwhile, the phenotypic variation is an important part of the association analysis and removing outliers should not affect it in a
meaningful manner. Moreover, traits only with moderate to high
heritability estimates (for the phenotypic data after filtration)
should be considered in GWAS because heritability is a good indicator of how much the genetic variance contributed to the phenotype and how much the phenotype is linked to the genotype. Low
broad-sense heritability is a limiting factor that reduced the power
of GWAS to detect the association. Genotypes repeated across locations or years may have a strong genotype  environment interaction which reduces the heritability of a trait. There are many
methods such as best linear unbiased predictor (BLUP) and best
linear unbiased estimator (BLUE) that can be used to adjust the
phenotypic data scored across locations or years to provide better
estimates of the phenotypic values considering genotype  environment interaction. The relationship between the associated
SNP and phenotypic traits in unrelated individuals is explained
by the estimation of the variance of SNPs which when used in a
GWAS is also known as the so-called SNP-based heritability. Such
analysis helps in dissecting genetic variation and understanding
the genetic architecture for complex traits, in addition to identifying the most significant SNP that can be incorporated in future
breeding programs.
Second: the number of individuals. The population size is very
important for obtaining meaningful results. Population size is critical to define portions of the phenotypic and genotypic variation;
hence increasing the population size will improve the power of
having meaningful associations with a larger effect, an acceptable
frequency within the population, and overcome rare-variants.
Thus, a low number of individuals is a disadvantage that reducing
the power of GWAS. A range of 100–500 individuals are needed
and suitable for performing GWAS [44]. The individuals of the population may be selected based upon their expected phenotypic and
genotypic variation considering genetic background, including
geographic regions, biological status, growth habit or whatever
trait the researchers interested in. The selected individuals should
be replicated to confirm their diversity through statistical analyses
including clustering analyses and to ensure a normal distribution.
In case the individuals do not have extensive genotypic information, it is possible to estimate their genetic diversity using a few
molecular markers for some important genes e.g. photoperiod
response, vernalization response, plant height, and row-type. After
a phenotypic and genetic analysis, we keep those individuals
which show high variation in the population. Finally, sufficient
seed for further research purposes is needed. The population
should be grown and isolated (selfing) for at least one growing season with a preference for multiple selfing generations for multiplication and purity e.g. single seed descent. Careful selection of
population individuals can have large genetic variation and detect
true novel association signals that can be used for further breeding
and genetics aspects. Most of barley GWAS studies used hundreds
of individuals which were selected to represent different geographical regions, growth habits, row-types, etc. which maximize
the genetic variance to detect the specific allele(s). This approach
also increased the chance for genetic heterogeneity within the population that may reduce the power of GWAS to detect major loci,
leading to a non-causative allele(s), and affect the allele estimates
of the marker. A high number of samples with low genetic
123
A.M. Alqudah et al. / Journal of Advanced Research 22 (2020) 119–135
heterogeneity (from the same region, growth habit or row-type. . .)
may not show expected phenotypic/genotypic diversity or the allelic variation present at low allele frequency or absent completely.
Therefore, a high number of globally diverse individuals would
be the best solution to make the balance between genetic diversity
and allele frequency e.g. GWAS for highly heritable and routinely
scored morphological traits during genebank propagation (e.g.
row-type, hull adherence and awn roughness) in a 1,000-sample
core set from 21,405 accessions of the IPK barley collection using
GBS [45]. Many studies on wheat dealt with the problem of
heterozygous loci in the association panel by considering all
heterozygous loci as missing and re-filtering the marker data
[46,47] and similarly was done in faba bean, Vicia faba L [48].
Third: population structure. It is a statistical approach that aims
to calculate relatedness correlation among individuals within the
population due to the admixture and historical structure that must
be considered carefully during the analyses and results interpretation. The selection of a population for association analysis by
researchers generates the structure, based on geographic or growth
habit, etc. that leads to having a specific genetic variation and an
effect on the end-use of association analysis. It is the major limitation in the GWAS analysis since not all individuals are equally distantly related to each other at the genetic level. Ignoring the
correction of population structure leads to having spurious associations between genotype and the trait of interest. The STRUCTURE
program is a computationally intensive method to define the population structure and then estimate the proportion of clusters (unknown number of subpopulations) within the population so-called
Q matrix and then estimates which individual belongs to which
subpopulation [49]. The software produces highly accurate clustering using multilocus data from the genotypes to explain the population structure. Removing structured associations is not always
adequate for controlling the population structure due to the
limitation in defining the number of clusters and how to assign
individuals into clusters. In addition, structure analysis can be
3
time-consuming requiring intensive computational analysis. Alternatively, the EIGENSTRAT method using principal component analysis (PCA) is another statistical approach developed by Price et al.
[50] that counts the structure of the population in order to reduce
the dimensional genotype data to control the structure. The
method considers the genotypic data to deduce genetic variation
that can be explained by a small number of dimensions. Yu et al.
[51] developed a mixed-model approach to control spurious associations through accounting multiple levels of relatedness through
a pairwise relatedness matrix called the kinship matrix (K). K can
calculate the relatedness between pairs of individuals using genotypic information. The high value of relationships among the individuals indicates high genetic similarity e.g. the tendency among
the individuals from the same geographical region which can be
clustered in the group. Most of the studies use both methods
(STRUCTURE and PCA) to confirm their results [38,45,52,53]. The
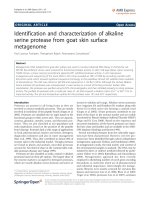
principal component analysis is presented in a scatter plot of
PCA1 and PCA2 which present the most of the total variation
between the individuals based on their genotypic data. If the genotypes are randomly distributed in the plot and form no clear
groups, then there is no population structure in the population,
and vice versa (Fig. 1a and b). In STRUCTURE software, the population structure is determined by plotting the proposed number of
subpopulations against delta k [54]. However, if the number of subgroups is assigned into two subpopulations, the population could
have two possible subpopulations or no population structure
because STRUCTURE does not estimate delta k for the first subpopulation. The presence or absence of population structure can be
determined by another plot in which a number of subpopulations
are plotted against log-likelihood. In the case of no population
structure (Fig. 1c), the log-likelihood is steadily increased with
the increase of a number of subpopulations. If the log-likelihood,
on the other hand, is steadily increased after k = 2 (Fig. 1d), then this
population can be divided into two possible subpopulations. Structure Harvester ( />
20
(a)
(b)
2
10
PCA2
PCA2
1
0
-1
-10
-2
-20
-3
-3
-2
-1
0
PCA1
1
2
3
-30500
-30
-30
-30500
(c)
-31500
Log likelihood
Log likelihood
0
-32500
-33500
-34500
-35500
-20
-10
PCA1
0
10
20
(d)
-31500
-32500
-33500
-34500
-35500
-36500
-36500
1
2
3
4
5
6
7
8
9
Number of subpopulations (k)
10
1
2
3
4
5
6
7
8
9
Number of subpopulations (k)
10
Fig. 1. Visualization of population structure and number of subpopulations within the population. No clear population structure (a), whereas the population was wellstructured (b). Log probability data as function of k (number of clusters/subpopulations) from the STRUCTURE run. No number of subpopulations (c), while two
subpopulations are shown in (d). Each color in (a and b) represents a subgroup and each dot represents an accession/individual. PCA, principal component analysis.
124
A.M. Alqudah et al. / Journal of Advanced Research 22 (2020) 119–135
is a very useful website in which the output results of STRUCTURE
can be compressed and uploaded. The software provided information on population and the best k for the proposed populations in
table and figures.
Fourth: allele frequency. A very important factor, which affects
the power of GWAS, is if alleles are present in a few individuals
across the population. Rare allele leads to a lack of resolution
power [55]. Therefore, allele frequency distribution and analysis
impact on detecting the association. It is difficult to detect the
functional alleles that are present at a low frequency unless they
have high impacts on the phenotype. Ignoring the allele frequency
might mislead the GWAS outputs. Most of the GWAS studies
focused solely on common variants and have the major allele frequency at ! 5%. This approach means that in the population of
200 individuals, the allele present in 10 individuals or less will
not be detected because it is a rare variant with minor allele frequency (MAF) at less than 5%. Unfortunately, rare alleles could
explain natural variation in a specific group of individuals that is
important for further breeding and genetics in addition to biological studies. For example, deep analysis of GWAS revealed that a
group of East Asian accessions (13 accessions out of 209) is carrying the allele (MAF ! 5, i.e. the allele present in 11 accessions) that
led to significantly longer phase durations, lower tiller numbers,
more leaves, and a greater leaf area [56]. This finding confirmed
that low-frequency alleles may have relatively large effects on
complex traits and suggested that the population structure should
be well studied and connected to the GWAS output to interpret the
findings. It is also important to mention that the selection process of
individuals has a clear impact on variants across the allele frequency
that can be skewed for traits which are strongly influenced by selection. In most crops, the domestication bottleneck has a clear impact
on the allele frequency by eliminating many rare alleles and reduced
the average allele frequencies. Therefore, careful selection of a large
number of representative individuals (including wild relatives and
landraces) with advances in genotyping (e.g. GBS) will further boost
the power of GWAS to detect the MAF by increasing the number of
SNPs. Furthermore, a deep analysis of the association signals including the flanking SNPs and group-specific individuals (e.g. wild and
landraces) could, on one hand, increase the power of discovering
variants with a strong effect on the phenotype. Alternatively, it
could potentially detect the causative association signal. Overall,
discovering the highly informative rare alleles will provide more
powerful genetic tools to answer biological questions.
The linkage mapping population is a good choice for dealing
with rare alleles since it can be artificially introduced. Several studies have used linkage mapping along with LD mapping, which
resulted in a methodology known as ‘‘nested association mapping”
which decreases spurious associations by considering the population structure. Recently, Nested Association Mapping (NAM) has
been developed in barley to investigate the genetic architecture
of complex traits using GWAS. Halle Exotic Barley 25 (HEB-25) is
a multi-parental mapping design to use the advantages of linkage
analysis and association mapping by crossing 25 wild barley (H.
vulgare ssp. spontaneum, Hsp, and ssp. agriocrithon, Hag) accessions
with the spring barley cultivar Barke (H. v. ssp. vulgare, Hv) which
offered an exceptional genetic resource [57]. Allelic diversity
within the mapping population can be increased through intercrossing multiple parents which are genetically diverse e.g. the
Multi-parent Advanced Generation Inter-Cross (MAGIC) [58].
Another issue that should be considered is allelic heterogeneity
at a single locus level (multiple alleles/genomic markers might
have similar effects on the trait of interest), or at loci heterogeneity
if the heterogeneity occurs in several distinct genes [59]. Incorporating multiple neighboring markers to the strongest associated
signal is the solution in small grain cereal crops e.g. barley and
wheat because we still work with a few thousands of SNPs.
Fifth: LD is another point that has to be considered during the
analyses, especially to define the interval of highly associated SNPs
that can lead to defining the most significant loci. Ignoring the nonrandom association among alleles at different loci means that both
causal and non-causal alleles will be incorporated in the further
analyses that likely driving to have false associations. The LD is
an indicator to detect the distance between loci, which is important to find the number of required markers for the wholegenome scan, i.e. high LD value means a low number of markers
are needed to cover the genome [60,61]. A long-range LD increases
the chance of false association and therefore, the calculation of LD
at the beginning of the association analysis is essential. The coefficient of LD is used to measure the value of how likely two loci are
associated and sharing the history of mutation and recombination.
This analysis always includes a disequilibrium matrix that shows
the pairwise calculations among loci using the most two common
statistics for measuring LD i.e. r2 and D’ [31]. According to many LD
analyses in plants, r2 is a stronger value to estimate how loci correlate with the QTL of interest while D’ is more affected by small
population sizes and low allele frequencies. Because LD is used to
calculate the association value between loci (r2 or D’, >0) it is
important to connect the phenotypic variation with the causative
SNPs. LD between SNPs, including the causative locus (within LD)
must be considered in a statistical analysis that can show whether
each SNP within the LD is significantly associated with the phenotypic variation or not. Here, we propose to consider all SNPs above
the threshold (in some cases all SNPs) in such analysis to check
which one can explain more natural phenotypic variation since it
is known that not all of the highly associated SNPs having a highly
significant impact on the phenotype. The SNPs which are in LD
with r2 > 0.2 should be considered in the statistical analysis which
can be useful to detect the causative loci especially for QTL that are
located in the centromere region. Another feature of calculated r2
as an estimate of LD between each pair of SNPs is that it gives
important information if a group of significant SNPs tends to be
inherited together or representing the same QTL or individual
QTLs. By looking on the significant SNPs located on the same chromosome, if the r2 value between the two SNPs is high, then these
SNPs probably represent the same QTL and tend to be inherited
together, while, if the value is low, then the two significant SNPs
probably represent two different QTLs.
To clarify, LD is an estimate of map distance with the consideration of allele frequencies, whereas linkage refers to chromosomelevel [31].
The map resolution of a given population (i.e. the number of
markers and density) is determined by genome size and LD decay
(the rate at which LD declines with genetic or physical distance).
How quickly LD decays over distance (genetic/physical) has been
shown to differ dramatically and vary significantly among species,
within the genome and for loci within a population. The rapid
decay of LD requires a large number of markers to be used in the
whole-genome association analysis [62]. The rate of LD decay helps
the breeders to point the number of markers that would be needed
for GWAS by dividing the genome size on the distance at which LD
is decayed [63].
In self-pollinated species like barley, the LD decay is always larger than in cross-pollinated species such as maize, therefore a
lower number of markers are required to cover the genome. In barley, one million SNP markers are required to cover the barley genome in case of LD decay at 5 kbp, whereas only 57,000 SNPs are
required if the decay is at 100 kbp [61]. Moreover, the LD decay
varied among different barley populations with less than
1 centiMorgan (cM as a genetic distance based on the genetic linkage for the physical distance of alleles on a chromosome which is
equal to the number of recombinants divided by the total number
of offspring multiplied by 100) in wild and 14 cM in cultivated
A.M. Alqudah et al. / Journal of Advanced Research 22 (2020) 119–135
winter barley and within the genome, i.e. was higher in the centromeric than telomeric regions [64]. Therefore, high mapping resolution with dense SNPs together with great genetic diversity
makes barley a promising model temperate cereal crop. LD decay
can be visualized by a scattering or heatmap plots of r2 values versus genetic/physical distances between all pairs of SNPs along a
genome or chromosome or specific genomic region e.g. QTL.
The historical recombination can be estimated through analyzing the LD pattern in the population which depends on multiple
factors like allele frequency, recombination rate, random mating,
mutation rate, genetic drift and migration, selection, population
size, and structure. In the association’s panel which is selected by
researchers (artificial selection process), the allele frequency is
not expected to fit with Hardy-Weinberg equilibrium proportions
for loci (i.e., unlike bi-parental population, genotype frequencies
can not be predicted by association population allele frequencies).
SNPs that are not in Hardy-Weinberg equilibrium are commonly
removed from GWAS analysis [65]. The advantage of association
population is that recombination events which are accumulated
over generations improve the map resolution with high allele
numbers. In outcrossing species, the effect of mating patterns
and admixture clearly explain more rapidly LD decays compared
to selfing species due to the greater effective recombination in
outcrossing species [31]. The effects of genetic drift include losing
rare alleles that increase LD levels in small population size. Selection can also increase LD. For example, if the mutation or recombination between the neighboring alleles happened then they both
will be under selection pressure. Therefore, the selection of the
association population can produce locus-specific linked alleles
(selected allele at a locus) which control specific phenotype that
likely appeared in LD. Generally, selection and admixture increase
the LD level. Finally, migration increases LD in the population and
has an impact on genetic structure in an association panel. Therefore, estimating a ‘‘structure” in the population or identifying subgroups in the panel can reduce its impact. Ignoring selection,
mutation, migration, or drift which could have occurred during
the history, lead to having alleles in linkage equilibrium (r2 or
D’=0).
As discussed above, the major problem of having a false association in GWAS is the population structure. The application of
mixed model methods to correct the population structure using
the PCA [38] or K matrix [53] in barley is commonly used
[36,40,45,66] as a powerful tool for controlling the population
structure and reducing spurious signals of association whereas a
combination (Q + K) of these approaches appears to be the most
powerful [11,67]. These approaches have successfully split the
individuals of diverse barley populations into subpopulations
based upon row-type (two- and six-rowed) and/or geographical
origins and/or growth habits (spring and winter subpopulations).
Therefore, considering the relationship matrix for the population
structure correction purpose in the mixed models is an influential
method that is commonly used in barley to significantly reduce the
number of false-positive associations. Note, in some cases, controlling the population structure using Q + K may lead to having overcorrection and then losing significant information and output.
Recently, many studies used QTL mapping and association mapping to identify and validate QTLs associated with target traits e.g.
in maize [68], faba bean [48] and brassica [69]. Two populations
representing two different genetic backgrounds of bi-parental
and diverse populations which were genotyped using the same
set of markers. The advantage of using both populations is the easy
tracking of significant markers associated with the same trait in
two different genetic backgrounds. There is no study in barley that
includes both analyses. Therefore, it could be very useful to consider this approach in barley to genetically improve breeding target traits.
125
How GWAS works
To conduct a GWAS experiment, the first step is to select the
population of study with a full consideration of the size of the population (minimum 100 individuals) with preference to increase the
number of individuals as much as possible to avoid Beavis effects
that lead greatly overestimated of phenotypic variance when the
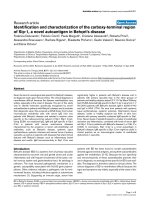
number of individuals are small e.g. 100 [70]. Then, there are three
important stages for performing a successful GWAS experiment
(Fig. 2); Stage I is the phenotyping in which all genotypes should
be phenotyped for a particular trait or group of traits based on
the objectives of the study. Accurate phenotyping is a very critical
point to detect genotype-phenotype associations. Phenotyping
should be repeated over replications and/or locations and/or years.
The broad-sense heritability should be calculated for raw data
(note, it should be calculated after removing the outliers) including
all of these factors and considering G Â E interaction. High heritability is an indicator that the trait is mostly genetically controlled
which is important to detect the association signals. Then, the phenotypic data can be used to estimate the mean i.e. BLUE or BLUP.
Because the phenotypic data are highly unbalanced in the plants,
the estimation of genotypic values is mostly calculated as fixed
effects (i.e. BLUE) using mixed models [71] which have been successfully used in barley [45,52,53,66].
Stage II (Fig. 2) is the genotyping in which the same set of individuals that were phenotyped should be used for genotyping using
DNA molecular markers. GBS is the most frequent method used in
genotyping because it generates numerous SNP markers inexpensively that cover the crop genome (e.g. wheat, barley, etc.). The
GBS-generated SNPs should be filtered based on missing data,
heterozygosity, and minor allele frequency. Before running GWAS,
population structure should be tested in order to select the better
GWAS model. The general linear model (GLM) and mixed linear
model (MLM) are statistical models often proposed for performing
GWAS (Fig. 2). The GLM does not take the population structurerelated into account. Hence, GLM was used in populations which
did not have the population structure in faba bean, Vicia faba L.
[62] and rice [72]. The MLM, on the other hand, considers the population structure in its model (Kinship or kinship + Q matrix +
PCAs).
Finally, the phenotypic and genotypic data are combined using
appropriate software (e.g TASSEL) by which alleles associated with
a particular trait can be detected after the GWAS model was
selected (Stage III: Fig. 2). Phenotyping is highly recommendable
to be conducted before genotyping especially for those populations
with no prior information. For example, if a population consisted of
400 genotypes which were collected from different regions and the
objective is to test them in a particular environment. It is possible
that many genotypes could be lost due to poor adaptation to the
phenotyping environment. Therefore, time and money (for genotyping) can be saved by testing the phenotypic diversity of that
population first.
The significance of marker-trait associated (passing the threshold e.g. –log10 p-value 3) is usually determined by the false discovery rate (FDR) or Bonferroni correction (BC) which can be defined
as multiple comparisons that can be fit to test the significance of
hundreds of thousands to millions of markers in GWAS. For BC,
the significant level is divided by the number of tests (markers)
at each locus. The BC method is intensively used e.g. [73,74] to
define the threshold of significant markers for several traits at
once. As a result, a fixed BC P-value will be generated using the following equation
P À v alue ðBC Þ ¼
0:05
K
where k is the total number of markers (statistical tests).
126
A.M. Alqudah et al. / Journal of Advanced Research 22 (2020) 119–135
Diverse collection
Stage I: Phenotyping
Population structure
Stage II: Genotyping
Genotype1
Genotype2
Genotype3
Genotype4
CTAAGTACA
CTATGTAGA
CTATGTACA
CTAAGTAGA
Stage III: Genome-wide associaƟon
study (soŌwares/packages)
Statistical models
GLM
MLM+Kinship
MLM+Kinship+Q-matrix
Marker–trait association tests
FDR
BC
QTL and gene idenƟficaƟon
Fig. 2. The most important three stages for performing a successful GWAS experiment. Stage I: Phenotyping, stage II: Genotyping and stage III: Genome-wide association
study including statistical models, multiple-testing analyses, and software/packages for QTL and gene identification.
The false discovery rate (FDR) is another test that provides an
estimate of the number of actual true results among those called
significant [75]. In this test, the p-values of all markers generated
from GWAS are sorted in ascending order. Then, each p-value at
each locus is given a rank (R - e.g. 1, 2, 3, . . .. 100,000). The
p-value of FDR for each marker is calculated as follow
p
v alue
ðFDRÞ ¼
pR Â 0:05
K
where p R refers to the rank of marker p-value
FDR is calculated for each trait independently, which makes it
more powerful in studying the genetic factors of developmental
and agronomic traits in crop plants. Compared to the fixed
p-value (BC) for all traits, the p-value (FDR) is more flexible and
changed based on the markers and traits. Therefore, FDR is less
conservative than BC and recommended to be used in crop plant
association studies to detect the highly associated markers for each
trait independently. In both tests and at each locus, if the p-value of
FDR or BC is less or equal to the p-value, generated from GWAS, of
the marker, the association is true and the marker is associated
with the trait. The marker-trait association can be tested at the significance level of 0.01 and 0.05 [38,53]. However, some association
analysis studies tested the marker-trait association by using FDR at
20% of significance level as it can detect significant markers with
minor effects [62]. The determination of significance level for
marker-trait associations in GWAS is based on the study, which
may use high FDR to investigate the whole picture of the genetic
architecture of a trait or low FDR to identify candidate loci/gene
(s) for further genetic and molecular studies [39].
Software for performing GWAS (TASSEL, GenStat, PLINK, and R
(GAPIT))
GWAS can be performed using many software statistical packages (Stage III: Fig. 2). Here, we focused on the most important
association analysis software packages that are frequently used.
TASSEL (Trait Analysis by Association, Evolution, and Linkage) is
the most common software for GWAS in plants. It includes many
powerful statistical methods for performing GWAS including
GLM and MLM [76]. TASSEL can analyze the population structure
using kinship and PCA . LD is included also in TASSEL. The software
is always used in association analysis in barley e.g. [40]. The new
version of TASSEL (TASSEL 5.0) can analyze genetic diversity and
perform SNP calling from GBS data. Interestingly, the software
includes many visualizing tools which can be used to present data
such as a scatter plot of PCA, LD, Manhattan plot for GWAS results,
the heat map for genetic distance, a phylogenetic tree using
archaeoptery in addition to the phenotypic variance explained by
markers (R2). The new version also includes some useful data summaries, which provide a quick view for a researcher on genotypes,
markers, heterozygous, missing data and number of markers on
each chromosome. Old versions of TASSEL such as TASSEL v.2.1
can accept any type of DNA markers (e.g. SNP, SSR, AFLP, RAPD,
etc.). The TASSEL v.5.0 accepts only SNP markers. TASSEL is free
software and can be downloaded from />GenStat for Windows Edition is another statistical software that
can perform marker-trait association analysis in a genetically
diverse population using bi-allelic and multi-allelic markers. Using
GenStat, GWAS can be done either GLM or MLM models with
127
A.M. Alqudah et al. / Journal of Advanced Research 22 (2020) 119–135
population structure correction to control genetic relatedness by
PCA or Kinship. There is an option to define the threshold of the
significance of –log10(p) of which Bonferroni can be selected. Interestingly, LD decay can be determined and visualized by GenStat
software and the effect of each SNP can also be calculated to show
the impact of the SNP on the traits. LD decay is important to determine the number of markers required for GWAS. Plots for GWAS
profile of the -log10(P) of the test statistics and the map with the
location of the detected significant markers, and Q-Q can also be
visualized. Therefore, GenStat has been intensively used to detect
causative allele(s)/loci in barley [11,36,67,77] of which had been
cloned (Table 2). The GenStat software can be purchased and
downloaded from />PLINK allows the study of a large dataset of phenotypes and
genotypes [78]. It is free software that can be downloaded from
It provides many characteristics
and features of which, PLINK performs analyses for population
stratification detection, basic association tests, meta-analyses,
and some other tests such as gene-based tests for association
and screening for epistasis. Graphical images for Manhattan plot,
Q-Q plot, and multidimensional scaling (for population structure)
can be illustrated. Also, the results of GWAS and LD among SNP
markers can be presented in tables produced by PLINK.
The recent advances in R statistical environment free software
( provide many useful packages for
performing GWAS. The genome association and prediction integrated tool (GAPIT) is a useful R package that performs GWAS
and genomic selection. The main advantages of GAPIT are: it can
handle a large amount of data (SNPs and genotypes) and it reduces
computational time without compromising statistical power [79].
The package includes many statistical methods such as MLM, population parameters previously determined (P3D), and efficient
mixed-model association (EMMA). The results of GWAS results
can be illustrated by Manhattan plots, quantile–quantile (QQ) plots
and a table, including p-value, minor allele frequency, sample size,
phenotypic variance explained by markers R2 and adjusted P-value
following a false discovery rate [75]. Similarly, the results of kinship are presented in a heat map and a table. Moreover, heritability
estimates and likelihood function can be produced in graphs at different compression levels. Due to the aforementioned features,
GAPIT becomes the most powerful and useful tool for association
analysis in barley [41,45] or other cereals like wheat [80].
There is a clear trend of using GenStat for QTL and candidategene identification because it is one of the earliest software to do
these analyses and has many features that are not available in
other software. For example, by GenStat the phenotypic and genotypic data can be analyzed, BLUE values can be calculated, LD can
be measured, and population structure with PCA and kinship can
also be calculated and then GWAS by applying either GLM or
MLM can be done. The output includes all of the important plots
and information about the marker-trait associations e.g. the effect
value of marker on the trait in addition to G Â E interaction. Finally,
the significant associations can be validated by Bonferroni correction. In other software/packages, often each step needs to be calculated separately for GWAS.
The output results of GWAS
Each software program gives slightly different parameters as
output results for GWAS. TASSEL software is a good example of
producing many parameters that help to dissect the genetic basis
of the target trait. These parameters include the p-value of each
SNP which is important to determine the significance with the
trait, R2 (phenotypic variation explained by marker) that determines if the significant SNP is a minor or major QTL, and allele effects
of the significant SNP (increased or decreased the trait).
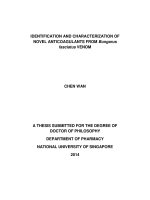
The main output can be presented in the Manhattan plot that
illustrates, on a genomic scale, the P-values of all markers used
in GWAS. The x-axis represents the genomic order by chromosome
and position on the chromosome, while, the y-axis represents
the À log10 of the P-value of each marker (equivalent to the number of zeros after the decimal point plus one). The associated significant SNP (lowest significant p-values), representing QTL tend to
show up as a strong signal on the Manhattan plot (Fig. 3A). The
threshold of –log10 (p-value) can be fixed at a confidence value
of which –log10 ! 3 is the most common and reliable value
(Fig. 3A). For further analysis, the threshold can be recalculated
using the multiple comparison analysis that makes the p-value of
SNP more robust and trustworthy (Fig. 3A).
Another important graph in GWAS is the QQ plot which illustrates the relationship between the observed and expected
p-values. It depicts the deviation of the observed P-value of each
SNP from the null hypothesis. The QQ plot can be used to compare
the observed vs, expected values among GWAS statically models to
Table 2
Candidate-gene based GWAS which has been validated and cloned.
Population
Sample
size
Growth
habit
Population
structure
Model
Marker
info
Phenotype
Software
Candidate
gene
Validation
Ref.
Genobar
224
Spring
Row-type;
photoperiod
responses
MLM
9 K SNP
Tillering, plant height
Leaf area
GENSTAT
Ppd-H1,
VRS1
Mutant analysis
Molecular,
transcriptome,
histological analyses
The haplotype of
specific gene-derived
markers
Map-based cloning
Histological analysis
Re-sequencing &
Cloning
[38]
[39,84]
Phase duration and
development
European barley
UK cultivars
138
500
Winter
Spring,
Winter
Western Europe
and North
America
UK cultivars
190
401
Spring
European barley
804
Spring,
Winter
USDA
2,671
Row-type
Row-type;
seasonal
growth habit
Row-type;
seasonal
growth habit
seasonal
growth habit
MLM
MLM
9 K SNP
1.5 K
SNP
MLM
2.5 K
SNP
Agronomic traits
Leaf size
Auricle, awn, spike, rachis,
spikelet, and grain-related
traits
Spikelet fertility, spike
architecture and tillering
MLM
5.2 K
MLM
9 K SNP
MLM
9 K SNP
HvCO1,
BFL
[36]
GAPIT-R
GENSTAT
VRS2
Ppd-H1
ANT2
[56]
[41]
[67]
GENSTAT
INT-C
Re-sequencing &
Cloning
[81]
Spike density-related traits
GENSTAT
AP2
[77]
Heading date and
agronomic traits
Salt Tolerance
GENSTAT
HvCEN
GAPIT-R
HKT1;
5-like
Re-sequencing &
Cloning
Re-sequencing &
Cloning
Re-sequencing &
Cloning
[11]
[82]
128
A.M. Alqudah et al. / Journal of Advanced Research 22 (2020) 119–135
(a)
ManhaƩan plot
FDR
Chromosomes
Q-Q plot
(b)
Spread out
Light tailed
A gap in value
Over corrected
Fig. 3. The output results of GWAS. Manhattan plot (a). Horizontal-axis represents the position of markers over the barley chromosomes and vertical-axis represents -log10(Pvalues) of the marker-trait association. Each dot denotes marker. Horizontal blue-line represents threshold of -log10(0.001) and red-line represents the threshold of -log10(pvalue) passing false-discovery rate (FDR). Quantile-quantile (QQ) plot of different GWAS models (b). The plot shows the expected vs. observed -log10(p-value) of each marker
(dote). Red-line is the standered relationship among markers. General linear models (GLM), mixed linear models (MLM) and compressed MLM (CMLM).
show how well the model used in GWAS considering the population structure and familial relatedness and then can be applied,
for instance, MLM compared to GLM or CMLM models (Fig. 3B).
The diagonal or standard line (red in Fig. 3B) shows whether the
points are matched perfectly or deviated which reflect the distribution. Gray area shows 95% confidence region for values. It is
expected that most of the data points in the QQ plot will lie on
the diagonal line since they are not associated with the trait.
Whereas the deviations from this line suggest that the model does
not sufficiently control the population structure which can be
interpreted as spurious associations.
There are three main possible QQ plots, each with its own
meaning:
(1) the observed values correspond to the expected values, all
points (observed vs. expected p-values) are very near or on
the diagonal line and within the confidence interval, the gray
highlighted region (Fig. 3B).
(2) the significant SNPs (observed p-values are highly and significantly different from expected p-values under the null
hypothesis) move towards the y-axis (Fig. 3B).
(3) If there is an early separation of the points or unclear trend,
this means that the results could be due to an unaddressed
population structure or/and poorer quality of the phenotypic
data. In this case, most of the highly deviated SNPs are
represented as a false association and other considerations
(e.g. correction of population structure, phenotypic data correction) are required (Fig. 3B).
It is implausible that GWAS will completely explain the heritable proportion of complex traits, but, it can explain a large proportion. The difficulty in detecting small effects by rare variants or
very small effects by common alleles makes it impossible.
GWAS as a driver of gene discovery in barley
In barley, progress has recently been made toward identifying
loci/genes underlying the phenotypic and allelic variation of complex traits using GWAS with a high throughput SNP platform, i.e.
sufficient marker density to cover the entire genome. Many studies
have demonstrated the power of association population mapping
in identifying candidate genes that control the target traits
(Fig. 4). Here, we will also demonstrate the power of GWAS in
detecting the allelic variation which had been functionally validated (Table 2).
ANTHOCYANINLESS 2 (ANT2) is the first gene in barley discovered using GWAS and then cloned by Cockram et al. [67]. Resequencing ANT2 candidate basic helix-loop-helixprotein1
(HvbHLH1) gene showed the deletion in a premature stop codon
A.M. Alqudah et al. / Journal of Advanced Research 22 (2020) 119–135
129
Fig. 4. Summary of the most important genes distributed over barley chromosomes, which are involved in developmental and agronomic traits.
upstream that lead to lack of anthocyanin in the tested mapping
population. Lateral spikelet fertility gene INTERMEDIUM-C (INT-C)
is another example. It is an ortholog of the maize domestication
gene TEOSINTE BRANCHED 1 (TB1) and was detected by GWAS
[81]. The natural allelic variation at this locus shows the positions
of the 17 independent int-c mutant alleles, which is important to
understand the genetic basis of crop domestication and fundamental spikelet developmental processes. HvAPETALA2 (HvAP2/Cly1)
had been also detected by GWAS that is associated with the genetic
basis of natural variation of spike density-related traits in spring
barley [77]. In the same study, the GWAS was used to discover
the ZEOCRITON alleles which are associated with the studied traits
in a 401 two-rowed UK spring barley population. In 2012 Comadran et al. [11] developed the 9 K iSelect IlluminaTM SNP platform
from which they provided a high GWAS map resolution that leads
to cloning barley CENTRORADIALIS (HvCEN/eps2) which contributed
to the spring growth habit and environmental adaptation in cultivated barley. Using a GWAS, the genomic region of salt tolerance
gene HKT1;5 had been discovered in barley and then resequencing the gene that is responsible for Na + unloading to the
xylem and controlling Na + distribution in the shoots validates it
[82]. The aforementioned successful examples of genes identified
through GWAS provides strong evidence that GWAS served as part
of a rapid gene-cloning strategy that can be effectively used for further gene cloning.
QTL and allelic variation detected using a GWAS
GWAS is also used to explore the important alleles of the candidate genes underlying the natural variation (Table 2 and Fig. 4). For
example, GWAS analysis in a worldwide barley collection discovered the most important alleles of Six-rowed spike 2 (VRS2) gene.
Haplotype 4 encodes a functional VRS2 protein showed a significant and consistent association signal for phase duration, leaf area,
and leaf and tiller number [56]. The natural variation of the preanthesis stages/phases in barley is based on the genetic allelic
diversity at PSEUDO-RESPONSE REGULATOR (HvPRR37)/PHOTOPERIOD RESPONSE LOCUS1 (Ppd-H1) gene, as the central heading time
gene, that in turn regulates the responses to long-day photoperiod.
A single nucleotide change at marker 22 alleles (G/T in the CCTdomain) Ppd-H1 gene changes the status of the photoperiod
responsive (Ppd-H1) accessions to reduced photoperiod sensitivity
(ppd-H1) to long-day conditions. The change led to the evolution of
130
A.M. Alqudah et al. / Journal of Advanced Research 22 (2020) 119–135
the late heading of European accessions (mostly cultivars/breeding
lines) compared with the early heading of landraces (carrying sensitive alleles Ppd-H1) and coming from the barley center of origin
[36,83]. Histological analysis confirmed the GWAS results that allelic variation at marker 22 of Ppd-H1 controlled cell proliferation
period and leaf maturation which directly contribute to leaf size
in European winter barley [41]. In other studies, GWAS demonstrated that the genotypic variation at the barley domestication
gene VRS1 influenced the leaf area and tiller number which was
confirmed by mutant, histological, transcriptome and molecular
validation in case of leaf area [84]. GWAS showed that natural
selection of adaptive evolution for late heading in European accessions improves other adaptation and developmental traits such as
increased leaf area and tiller number which in turn improve grain
yield [38,39,41]. Many other genes found to be associated with
important developmental and agronomic traits (Fig. 4) of which
BFL (BARLEY FLORICAULA/LEAFY) gene had strong associations with
phase transitions, tillering and other yield-related traits [36,38].
GWAS demonstrated its strength to detect novel loci/QTL of
natural variation (Table 3). To this end, many barley populations
and marker types have been used for studying the genetic basis
of wide-range of traits including agronomic traits (Table 3). For
example, Genobar world wide spring barley collection consists of
224 accessions had been intensively used for GWAS studies that
revealed QTL (Table 3) for tillering at 5H (31.7–34.1 cM) and 6H
(16.9–24.6), plant height at 5H (21.3–24.6) [38], leaf area at 1H
(95.9–97.9) and 2H (50.9–56.4) [39] in addition to many other
novel QTL underlying the natural variation of germination, seedling architecture at 1H (76–48), 2H (112–115) and 5H (44–45)
[52], phase transition and developmental stages 3H (56–64) and
5H (2.6–9.3) [36]. Natural variation analyses in a NAM population
(consists of 1420 individuals) were applied that provide further
insights into the evolutionary genetics underlying adaptive traits
in barley [57,66,73,74]. Using NAM population, the allelic variation
at many genes involved in phase transition and development (VrnH, Ppd-H, and Denso, Fig. 4) in addition to many other novel loci
(Table 3) at 4H (3–4 and 110–114) have been detected [57].
Whereas Saade et al. [73] discovered the locus underlying biodiversity in leaf sheath hairiness at 4H, 111.3 cM using the same population (Table 3). GWAS approach was used to understand the
genetic mechanisms of biotic and abiotic stress in barley. For
instance, salt and drought stress tolerance alleles/loci were discovered in different diverse barley populations [52,66,85]. The genetic
basis of seedling root and shoot architecture under drought stress
had been studied that reveal new loci at 1H (76–48), 2H (112–115)
and 5H (44–45) with the putative candidate genes [52]. In other
studies, GWAS had been conducted to explore the genetic factor
(Table 3) underlying drought tolerance agronomic traits e.g. grain
yield, TGW, peduncle, leaf, and spike length [86] and physiological
parameters e.g. water use efficiency and water content among 2H
(118–119), 3H (24–25), 4H (49–55) and 5H (48–49 and 147–148)
are important [87]. Studies focused on discovering the natural variation of salt tolerance in barley and effective loci at 2H,140–145
[66] and 2H (3.5), 4H (1 4 5) and 5H (43.5) have been detected
[88]. Novel loci associated with natural variation of resistance to
stripe rust, Fusarium, the net form of net blotch and stem rust
[89–93] whereas the study by Turuspekov et al. [94] identified
highly significant QTL at 6H (63–64) for stem rust resistance
(Table 3). Nagel et al. [95] used GWAS for the first time to study
seed dormancy and pre-harvest sprouting traits and revealed novel
loci at 1H (5), 3H (104.3 and 135.6) and5H (169.4). In addition to
above-mentioned studies, many others have been conducted to
uncover the genetic architecture of yield component and quality
traits under field conditions e.g. at 2H (41–52 cM), 3H (8–9), 5H
(100–108) [40], 2H (106–107), 7H (1.6–15) [96], 2H (145–155),
3H (95–100) and 5H (160–170) [97]. The GWAS studies in barley
detect novel QTL which not previously reported including candidate genes for further genetic and/or molecular characterization
and validation. GWAS output provides new sources of alleles that
enhance the diversity of tolerance to biotic and abiotic stress in
addition to improving yield in future breeding.
How to predict the gene in barley?
Once the GWAS output has passed all of the statistical criteria,
the next step will be candidate genes identification. The most
important, consistent and significant association(s)/QTL(s) including highly significantly associated markers (-log10 SNPs passing
the multiple comparison analysis e.g. FDR) e.g. genomic region at
7H (Fig. 3A) will be selected to find their physical positions using
recently published barley genome sequence [98]. The physical
map can be used to define the physical interval on the genome (using flanking SNPs of association/QTL within the LD decay physical
distance) that can include candidate gene(s). BARLEX, IPK server
offers such information about the SNPs and barley genes including their annotation
GO Terms and other useful information.
In case there are many highly associated SNPs within the LD
decay physical distance, we recommend narrowing down the
physical interval up to hundred(s) Kbp that empowered us to
detect the closest candidate genes to the highly associated SNP.
In the best case, SNP(s) can be physically within the candidate gene
that leads to checking whether these SNP(s) are functional i.e. having a significant impact on the associated traits or not.
Here we suggest selecting the high confidence gene including
SNPs within their physical position to make ‘‘SNP-Gene based haplotype analysis” that allows us to validate the functionality of the
SNP(s) within the candidate gene. This analysis can identify which
SNP has the most effect on the associated trait(s) by splitting the
population based on the alleles of each SNP. Matching the allele
with the phenotypic value in the population and then statistical
analysis for the significant differences test between alleles e.g. ttest statistics can show the importance of each allele on the targeted trait(s).
Together with the Exome Capture Sequence, data and gene
expression available at BARLEX for barley will allow one to check
whether the candidate gene is a capture target and then reveal
the most promising haplotypes underlying associated traits, in
addition, to check in which organ and at which developmental
stage the gene is expressed. This analysis will provide the ability
to build phylogenetic-trees and haplotype-networks within and
between individuals and subpopulation or genetic background
(e.g. geographic region) to provide insights into the evolution of
the candidate gene(s), potentially providing evidence for selection
in particular regions/environments. This approach helps further
functional and molecular analysis e.g. mutagenesis, expression
analysis and CRISPR (Clustered Regularly Interspaced Short Palindromic Repeats) (CRISPR)/Cas9 (CRISPR-associated protein9). The
analysis will validate and provide trait-enhancing alleles for crop
breeding/genetics and shed new light on evolution and functions.
Genomics of polyploidy cereals
Ploidy level in crop species is a significant factor influencing the
genotyping qualities, SNP discovery, and validation. Many cereal
crop species are unlike barley and rye with a diploid genome
(2n = 2x = 14). The polyploidy genome in cereal crops such as tetraploid (2n = 4x = 28) and hexaploid (2n = 6x = 42) wheat, tetraploid and hexaploid oats (Avena sativa), and triticale
(Triticosecale) that can be tetraploid to octoploid (2n = 8x = 56).
The genome complexity in the allopolyploid species as results of
Table 3
The most significant associated genomic regions with quantitative traits in barley using a GWAS approach.
Sample size
Marker info
Phenotype
Chr. (pos. (cM))
Software
Ref.
Genobar
224
1.5 K SNP
Heading date,
plant height, TGW, starch content, crude
protein
Phase transition, developmental stages,
tillering, plant height, leaf area
2H (41–52), 3H (8–9), 5H (100–108), 6H (28, 60, 125), 7H
(1 0 4)
TASSEL
[40]
1H (3–8, 95.9–97.9), 2H (50.9–56.4, 82–88, 141–147), 3H
(56–64, 122–127), 5H (2.6–9.3, 21.3–24.6, 31.7–34.1, 83–86),
6H (16.9–24.6)
1H (76–48), 2H (112–115), 5H (44–45)
GENSTAT
[36,38,39]
1H (116–123),
5H (120–127, 132–134)
2H (47–48), 3H (51–53), 6H (46–47, 142–143), 7H (1–5)
TASSEL
[110]
TASSEL
[111]
3H (1 5 3), 5H (139–150)
GENSTAT
[86]
1H (10–12, 94–96), 2H (133–136), 5H (13–15)
GENSTAT
[112]
2H (3.5), 4H (1 4 5), 5H (43.5)
2H (82–90), 4H (106–119), 5H (100–113, 119–130)
TASSEL
GENSTAT
[88]
[67]
2H (110–115, 145–155), 3H (95–100), 5H (160–170)
2H (106–107), 7H (1.6–15)
4H (111.3)
2H (140–145)
4H (3–4, 110–114)
3H (131–136), 6H (63–64)
1H (5), 3H (104.3, 135.6), 5H (169.4)
1H (64–65), 2H (3–4, 14–15), 3H (126–127), 5H (86–87, 130–
131), 6H (44–45, 95–96)
2H (118–119), 3H (24–25), 4H (49–55), 5H (48–49, 147–148)
GENSTAT
TASSEL
SAS
TASSEL
GENSTAT
TASSEL
[97]
[96]
[73]
[66]
[57,74]
[94]
[95]
[85]
TASSEL
[87]
9 K SNP
European cultivars
183
253 DArT & 22 SSR
German winter
106
1,169 DArT
Barley Germplasm
185
European cultivars
174
710 DArT, 61 SNP and
45 SSR
839 DArT
Worldwide
UK cultivars
206
500
408 DArT
1.5 SNP
Pan-European Barley Cultivar Collection
Jordanian landraces
NAM
379
150
1,420
9 K SNP
9 K SNP
9 K SNP
Kazakhstan collection
EcoSeed
Modern European cultivars
92
184
148
9 K SNP
9 K SNP
407 SSR
Drought tolerance collection
109
5,153 DArT
Germination and seedling shoot and root
architecture traits
TGW, glume fineness, extract and
friability
Grain yield, TGW,
agronomic and quality traits
Drought tolerance related traits (Grain
yield, TGW, peduncle, leaf, and spike)
Grain yield, TGW,
agronomic and quality traits
Salinity tolerance
Auricle, awn, spike, rachis, spikelet and
grain-related traits
Grain yield-associated traits
Harvest index & Spikelet number per spike
Leaf sheath hairiness.
Salinity tolerance
Heading time and yield related-traits
Stem rust resistance
Seed dormancy and pre-harvest sprouting
Spike length, plant height and grain
number
Water use efficiency, water content and
relative water content
[52]
A.M. Alqudah et al. / Journal of Advanced Research 22 (2020) 119–135
Reference panel
131
132
A.M. Alqudah et al. / Journal of Advanced Research 22 (2020) 119–135
hybridization of related species e.g. triticale (a cross between
wheat (Triticum turgidum) and rye (Secale cereal)) [99] makes genotyping far behind the diploid crop species and slowed down SNP
discovery. A notable challenge in polyploid cereals is how to
assemble and distinguish the homologous SNPs among the genotypes and subgenomes and/or paralogous SNPs due to duplicated
copies and transposable element. High sequence similarity among
the subgenomes impedes discovering the homologous variations
which are important for understanding the genetic factor underlying the quantitative traits in polyploid crops. The redundancy of
homoeologs among the subgenomes can curb important phenotypic variation. Genetic studies in polyploid cereal crops required
high-density, quality and number of SNPs through highthroughput SNP genotyping to overcome on complexity and size
of genomes. For instance, SNP arrays achieved noticeable progress
in SNP polymorphic rates and size had been developed in wheat 9 K,
90 K, 35 K, 135 K and 820 K SNP [100]. Prior to attempting GWAS in
polyploid crops, some important points must be carefully considered, e.g. how to detect and define the rare alleles, to which subgenome the allele belongs and how to deal with the effect of
population structure and which subgenome contributes more to
the structure and variation in addition to LD and it’s decay. The
recent advances in the genome sequence in allopolyploid crops
e.g. bread wheat and its diploid and tetraploid progenitors
[101–104] help the researchers in distinguishing among homologous copies carried by subgenomes. The new technologies lead to
de novo assembly of the chromosomes that reduce the complexity
by assembling the highly redundant genome and assign the genes.
Sequencing ancestral diploids aid the assigning of specific sequences
to the diploid progenitor. The emergence of the pan-genome in crops
will improve the sequence coverage and quality. It will lead to
develop a core genome that contains all shared sequences in all
sequenced individuals and add the absent/present genes [105].
In wheat, the Wheat@URGI (Unité de Recherche Génomique
Info) databases and tools to discover genetic and genomic wheat
data according to IWGSC reference sequences, physical maps,
genetic maps, polymorphisms, genetic resources, phenotypes and
arrays [106]. It maintained and hosted by a research unit in genomics and bioinformatics at Institut National de la Recherche Agronomique (INRA). WheatMine website />WheatMine/begin.do.
It is also possible to blast the targeted sequences at the specific
chromosome and ancestral diploid using blasting server https://
urgi.versailles.inra.fr/blast_iwgsc/blast.php.
The output contains the gene description including annotation,
GO Terms and other useful information. High-quality reference
genomes and gene discovery, using high quality de novo genome
assembly improve the GWAS analysis to discover the candidate
gene using the physical position of linked SNP markers with the
natural variation. Using SNP arrays for genotyping, researchers
working on wheat were able to detect candidate genes for grain
yield-related traits [46,47,80,107,108].
Even though promising progress in polyploidy cereals genomics
analysis has been made in last few years, most genetic studies in
polyploids e.g. wheat have so far relied on diploid models i.e. barley to simplify the polyploid data and overcome of the aforementioned obstacles in wheat. Barley has been a model for genetic
and cytogenetic studies in last decades due to many features e.g.
low chromosome number, dozens morphological and cytological
mutants, thousands of genetic stocks, genetic mutant stocks for
reverse genetics approaches e.g. Targeting Induced Local Lesions
IN Genomes (TILLING) are available. In addition to advances in
gene editing e.g. Cas9 and its close evolutionary distance and
extensive conservation of synteny, barley is a useful genomic
model for wheat and other polyploidy cereals.
Future applications of GWAS strategy in crop improvement
The knowledge of natural variation in barley as a model crop for
small grain cereals has advanced tremendously in the past years. In
the near future, GWAS in barley will be more informative using the
advances in the genomic sequence, high-throughput SNP genotyping with the impressive set of genetic resources that are available
at the genebank e.g. IPK. The GWAS output can be implemented
and used in many aspects, for instance, breeding, genetic mapping,
candidate genes, and gene editing. Highly accurate phenotyping by
researchers or high- throughput phenotyping platforms will also
increase the power of GWAS in detecting novel loci. Such advances
provide resources that improve and facilitate breeding, genomic
and genetic analysis of important agronomic traits in crops. More
deep analysis for the detected causative loci by GWAS e.g.
haplotype-based analysis is a key for genomics-assisted crop
breeding. GWAS has a higher resolution because of more recombination events, and more genotypes can be used for a broader
genetic base compared with biparental QTL mapping. GWAS in
future barley work should be considered as an exploratory analysis
for the right selection of true segregating parents that can be used
in the QTL mapping population and for further genetic and molecular validation of the associations. GWAS can also used to understand breeding-program variation (the genetic variation in the
association panel used to develop improved plant material) or
marker-assisted selection (selection of individuals for breeding
program based on their genotypic information at specific allele
linked to QTL) because the association mapping population can
be considered as a source of alleles which are not or rarely present
in the bi-parental mapping populations.
Recently, many studies used QTL mapping and association mapping to identify and validate QTL associated with target traits e.g.
in maize [68], faba bean [48] and brassica [69]. This approach using
both populations to check whether the significant markers associated with the same trait in two different genetic backgrounds or
not [109]. There is no study in barley using this approach; therefore, it could be very useful to consider it in barley to genetically
improve breeding target traits. The association mapping population is a source of allelic variation including the domestication alleles which are mostly present in wild relatives and landraces offers
an excellent resource to increase the discovery of functional loci/genes underlying genetic variation for complex traits including
yield, disease resistance, and abiotic stress tolerance. The analyses
allow predicting the function of many alleles representing mutations and candidate genes which have an agronomic impact, hence
can be used in further molecular validation e.g. gene expression
and gene editing. With the help of statisticians and bioinformaticians, the analysis of complex traits in crops will be much
improved through developing more databases and statistical models. Integrating -omics and genetics will be crucial for crop
improvement and molecular analyses. The extension of the analysis of natural variation to the molecular mechanism will elucidate
the mechanisms involved in barley plant development and
adaptation.
Compliance with Ethics Requirements
This article does not contain any studies with human or animal
subjects.
Declaration of Competing Interest
The authors have declared no conflict of interest.
A.M. Alqudah et al. / Journal of Advanced Research 22 (2020) 119–135
Acknowledgment
The work was supported by Leibniz Institute of Plant Genetics
and Crop Plant Research (IPK) core budget.
References
[1] Alonso-Blanco C, Aarts MG, Bentsink L, Keurentjes JJ, Reymond M,
Vreugdenhil D, et al. What has natural variation taught us about plant
development, physiology, and adaptation?. Plant Cell 2009;21(7):1877–96.
[2] Badr A, Muller K, Schafer-Pregl R, El Rabey H, Effgen S, Ibrahim HH, et al. On
the origin and domestication history of Barley (Hordeum vulgare). Mol Biol
Evol 2000;17(4):499–510.
[3] Mitchell-Olds T, Willis JH, Goldstein DB. Which evolutionary processes
influence natural genetic variation for phenotypic traits?. Nat Rev Genet
2007;8(11):845–56.
[4] Pourkheirandish M, Hensel G, Kilian B, Senthil N, Chen G, Sameri M, et al.
Evolution of the Grain Dispersal System in Barley. Cell 2015;162(3):527–39.
[5] Komatsuda T, Pourkheirandish M, He C, Azhaguvel P, Kanamori H, Perovic D,
et al. Six-rowed barley originated from a mutation in a homeodomain-leucine
zipper I-class homeobox gene. PNAS 2007;104(4):1424–9.
[6] Wambugu PW, Ndjiondjop MN, Henry RJ. Role of genomics in promoting the
utilization of plant genetic resources in genebanks. Brief Funct Genomics.
2018;17(3):198–206.
[7] Langridge P. Economic and Academic Importance of Barley. In: Stein N,
Muehlbauer GJ, editors. The Barley Genome. Compendium of Plant Genomes.
Cham: Springer International Publishing; 2018. p. 1-10.
[8] FAOSTAT. The Food and Agriculture Organization of the United Nations7
[Available from: />[9] Knüpffer H. Triticeae Genetic Resources in ex situ Genebank Collections. In:
Muehlbauer GJ, Feuillet C, editors. Genetics and Genomics of the
Triticeae. New York, NY: Springer US; 2009. p. 31–79.
[10] Mascher M, Gundlach H, Himmelbach A, Beier S, Twardziok SO, Wicker T,
et al. A chromosome conformation capture ordered sequence of the barley
genome. Nature 2017;544(7651):427–33.
[11] Comadran J, Kilian B, Russell J, Ramsay L, Stein N, Ganal M, et al. Natural
variation in a homolog of Antirrhinum CENTRORADIALIS contributed to spring
growth habit and environmental adaptation in cultivated barley. Nat Genet
2012;44(12):1388–92.
[12] Bayer MM, Rapazote-Flores P, Ganal M, Hedley PE, Macaulay M, Plieske J,
et al. Development and Evaluation of a Barley 50k iSelect SNP Array. Front
Plant Sci. 2017;8:1792.
[13] Mascher M, Muehlbauer GJ, Rokhsar DS, Chapman J, Schmutz J, Barry K, et al.
Anchoring and ordering NGS contig assemblies by population sequencing
(POPSEQ). Plant J: Cell Mol Biol 2013;76(4):718–27.
[14] Poland JA, Brown PJ, Sorrells ME, Jannink JL. Development of high-density
genetic maps for barley and wheat using a novel two-enzyme genotyping-bysequencing approach. PLoS ONE 2012;7(2):e32253.
[15] Liu H, Bayer M, Druka A, Russell JR, Hackett CA, Poland J, et al. An evaluation
of genotyping by sequencing (GBS) to map the Breviaristatum-e (ari-e) locus
in cultivated barley. BMC Genomics 2014;15(1):104.
[16] Backes G, Graner A, Foroughi-Wehr B, Fischbeck G, Wenzel G, Jahoor A.
Localization of quantitative trait loci (QTL) for agronomic important
characters by the use of a RFLP map in barley (Hordeum vulgare L.). TAG
Theoretical and applied genetics Theoretische und angewandte. Genetik.
1995;90(2):294–302.
[17] Laurie DA, Pratchett N, Snape JW, Bezant JH. RFLP mapping of five major
genes and eight quantitative trait loci controlling flowering time in a winter x
spring barley (Hordeum vulgare L.) cross. Genome/National Research Council
Canada = Genome/Conseil national de recherches Canada. 1995;38
(3):575–85.
[18] Varshney RK, Marcel TC, Ramsay L, Russell J, Roder MS, Stein N, et al. A high
density barley microsatellite consensus map with 775 SSR loci. TAG
Theoretical and applied genetics Theoretische und angewandte Genetik.
2007;114(6):1091–103.
[19] Romero CCT, Vels A, Niks RE. Identification of a large-effect QTL associated
with kernel discoloration in barley. J Cereal Sci 2018;84:62–70.
[20] Gudys K, Guzy-Wrobelska J, Janiak A, Dziurka MA, Ostrowska A, Hura K, et al.
Prioritization of candidate genes in QTL regions for physiological and
biochemical traits underlying drought response in barley (Hordeum vulgare
L.). Front. Plant Sci. 2018;9:769.
[21] Mikolajczak K, Ogrodowicz P, Gudys K, Krystkowiak K, Sawikowska A,
Frohmberg W, et al. Quantitative trait loci for yield and yield-related traits in
spring barley populations derived from crosses between european and syrian
cultivars. PLoS ONE 2016;11(5):e0155938.
[22] Huang Y, Haas M, Heinen S, Steffenson BJ, Smith KP, Muehlbauer GJ. QTL
mapping of fusarium head blight and correlated agromorphological traits in
an elite barley cultivar rasmusson. Front Plant Sci. 2018;9:1260.
[23] Xue DW, Zhou MX, Zhang XQ, Chen S, Wei K, Zeng FR, et al. Identification of
QTLs for yield and yield components of barley under different growth
conditions. J Zhejiang Univ Sci B. 2010;11(3):169–76.
[24] Schmalenbach I, Leon J, Pillen K. Identification and verification of QTLs for
agronomic traits using wild barley introgression lines. TAG Theoretical and
[25]
[26]
[27]
[28]
[29]
[30]
[31]
[32]
[33]
[34]
[35]
[36]
[37]
[38]
[39]
[40]
[41]
[42]
[43]
[44]
[45]
[46]
[47]
[48]
[49]
[50]
[51]
133
applied genetics Theoretische und angewandte Genetik. 2009;118
(3):483–97.
Rollins JA, Drosse B, Mulki MA, Grando S, Baum M, Singh M, et al. Variation at
the vernalisation genes Vrn-H1 and Vrn-H2 determines growth and yield
stability in barley (Hordeum vulgare) grown under dryland conditions in
Syria. TAG Theoretical and applied genetics Theoretische und angewandte
Genetik. 2013;126(11):2803–24.
Mitchell-Olds T. Complex-trait analysis in plants. Genome Biol 2010;11
(4):113.
Yan G, Liu H, Wang H, Lu Z, Wang Y, Mullan D, et al. Accelerated generation of
selfed pure line plants for gene identification and crop breeding. Front Plant
Sci. 2017;8:1786.
Liller CB, Walla A, Boer MP, Hedley P, Macaulay M, Effgen S, et al. Fine
mapping of a major QTL for awn length in barley using a multiparent
mapping population. TAG Theoretical and applied genetics Theoretische und
angewandte Genetik. 2017;130(2):269–81.
Huang X, Han B. Natural variations and genome-wide association studies in
crop plants. Annu Rev Plant Biol 2014;65(1):531–51.
Rafalski JA. Association genetics in crop improvement. Curr Opin Plant Biol
2010;13(2):174–80.
Flint-Garcia SA, Thornsberry JM. Buckler ESt. Structure of linkage
disequilibrium in plants. Annu Rev Plant Biol 2003;54(1):357–74.
Tenaillon MI, Sawkins MC, Long AD, Gaut RL, Doebley JF, Gaut BS. Patterns of
DNA sequence polymorphism along chromosome 1 of maize (Zea mays ssp.
mays L.). Proceedings of the National Academy of Sciences of the United
States of America. 2001;98(16): pp. 9161–6.
Nordborg M, Borevitz JO, Bergelson J, Berry CC, Chory J, Hagenblad J, et al. The
extent of linkage disequilibrium in Arabidopsis thaliana. Nat Genet 2002;30
(2):190–3.
Stracke S, Presterl T, Stein N, Perovic D, Ordon F, Graner A. Effects of
introgression and recombination on haplotype structure and linkage
disequilibrium surrounding a locus encoding Bymovirus resistance in
barley. Genetics 2007;175(2):805–17.
Caldwell KS, Russell J, Langridge P, Powell W. Extreme population-dependent
linkage disequilibrium detected in an inbreeding plant species. Hordeum
vulgare. Genetics. 2006;172(1):557–67.
Alqudah AM, Sharma R, Pasam RK, Graner A, Kilian B, Schnurbusch T. Genetic
dissection of photoperiod response based on GWAS of pre-anthesis phase
duration in spring barley. PLoS ONE 2014;9(11):e113120.
Li JZ, Huang XQ, Heinrichs F, Ganal MW, Roder MS. Analysis of QTLs for yield
components, agronomic traits, and disease resistance in an advanced
backcross population of spring barley. Genome/National Research Council
Canada = Genome/Conseil national de recherches Canada. 2006;49
(5):454–66.
Alqudah AM, Koppolu R, Wolde GM, Graner A, Schnurbusch T. The Genetic
Architecture of Barley Plant Stature. Front Genet. 2016;7:117.
Alqudah AM, Youssef HM, Graner A, Schnurbusch T. Natural variation and
genetic make-up of leaf blade area in spring barley. TAG Theoretical and
applied genetics Theoretische und angewandte Genetik. 2018;131
(4):873–86.
Pasam RK, Sharma R, Malosetti M, van Eeuwijk FA, Haseneyer G, Kilian B,
et al. Genome-wide association studies for agronomical traits in a world wide
spring barley collection. BMC Plant Biol 2012;12:16.
Digel B, Tavakol E, Verderio G, Tondelli A, Xu X, Cattivelli L, et al. PhotoperiodH1 (Ppd-H1) Controls Leaf Size. Plant Physiol 2016;172(1):405–15.
Wang M, Jiang N, Jia T, Leach L, Cockram J, Comadran J, et al. Genome-wide
association mapping of agronomic and morphologic traits in highly
structured populations of barley cultivars. TAG Theoretical and applied
genetics Theoretische und angewandte Genetik. 2012;124(2):233–46.
Bykova IV, Lashina NM, Efimov VM, Afanasenko OS, Khlestkina EK.
Identification of 50 K Illumina-chip SNPs associated with resistance to spot
blotch in barley. BMC Plant Biol 2017;17(Suppl 2):250.
Kumar J, Pratap A, Solanki RK, Gupta DS, Goyal A, Chaturvedi SK, et al.
Genomic resources for improving food legume crops. J Agric Sci 2012;150
(3):289–318.
Milner SG, Jost M, Taketa S, Mazon ER, Himmelbach A, Oppermann M, et al.
Genebank genomics highlights the diversity of a global barley collection. Nat
Genet 2019;51(2):319–26.
Mourad AMI, Sallam A, Belamkar V, Mahdy E, Bakheit B, Abo El-Wafaa A, et al.
Genetic architecture of common bunt resistance in winter wheat using
genome-wide association study. BMC Plant Biol 2018;18(1):280.
Mourad AMI, Sallam A, Belamkar V, Wegulo S, Bowden R, Jin Y, et al. Genomewide association study for identification and validation of novel SNP markers
for Sr6 stem rust resistance gene in bread wheat. Front Plant Sci. 2018;9:380.
Sallam A, Arbaoui M, El-Esawi M, Abshire N, Martsch R. Identification and
verification of QTL associated with frost tolerance using linkage mapping and
GWAS in winter faba bean. Front Plant Sci. 2016;7(1098):1098.
Pritchard JK, Stephens M, Donnelly P. Inference of population structure using
multilocus genotype data. Genetics 2000;155(2):945–59.
Price AL, Patterson NJ, Plenge RM, Weinblatt ME, Shadick NA, Reich D.
Principal components analysis corrects for stratification in genome-wide
association studies. Nat Genet 2006;38(8):904–9.
Yu J, Pressoir G, Briggs WH, Vroh Bi I, Yamasaki M, Doebley JF, et al. A unified
mixed-model method for association mapping that accounts for multiple
levels of relatedness. Nat Genet 2006;38(2):203–8.
134
A.M. Alqudah et al. / Journal of Advanced Research 22 (2020) 119–135
[52] Thabet SG, Moursi YS, Karam MA, Graner A, Alqudah AM. Genetic basis of
drought tolerance during seed germination in barley. PLoS ONE 2018;13(11):
e0206682.
[53] Nagel M, Alqudah AM, Bailly M, Rajjou L, Pistrick S, Matzig G, et al. Novel loci
and a role for nitric oxide for seed dormancy and pre-harvest sprouting in
barley. Plant, Cell & Environment. 2018.
[54] Earl DA, Vonholdt BM. STRUCTURE HARVESTER: a website and program for
visualizing STRUCTURE output and implementing the Evanno method.
Conserv Genet Resour 2012;4(2):359–61.
[55] Soto-Cerda BJ, Cloutier S. Association mapping in plant genomes. Genetic
diversity in plants. InTech 2012.
[56] Youssef HM, Eggert K, Koppolu R, Alqudah AM, Poursarebani N, Fazeli A, et al.
VRS2 regulates hormone-mediated inflorescence patterning in barley. Nat
Genet 2017;49(1):157–61.
[57] Maurer A, Draba V, Jiang Y, Schnaithmann F, Sharma R, Schumann E, et al.
Modelling the genetic architecture of flowering time control in barley
through nested association mapping. BMC Genomics 2015;16:290.
[58] Sannemann W, Huang BE, Mathew B, Leon J. Multi-parent advanced
generation inter-cross in barley: high-resolution quantitative trait locus
mapping for flowering time as a proof of concept. Mol Breed 2015;35(3):86.
[59] Llinares-Lopez F, Papaxanthos L, Bodenham D, Roqueiro D, Investigators CO,
Borgwardt K. Genome-wide genetic heterogeneity discovery with categorical
covariates. Bioinformatics 2017;33(12):1820–8.
[60] Myles S, Peiffer J, Brown PJ, Ersoz ES, Zhang Z, Costich DE, et al. Association
mapping: critical considerations shift from genotyping to experimental
design. Plant Cell 2009;21(8):2194–202.
[61] Semagn K, Bjornstad A, Xu YB. The genetic dissection of quantitative traits in
crops. Electron J Biotechnol 2010;13(5).
[62] Sallam A, Martsch R. Association mapping for frost tolerance using multiparent advanced generation inter-cross (MAGIC) population in faba bean
(Vicia faba L.). Genetica 2015;143(4):501–14.
[63] Fedoruk M. Linkage and Association Mapping of Seed Size And Shape In
Lentil. University of Saskatchewan; 2013.
[64] Alqudah AM. Developmental and Genetic Analysis of Pre-anthesis Phases in
Barley (HordeumvulgareL.) [cumulative]. Martin-Luther-University HalleWittenberg; 2015.
[65] Anderson R, Edwards D, Batley J, Bayer PEJe. Genome-Wide Association
Studies in Plants. eLS 2019:1–7.
[66] Saade S, Maurer A, Shahid M, Oakey H, Schmockel SM, Negrao S, et al. Yieldrelated salinity tolerance traits identified in a nested association mapping
(NAM) population of wild barley. Sci Rep 2016;6:32586.
[67] Cockram J, White J, Zuluaga DL, Smith D, Comadran J, Macaulay M, et al.
Genome-wide association mapping to candidate polymorphism resolution in
the unsequenced barley genome. PNAS 2010;107(50):21611–6.
[68] Zhao X, Luo L, Cao Y, Liu Y, Li Y, Wu W, et al. Genome-wide association
analysis and QTL mapping reveal the genetic control of cadmium
accumulation in maize leaf. BMC Genomics 2018;19(1):91.
[69] He Y, Wu D, Wei D, Fu Y, Cui Y, Dong H, et al. GWAS, QTL mapping and gene
expression analyses in Brassica napus reveal genetic control of branching
morphogenesis. Sci Rep 2017;7(1):15971.
[70] Xu S. Theoretical basis of the Beavis effect. Genetics 2003;165(4):2259–68.
[71] Piepho HP, Möhring J, Melchinger AE, Büchse A. BLUP for phenotypic
selection in plant breeding and variety testing. Euphytica 2007;161(1–
2):209–28.
[72] Bandillo N, Raghavan C, Muyco PA, Sevilla MA, Lobina IT, Dilla-Ermita CJ, et al.
Multi-parent advanced generation inter-cross (MAGIC) populations in rice:
progress and potential for genetics research and breeding. Rice (N Y). 2013;6
(1):11.
[73] Saade S, Kutlu B, Draba V, Forster K, Schumann E, Tester M, et al. A donorspecific QTL, exhibiting allelic variation for leaf sheath hairiness in a nested
association mapping population, is located on barley chromosome 4H. PLoS
ONE 2017;12(12):e0189446.
[74] Maurer A, Draba V, Pillen K. Genomic dissection of plant development and its
impact on thousand grain weight in barley through nested association
mapping. J Exp Bot 2016;67(8):2507–18.
[75] Storey JD, Tibshirani R. Statistical significance for genomewide studies. PNAS
2003;100(16):9440–5.
[76] Bradbury PJ, Zhang Z, Kroon DE, Casstevens TM, Ramdoss Y, Buckler ES.
TASSEL: software for association mapping of complex traits in diverse
samples. Bioinformatics 2007;23(19):2633–5.
[77] Houston K, McKim SM, Comadran J, Bonar N, Druka I, Uzrek N, et al. Variation
in the interaction between alleles of HvAPETALA2 and microRNA172
determines the density of grains on the barley inflorescence. PNAS
2013;110(41):16675–80.
[78] Rentería ME, Cortes A, Medland SE. Using PLINK for Genome-Wide
Association Studies (GWAS) and Data Analysis. In: Gondro C, van der Werf
J, Hayes B, editors. Genome-Wide Association Studies and Genomic
Prediction. Totowa, NJ: Humana Press; 2013. p. 193–213.
[79] Lipka AE, Tian F, Wang Q, Peiffer J, Li M, Bradbury PJ, et al. GAPIT: genome
association and prediction integrated tool. Bioinformatics 2012;28
(18):2397–9.
[80] Alomari DZ, Eggert K, von Wiren N, Alqudah AM, Polley A, Plieske J, et al.
Identifying candidate genes for enhancing grain zn concentration in wheat.
Front Plant Sci. 2018;9:1313.
[81] Ramsay L, Comadran J, Druka A, Marshall DF, Thomas WT, Macaulay M, et al.
INTERMEDIUM-C, a modifier of lateral spikelet fertility in barley, is an
[82]
[83]
[84]
[85]
[86]
[87]
[88]
[89]
[90]
[91]
[92]
[93]
[94]
[95]
[96]
[97]
[98]
[99]
[100]
[101]
[102]
[103]
[104]
[105]
[106]
[107]
ortholog of the maize domestication gene TEOSINTE BRANCHED 1. Nat Genet
2011;43(2):169–72.
Hazzouri KM, Khraiwesh B, Amiri KMA, Pauli D, Blake T, Shahid M, et al.
Mapping of HKT1;5 Gene in Barley Using GWAS Approach and Its Implication
in Salt Tolerance Mechanism. Front Plant Sci. 2018;9(156):156.
Turner A, Beales J, Faure S, Dunford RP, Laurie DA. The pseudo-response
regulator Ppd-H1 provides adaptation to photoperiod in barley. Science
2005;310(5750):1031–4.
Thirulogachandar V, Alqudah AM, Koppolu R, Rutten T, Graner A, Hensel G,
et al. Leaf primordium size specifies leaf width and vein number among rowtype classes in barley. Plant J: For Cell Mol Biol 2017;91(4):601–12.
Jabbari M, Fakheri BA, Aghnoum R, Mahdi Nezhad N, Ataei R. GWAS analysis
in spring barley (Hordeum vulgare L.) for morphological traits exposed to
drought. PLoS ONE 2018;13(9):e0204952.
Varshney RK, Paulo MJ, Grando S, van Eeuwijk FA, Keizer LCP, Guo P, et al.
Genome wide association analyses for drought tolerance related traits in
barley (Hordeum vulgare L.). Field Crops Research. 2012;126:171–80.
Wojcik-Jagla M, Fiust A, Koscielniak J, Rapacz M. Association mapping of
drought tolerance-related traits in barley to complement a traditional
biparental QTL mapping study. TAG Theoretical and applied genetics
Theoretische und angewandte Genetik. 2018;131(1):167–81.
Fan Y, Zhou G, Shabala S, Chen ZH, Cai S, Li C, et al. Genome-Wide Association
Study Reveals a New QTL for Salinity Tolerance in Barley (Hordeum vulgare
L.). Front. Plant Sci 2016;7(946):946.
Belcher AR, Cuesta-Marcos A, Smith KP, Mundt CC, Chen XM, Hayes PM. TCAP
FAC-WIN6 Elite Barley GWAS Panel QTL. I. Barley Stripe Rust Resistance QTL
in Facultative and Winter Six-Rowed Malt Barley Breeding Programs
Identified via GWAS. Crop Sci 2018;58(1):103–19.
Bedawy IMA, Dehne HW, Leon J, Naz AA. Mining the global diversity of barley
for Fusarium resistance using leaf and spike inoculations. Euphytica
2018;214(1).
Amezrou R, Verma RPS, Chao SM, Brueggeman RS, Belqadi L, Arbaoui M, et al.
Genome-wide association studies of net form of net blotch resistance at seedling
and adult plant stages in spring barley collection. Mol Breed 2018;38(5).
Sallam AH, Tyagi P, Brown-Guedira G, Muehlbauer GJ, Hulse A, Steffenson BJ.
Genome-Wide Association Mapping of Stem Rust Resistance in Hordeum
vulgare subsp. spontaneum. G3. 2017;7(10): pp 3491–507.
Richards JK, Friesen TL, Brueggeman RS. Association mapping utilizing diverse
barley lines reveals net form net blotch seedling resistance/susceptibility loci.
TAG Theoretical and applied genetics Theoretische und angewandte Genetik.
2017;130(5):915–27.
Turuspekov Y, Ormanbekova D, Rsaliev A, Abugalieva S. Genome-wide
association study on stem rust resistance in Kazakh spring barley lines.
BMC Plant Biology 2016;16 Suppl 1(1):6.
Nagel M, Alqudah AM, Bailly M, Rajjou L, Pistrick S, Matzig G, et al. Novel loci
and a role for nitric oxide for seed dormancy and preharvest sprouting in
barley. Plant, Cell Environ 2019;42(4):1318–27.
Al-Abdallat AM, Karadsheh A, Hadadd NI, Akash MW, Ceccarelli S, Baum M,
et al. Assessment of genetic diversity and yield performance in Jordanian
barley (Hordeum vulgare L.) landraces grown under Rainfed conditions. BMC
Plant Biol 2017;17(1):191.
Xu X, Sharma R, Tondelli A, Russell J, Comadran J, Schnaithmann F, et al.
Genome-Wide Association Analysis of Grain Yield-Associated Traits in a PanEuropean Barley Cultivar Collection. Plant Genome-Us. 2018;11(1).
Mascher M, Gundlach H, Himmelbach A, Beier S, Twardziok SO, Wicker T,
et al. A chromosome conformation capture ordered sequence of the barley
genome. Nature 2017;544:427.
Gupta PK, Priyadarshan PM. Triticale: Present Status and Future Prospects. In:
Caspari EW, editor. Advances in Genetics. 21: Academic Press; 1982. p. 255345.
You Q, Yang X, Peng Z, Xu L, Wang J. Development and applications of a high
throughput genotyping tool for polyploid crops: single nucleotide
polymorphism (SNP) array. Front Plant Sci. 2018;9:104.
Maccaferri M, Harris NS, Twardziok SO, Pasam RK, Gundlach H, Spannagl M,
et al. Durum wheat genome highlights past domestication signatures and
future improvement targets. Nat Genet 2019;51(5):885–95.
Ling HQ, Ma B, Shi X, Liu H, Dong L, Sun H, et al. Genome sequence of the
progenitor of wheat A subgenome Triticum urartu. Nature 2018;557
(7705):424–8.
International Wheat Genome Sequencing C, investigators IRp, Appels R,
Eversole K, Feuillet C, Keller B, et al. Shifting the limits in wheat research and
breeding using a fully annotated reference genome. Science. 2018; 361
(6403).
Luo MC, Gu YQ, Puiu D, Wang H, Twardziok SO, Deal KR, et al. Genome
sequence of the progenitor of the wheat D genome Aegilops tauschii. Nature
2017;551(7681):498–502.
Kyriakidou M, Tai HH, Anglin NL, Ellis D, Stromvik MV. Current strategies of
polyploid plant genome sequence assembly. Front Plant Sci. 2018;9
(1660):1660.
Alaux M, Rogers J, Letellier T, Flores R, Alfama F, Pommier C, et al. Linking the
International Wheat Genome Sequencing Consortium bread wheat reference
genome sequence to wheat genetic and phenomic data. Genome Biol
2018;19(1):111.
Yan X, Zhao L, Ren Y, Dong Z, Cui D, Chen F. Genome-wide association study
revealed that the TaGW8 gene was associated with kernel size in Chinese
bread wheat. Sci Rep 2019;9(1):2702.
A.M. Alqudah et al. / Journal of Advanced Research 22 (2020) 119–135
[108] Alomari DZ, Eggert K, von Wiren N, Polley A, Plieske J, Ganal MW, et al.
Whole-genome association mapping and genomic prediction for iron
concentration in wheat grains. Int J Mol Sci. 2018;20(1):76.
[109] Nilthong S, Graybosch RA, Baenziger PS. Inheritance of grain polyphenol
oxidase (PPO) activity in multiple wheat (Triticum aestivum L.) genetic
backgrounds. TAG Theoretical and applied genetics Theoretische und
angewandte. Genetik. 2012;125(8):1705–15.
[110] Matthies IE, van Hintum T, Weise S, Roder MS. Population structure revealed
by different marker types (SSR or DArT) has an impact on the results of
genome-wide association mapping in European barley cultivars. Mol Breed
2012;30(2):951–66.
[111] Lex J, Ahlemeyer J, Friedt W, Ordon F. Genome-wide association studies of
agronomic and quality traits in a set of German winter barley (Hordeum
vulgare L.) cultivars using Diversity Arrays Technology (DArT). J Appl Genet.
2014;55(3):295–305.
[112] Matthies IE, Malosetti M, Roder MS, van Eeuwijk F. Genome-wide association
mapping for kernel and malting quality traits using historical European
barley records. PLoS ONE 2014;9(11):e110046.
Ahmad Alqudah is a young scientist with extensive
expertise in agronomy, plant breeding, genetics and
bioinformatics. He received BSc in 2005 and then MSc in
Field Crops Production focused on abiotic stress physiology from Jordan University of Science and Technology
(Jordan) in 2007. In 2015, he completed his Ph.D. in
Plant Breeding and Genetics at the Martin-LutherUniversity Halle-Wittenberg (Germany). Since then, he
is a postdoctoral research scientist at IPK Gatersleben
(Germany) as a Cereal Geneticist aims to understand the
underlying molecular genetic factors of agronomic,
developmental, adaptive and grain yield-related traits
in wheat and barley. He is using a recently developed
Next-Generation Sequencing (NGS) technologies such as Genotyping-bySequencing and RNA-Seq with his outstanding bioinformatics skills to discover
QTL or genes throught QTL mapping, GWAS in addition to genmoic prediction.
Dr. Ahmed Sallam is an Associate Professor (Promoted
by Scientific Excellence Track, 2019) in the Department
of Genetics at Assiut University, Egypt. He earned
degrees from Department of Genetics, Assiut University,
Egypt (BSc and MSc) and Division of Plant Breeding,
University of Goettingen, Germany (PhD). His research
interest is improving abiotic and biotic stress tolerance
in cereals and legumes using QTL mapping, genome
wide association study, and genomic selection.
135
P. (Peter) Stephen Baenziger earned degrees from Harvard and Purdue Universities. Before joining the faculty
at the University of Ne:braska, he worked eight years
for the USDA-ARS, and three years with Monsanto
Corporation. His research focuses on improving the
agronomic performance and winterhardiness of small
grains (winter wheat, barley, and triticale) and on
developing new breeding methods. He has co-released
60 cultivars and 36 germplasm lines or populations. His
teaching and service activities emphasize graduate
education and outreach in plant breeding and genetics,
as well as, leadership roles in numerous scientific societies, international centers, and initiatives.
Andreas Börner received his PhD in Plant Breeding and
Plant Genetics from the Martin-Luther-University,
Halle-Wittenberg in 1988. Today he is responsible for
the management of the Gatersleben genebank collection, which entails the long-term storage, multiplication
and distribution of the germplasm. Major research foci
concern an extensive programme of germplasm evaluation and genetic characterisation. He is the President
Designate of the European Association for Research on
Plant Breeding (EUCARPIA).