Determination of cellular processing rates for a Trastuzumab-Maytansinoid antibody-drug conjugate (ADC) highlights key parameters for ADC design
Bạn đang xem bản rút gọn của tài liệu. Xem và tải ngay bản đầy đủ của tài liệu tại đây (1008.07 KB, 12 trang )
The AAPS Journal, Vol. 18, No. 3, May 2016 ( # 2016)
DOI: 10.1208/s12248-016-9892-3
Research Article
Theme: Systems Pharmacokinetics Models for Antibody-Drug Conjugates
Guest Editor: Dhaval K. Shah
Determination of Cellular Processing Rates for a Trastuzumab-Maytansinoid
Antibody-Drug Conjugate (ADC) Highlights Key Parameters for ADC Design
Katie F. Maass,1,2 Chethana Kulkarni,3 Alison M. Betts,4 and K. Dane Wittrup1,2,5,6
Received 13 December 2015; accepted 16 February 2016; published online 24 February 2016
Abstract. Antibody-drug conjugates (ADCs) are a promising class of cancer therapeutics that combine
the specificity of antibodies with the cytotoxic effects of payload drugs. A quantitative understanding of
how ADCs are processed intracellularly can illustrate which processing steps most influence payload
delivery, thus aiding the design of more effective ADCs. In this work, we develop a kinetic model for
ADC cellular processing as well as generalizable methods based on flow cytometry and fluorescence
imaging to parameterize this model. A number of key processing steps are included in the model: ADC
binding to its target antigen, internalization via receptor-mediated endocytosis, proteolytic degradation of
the ADC, efflux of the payload out of the cell, and payload binding to its intracellular target. The model
was developed with a trastuzumab-maytansinoid ADC (TM-ADC) similar to trastuzumab-emtansine (TDM1), which is used in the clinical treatment of HER2+ breast cancer. In three high-HER2-expressing
cell lines (BT-474, NCI-N87, and SK-BR-3), we report for TM-ADC half-lives for internalization of 6–
14 h, degradation of 18–25 h, and efflux rate of 44–73 h. Sensitivity analysis indicates that the
internalization rate and efflux rate are key parameters for determining how much payload is delivered to
a cell with TM-ADC. In addition, this model describing the cellular processing of ADCs can be
incorporated into larger pharmacokinetics/pharmacodynamics models, as demonstrated in the associated
companion paper.
KEY WORDS: antibody-drug conjugate; cellular trafficking; pharmacokinetics/pharmacodynamics; TDM1; trastuzumab emtansine.
INTRODUCTION
Antibody-drug conjugates (ADCs) are an emerging
modality for cancer treatment, designed to selectively deliver
chemotherapeutic payload drugs to tumor cells and reduce
systemic toxicity. ADCs are comprised of an antibody specific
to a cancer-associated antigen, a chemotherapeutic drug, and
a linker to connect the antibody and drug payload. There are
Electronic supplementary material The online version of this article
(doi:10.1208/s12248-016-9892-3) contains supplementary material,
which is available to authorized users.
1
Department of Chemical Engineering, Massachusetts Institute of
Technology, Cambridge, Massachusetts, USA.
2
David H. Koch Institute for Integrative Cancer Research, Massachusetts Institute of Technology, Cambridge, Massachusetts, USA.
3
Oncology Medicinal Chemistry, Worldwide Medicinal Chemistry,
Pfizer, Groton, Connecticut, USA.
4
Translational Research Group, Department of Pharmacokinetics
Dynamics and Metabolism, Pfizer, Groton, Connecticut, USA.
5
Department of Biological Engineering, Massachusetts Institute of
Technology, 77 Massachusetts Ave. 76-261D, Cambridge, Massachusetts 02139, USA.
6
To whom correspondence should be addressed. (e-mail:
)
currently two FDA-approved ADCs available in the USA,
brentuximab vedotin (Adcetris) and trastuzumab emtansine
(T-DM1, Kadcyla) (1), with more than 30 ADCs in clinical
trials (2). Key ADC design parameters include target antigen,
antigen expression level (in normal tissue and tumor), linker
type, conjugation site, conjugation chemistry, drug-toantibody ratio (DAR), and payload drug potency (3,4).
Previous studies have shown that an ADC will traffic
through the body very similarly to its parent antibody, unless the
ADC has a high DAR (5). When an ADC reaches a tumor, the
ADC binds its target antigen on the cancer cell surface. Next,
the ADC is internalized via receptor-mediated endocytosis.
Inside the endosomal/lysosomal compartments, the ADC is
degraded and the payload is released from the antibody. The
payload can then bind its intracellular target, resulting in cell
death. These processing steps are widely accepted in the field (3,
6, 7), but they have not been combined in a complete
quantitative model. Some pharmacokinetic/pharmacodynamic
models for ADCs have been previously established (8–12);
however, the focus of the current work is to develop a cellular
level model that incorporates physiological processing of ADCs.
In order to build our model, we used a trastuzumabmaytansinoid antibody-drug conjugate (TM-ADC), similar to
T-DM1, as the model ADC. The antibody component of TDM1 is the antibody trastuzumab (Herceptin), which binds
635
1550-7416/16/0300-0635/0 # 2016 American Association of Pharmaceutical Scientists
Maass et al.
636
HER2, a member of the human epidermal growth factor
receptor family that is often overexpressed on breast cancer
cells (13). T-DM1 takes advantage of the therapeutic nature
of the antibody itself; upon trastuzumab binding to HER2,
downstream growth signaling is blocked. Additional cytotoxic
effects are achieved with the payload component of T-DM1,
emtansine (DM1), which is a potent microtubule-binding
maytansine drug. DM1 is conjugated to lysine residues in
trastuzumab via a non-cleavable linker.
A number of models have been developed previously to
describe T-DM1 pharmacokinetics/pharmacodynamics (PK/
PD) (14–19). However, these models have focused on PK/PD
at an organism or tissue-specific level and do not incorporate
the cellular-level mechanisms of ADC processing. For our
model, we have focused on the cellular processing of ADCs,
an area which is fundamental to the design and efficacy of
ADCs. Understanding which intracellular processing steps
influence ADC payload delivery, as well as how ADC design
parameters affect the rate of these processing steps, may
enable more rational design of safe and effective ADCs. The
established model and parameters for TM-ADC intracellular
processing described here have also been incorporated into a
larger-scale PK/PD model as described in a companion paper.
MATERIALS AND METHODS
Cell Lines and Materials
BT-474, NCI-N87 (N87), and SK-BR-3 cell lines were
obtained from ATCC. BT-474 and N87 cells were grown in
RPMI 1640 medium (Corning) supplemented with 10% FBS
and 1% penicillin-streptomycin. SK-BR-3 cells were grown in
McCoy’s 5A Medium Modified, with L-Glutamine (Lonza)
supplemented with 10% FBS and 1% penicillin-streptomycin.
Trastuzumab labeled with Alexa Fluor 647 (Tras-647) was
prepared as described previously (20). The trastuzumabmaytansinoid ADC (TM-ADC), which is structurally similar
to T-DM1, was also prepared as described previously (21, 22).
MATLAB software (Mathworks) was used for model predictions and parameter fits. GraphPad Prism software was also
used for parameter fits. Flow cytometry was performed using
a BD Accuri C6 Flow Cytometer.
Alexa Fluor 647 Labeling of TM-ADC (TM-ADC-647)
TM-ADC was labeled using an Alexa Fluor 647 Protein
Labeling Kit (Life Technologies) following the product
manual recommendations, with purification on an AKTA
size exclusion chromatography system (GE Healthcare). The
fluorophore to antibody ratio was 2–7.5 based on absorbance
at 280 and 647 nm.
Model Development
We used standard biomolecular kinetic methods (23) to
develop material balances for each species as given in
Eqs. (1)–(6). The variables used in the model are as follows:
[Ab] Concentration of ADC in cell growth media (M)
R
Number of free surface receptors (HER2) per cell
(#/cell)
C
I
D
N
Number of ADC-receptor complexes per cell (#/cell)
Number of internalized, intact ADCs per cell (#/cell)
Number of degraded ADCs per cell (#/cell)
Concentration of cells in well (# cells/L)
The model parameters are as follows:
kon
koff
KD
ke
kdeg
kout
μ
Vs
HER2
Nav
Association rate constant (h−1 M−1)
Dissociation rate constant (h−1)
Equilibrium dissociation constant (M)
Net internalization rate constant (h−1)
Degradation rate constant (h−1)
Efflux rate constant (h−1)
Cell growth rate (h−1)
Receptor synthesis rate (#/(cell h))
Total number of HER2 receptors per cell (#/cell)
Avogadro’s number (6.02 × 10²³ #/mol)
dR
¼ −kon ½AbR þ koff C þ V s −ke R−μR
dt
ð1Þ
dC
¼ kon ½AbR−koff C−ke C−μC
dt
ð2Þ
dI
¼ ke C−kdeg I−μI
dt
ð3Þ
dD
¼ kdeg I−kout D−μD
dt
ð4Þ
Á N
d½Ab À
¼ koff C−kon R½Ab
dt
N Av
ð5Þ
dN
¼ μN
dt
ð6Þ
The terms kon[Ab]R and koffC represent the association of
ADC with the surface receptor (HER2) and dissociation of
ADC from receptor, respectively. The equilibrium dissociation
constant, KD, is equal to koff/kon. The internalization of receptor
or antibody-receptor complex is given by keR or keC, respectively. Note that there may be recycling of the receptor or
antibody-receptor complex back to the cell surface; however,
the internalization rate used here is the net internalization, i.e.,
the internalization in excess of that rapidly recycled back to the
cell surface. As cells grow, their cellular contents are diluted with
each cell division. The terms μR, μC, μI, and μD represent this
dilution by growth. The degradation of the intact ADC and
release of the payload is given by kdegI.
Once the payload is released from the antibody, the
payload must escape the endosomal/lysosomal compartment
before it can bind its intracellular target. Once in the cytosol,
the payload may bind its intracellular target or may leave the
cell. Within the parameters of the current experimental
system, we could not directly measure payload escape from
endosomal/lysosomal compartments. Thus, the model developed here is simplified and does not distinguish between
Determination of Cellular Processing Rates
payload in the cytosol and payload in endosomal/lysosomal
compartments.
The term koutD represents the efflux of payload from the
cell. The receptor synthesis rate, Vs, is determined assuming a
constant HER2 expression level and the steady state material
balance (from Eq. (1)) for receptor with no ADC present;
thus, Vs = (μ + ke)HER2. Note that most of the species are
described in units of Bnumber per cell^ to correspond with
per cell measurements made by flow cytometry. Equations
(1)–(4) can be converted to concentrations based on the
concentration of cells in a manner similar to Eq. (5).
Antibody in the media is described as a concentration (M)
rather than a per cell basis.
Determination of KD and koff
To determine the apparent KD of trastuzumab, we
treated fixed SK-BR-3 cells with a range (0.6–320 pM) of
Tras-647 overnight at 37°C. Cells were fixed to prevent
internalization. Cells were washed twice with 1 mL cold stain
buffer (PBS, pH 7.4, 0.2% BSA, 0.09% sodium azide,
filtered), and fluorescence signal was read via flow cytometry.
We minimized depletion effects using a minimal number of
cells and large suspension volumes.
To determine koff, we treated fixed cells (BT-474, N87,
and SK-BR-3) with 10 nM TM-ADC-647 at least overnight at
37°C. At each time point (between 0 and 78 h), cells were
washed with cold stain buffer and resuspended in stain buffer
with 100 nM trastuzumab in order to compete with any TMADC-647 that had dissociated from cells. After the time
course, all cells were washed with cold stain buffer and read
on the flow cytometer.
Determination of HER2 Expression Levels
The HER2 expression levels for each cell line were
determined using Quantum Simply Cellular anti-Human IgG
Quantitation beads (Bangs Lab). Beads were prepared
following the product manual and stained with 10 μL of
Tras-647 to give a final concentration of 0.8 μM. Fixed cells
were stained with 10 nM Tras-647 overnight at 37°C. Fixation
was performed using Cytofix Buffer (BD Biosciences) at 4°C
for 25 min as described in the product manual. The
fluorescence signals for beads and cells (triplicate per cell
line) were read via flow cytometry. Using the calibration
spreadsheet provided by Bangs Lab, the average fluorescence
intensity for each cell line was converted to number of HER2
receptors on the surface of each cell.
Determination of Cell Growth Rate
Cell growth rates for untreated cells were determined by
plating 2 × 10⁵ cells per well in six-well plates. At each time
point, cells were washed with PBS, detached from the plate
using 0.25% Trypsin/EDTA (Corning), pelleted, and resuspended in 250 μL of PBS supplemented with 5% FBS. To
each sample, 50 μL of CountBright Absolute Counting Beads
(Life Technologies) was added. The cell counts were determined via flow cytometry using gating on forward scatter
(FSC) and side scatter (SSC). The average of the triplicates
for each time point was used to fit an exponential growth rate.
637
Determination of Net Internalization Rate
The methods used to measure the net internalization
rates were adapted from those published previously (24–26).
To determine what fraction of the total signal from Tras-647
or TM-ADC-647 was from surface-bound antibody rather
than internalized antibody, we used an antihuman antibody
rather than acid stripping or quenching antibodies. In 24-well
plates, 105 cells per well were plated and left to adhere
overnight. Cells were treated with 10–20 nM of Tras-647
or TM-ADC-647 for time points between 0–9 h. Based on
the dissociation and association rates, this concentration
range ensures a rapid equilibration rate, with the resulting
equilibrium favoring saturated surface receptors. After
treatment, cells were washed once with PBS and then
detached from the plate using 0.25% Trypsin/EDTA. Cells
were pelleted at 1000×g for 5 min and then resuspended
in stain buffer with 10 μL of Alexa Fluor 488 Goat antiHuman IgG (H+L) (Life Technologies). Cells were
incubated at 4°C on a rotator for 30 min and then
washed twice with 500 μL of stain buffer. The mean
fluorescence intensity (MFI) was measured via flow
cytometry. This MFI was normalized as described in the
next paragraph.
In order to determine the Alexa Fluor 647 signal which
corresponds to fully saturated surface receptors, an additional
105 cells per cell line were fixed to prevent internalization.
The fixed cells were then stained with 10–20 nM Tras-647 or
TM-ADC-647 for at least 1 h at 37°C. The difference in MFI
of the stained fixed cells versus unstained fixed cells was used
to normalize the Alexa Fluor 647 signal for cells treated for
internalization. New cells were fixed and stained at the same
time as each experimental replicate to account for any
variations in HER2 expression level. To normalize the Alexa
Fluor 488 signal, the average of the Alexa Fluor 488 signal
(besides the initial time point) was considered a fully
saturated surface. The internalized fraction was determined
by subtracting the normalized Alexa Fluor 488 signal
(surface-bound antibody) from the normalized Alexa Fluor
647 signal (total antibody). A global fit of the data from
triplicate independent experiments was used to determine the
net internalization rate. Equation 7 demonstrates the linear
function used for the fit.
t2
I ðt2 Þ ¼ ke ∫ Cdt þ I ðt 1 Þ:
t1
ð7Þ
To test whether non-specific uptake is significant, cells
were treated for at least 20 min with 800 nM (40-fold excess)
or 500 nM (25-fold excess) of unlabeled trastuzumab or
unlabeled TM-ADC, respectively. After pre-treatment, Tras647 or TM-ADC-647 was added to a final concentration of
20 nM. At various time points, the cells were washed and the
Alexa Fluor 647 MFI was measured using flow cytometry.
Determination of Degradation Rate
Degradation rate was measured using a time course of
cell lysate samples prepared from cells treated with TMADC-647. In six-well tissue culture plates, 105 cells were
plated and allowed to adhere overnight. Then cells were
Maass et al.
638
treated for 30 min with 10 nM TM-ADC-647 at 37°C. Cells
were washed twice with PBS, and media were replaced with
fresh media. At each time point, cells were washed once with
PBS, and 100 μL of ice-cold cell lysis buffer (150 nM NaCl,
50 mM Tris-HCl, 1% Triton X-100 plus freshly added
proteases inhibitors, BcOmplete, mini, EDTA-free Protease Inhibitor Cocktail Tablets^ (Roche), with one tablet
per 10 mL buffer) was added to each well. Cells were
scraped from the well, and the suspension of cells in lysis
buffer was transferred to a micro-centrifuge tube. Samples
were placed on a rotator at 4°C for 30 min, centrifuged at
12,000 rpm for 20 min, and the resulting supernatant was
stored at 4°C.
After all time points were collected, 12 μL of each
sample was mixed with 3 μL of non-reducing, no dye SDS
loading buffer (0.125 M Tris-HCl, 0.35 M sodium dodecyl
sulfate, 50% by volume glycerol). From this mixture, 10 μL
was added to each lane in a 4–12% Bis-Tris Protein Gel (Life
Technologies). Gels were run in MOPS buffer at 250 V for
15 min. They were then imaged for Alexa Fluor 647 signal
using a Typhoon Imager (GE). Intact antibody bands were
quantified using ImageJ software (NIH). Data were normalized to the initial time point, which was taken immediately
after the treatment period. Using the model described in the
model development section, the degradation rate was fit by
minimizing the difference between data and model predictions for the sum of C, intact antibody in complex with HER2
on the surface of the cell, and I, the intact (non-degraded)
antibody inside the cell. Since the cell lysate samples measure
from the population of cells rather than individual cells, the
total intact antibody from all cells (C × N, #/L) was used to
compare the model predictions and data.
Determination of Efflux Rate
The efflux rate was determined using the total fluorescence signal in cells over time as measured by flow cytometry.
Cells were plated in six-well tissue culture plates (105 cells per
well) and allowed to adhere overnight. Then cells were
treated for 30 min with 10 nM TM-ADC-647 at 37°C. Cells
were washed twice with PBS, and media were replaced with
fresh media. At each time point, cells were washed once with
PBS, detached from the plate using 0.25% Trypsin/EDTA,
pelleted, and resuspended in PBS supplemented with 5%
FBS. Total Alexa Fluor 647 fluorescence signal was read via
flow cytometry and normalized to the fluorescence signal
at the initial time point, immediately after treatment.
Using the complete model described in the BModel
Development^ section, the efflux rate was fit by
minimizing the measured normalized total fluorescence
signal and the normalized total amount of TM-ADC in
cells from the model. The total amount of TM-ADC is the
sum of TM-ADC in complex with HER2 on the surface of
the cell (C), internalized intact TM-ADC (I), and degraded products (D).
Loss of fluorescence signal in cells is mainly due to efflux
of degraded products and dilution by growth. To ensure an
accurate fit of the efflux rate constant, independent of dilution
by growth, we measured the cell growth rate (μ) during each
experiment using counting beads and fit using an exponential
growth model.
Sensitivity Analysis
To determine the model sensitivity to each of the model
parameters, we calculated the local sensitivity based on 10%
perturbations from the established parameters as described
by Eq. (8). The area under the curve (AUC) for the degraded
products (payload) at different parameter values, ki, was
calculated and the difference normalized to the AUC at the
established parameter values. The treatment regimen used
for determining AUC was 10 days at surface saturating
concentrations of ADC (10 nM ADC).
Sensitivityðki Þ ¼
AUCðki ⋅ð1:1ÞÞ−AUCðki ⋅ð0:9ÞÞ
:
0:1ðAUCðki ÞÞ
ð8Þ
The parameters ke and HER2 were analyzed as one
parameter since these parameters do not act independently
under saturating antibody conditions.
To define the length of time required to reach steady
state, we used the time at which the concentration of
degraded antibody inside the cell was equal to 95% of the
concentration of degraded antibody after 100 days of
treatment, with antibody concentration in the media maintained at 10 nM (saturating for the cell surface) and no cell
growth.
Incorporation of Payload Binding to Target
Payload binding to target can be incorporated in the
model as shown in Eq. (9), where konPL ‐ Target is the
association rate constant for payload (DM1) binding to its
intracellular target (tubulin) in (#/cell)−1 h−1, koffPL ‐ Target is
the dissociation rate constant in h−1, T is the amount of target
(tubulin) in cells in #/cell, and Q is the number of drug-target
complexes per cell.
dD
PL‐Target
TD þ koff
Q:
¼ kdeg I−kout D−μD−kPL‐Target
on
dt
ð9Þ
For these analyses, we used the following previously
reported values (8, 27): KDPL ‐ Target(=konPL ‐ Target/koffPL ‐
Target
) of 930 nM, konPL ‐ Target of 0.44 M−1 h−1, and T of
65 nM. To convert the amount of payload drug (D) from
#/cell to an intracellular concentration, we assumed the cell
volume was 1000 μm3.
RESULTS
Model Development
Figure 1 illustrates the model schema for this work. With
the model equations established, we proceeded to parameterize the model. Parameters were measured in a sequential
manner in order to guide the design of experiments for rate
constant measurements for later processing steps. The
apparent equilibrium binding constant, KD, measured via a
cell-based assay was 38 ± 16 pM, as illustrated in Supplemental Fig. 1A. The measured dissociation rate constant, koff, was
0.014 ± 0.016 h−1, as illustrated in Supplemental Fig. 1B. Flow
cytometry quantitation beads were used with Tras-647 to
Determination of Cellular Processing Rates
639
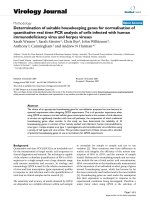
Fig. 1. Schematic of kinetic model for ADC cellular processing, including ADC
association, dissociation, internalization, degradation, and efflux. Model parameter
descriptions are provided in the BMATERIALS AND METHODS^ section, under BModel
Development^
determine the HER2 expression levels. The measured HER2
expression levels for each cell line were 2.71 × 10⁶, 3.25 × 10⁶,
and 3.55 × 10⁶ HER2/cell for BT-474, N87, and SK-BR-3 cells,
respectively. We observed some variability in the precise
expression level with time in culture. These HER2 expression
levels are similar to those reported previously for these cell
lines (28–30). In addition, the untreated cell growth rate
was 0.013 ± 0.003, 0.019 ± 0.007, and 0.011 ± 0.002 h−1 for
BT-474, N87, and SK-BR-3 cells, respectively, as shown in
Supplemental Fig. 2A.
Determination of Internalization Rate Constant
The net internalization rate constant, ke, was determined
for both trastuzumab and TM-ADC, using Tras-647 and TMADC-647, respectively. The Alexa Fluor 647 signal from
labeled trastuzumab or TM-ADC was used as a measure of
total antibody in the cell, i.e., both on the surface and
internalized within cells. The amount of surface-bound
antibody was detected using an Alexa Fluor 488 antihuman
antibody. In order to correlate the Alexa Fluor 647 and Alexa
b
2.5
Total
Surface
Internalized
2.0
1.5
1.0
0.5
0.0
0
2
4
6
Time (h)
8
10
Internal Fraction of Surface Saturation
Fraction of Surface Saturation
a
Fluor 488 signal, both signals were normalized to that of cells
with saturated surface receptors. The difference in the
normalized signal between the total antibody and surfacebound antibody is the signal arising from internalized
antibody.
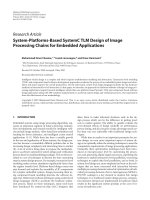
Figure 2a depicts a representative example of the total,
surface-bound, and internalized signal versus time for cells
treated with TM-ADC-647. The unbound HER2 and TMADC quickly equilibrate between the initial time point and
the 1.5-h time point. The surface-bound signal remains
constant after 1.5 h, indicating there is little downregulation
of HER2 during this time period, as observed previously (31),
and that there is no depletion of ADC in the media. Within
the 9-h time course, we assume the rate of degradation is
negligible compared to the rate of internalization. Tests of
non-specific uptake showed that less than 2% of the total
Alexa Fluor 647 signal measured for unblocked cells was
observed with cells that were pre-blocked with unlabeled
trastuzumab or unlabeled TM-ADC.
Figure 2b illustrates the global fit of triplicate experiments for BT-474 cells treated with TM-ADC-647 based on
the surface integral and internalized fraction from plots such
1.0
0.8
0.6
0.4
0.2
0.0
0
2
4
6
8
∫ (Surface) dt ( h )
Fig. 2. Determination of internalization rate constant, ke. a Representative plot of the
normalized Alexa Fluor 647 signal (total antibody), normalized Alexa Fluor 488 signal
(surface-bound antibody), and internalized (total–surface) antibody versus time for BT-474
cells treated with 10 nM TM-ADC-647 and stained with an Alexa Fluor 488 antihuman
antibody. The y-axis is fraction of the normalized surface saturation level, which is either
Alexa Fluor 647 or Alexa Fluor 488 MFI normalized as described in the BMATERIALS
AND METHODS^ section. b Fit of internalization rate using the internalized fraction of
TM-ADC-647 versus surface integral as given by Eq. 7. A representative plot for TMADC-647 internalization in BT-474 cells is shown here. The equivalent plots for other cell
lines and Tras-647 are shown in Supplemental Fig. 3. Fit values for the internalization rate
constants for Tras-647 and TM-ADC-647 are presented in Table I
Maass et al.
640
as Fig. 2a. The equivalent graphs for other cell lines are
shown in Supplemental Fig. 3. A summary of the net
internalization rates, ke (±95% confidence intervals), measured for three different cell lines are shown in Table I. The
half times, t1/2, for internalization, which were calculated
using t1/2 = ln(2)/ke, are also shown. The range spans the 95%
confidence intervals of the net internalization rate.
Determination of Degradation Rate Constant
In TM-ADC, DM1 is conjugated to trastuzumab via a
non-cleavable linker, succinimidyl 4-(Nmaleimidomethyl)cyclohexane-1-carboxylate (SMCC). Thus,
the drug metabolite of TM-ADC is lysine-Nε-SMCC-DM1,
which is the payload, linker, and residual amino acid (lysine)
to which the linker payload was conjugated (32,33). This
metabolite results from complete proteolytic degradation of
the antibody component of TM-ADC in lysosomal compartments after internalization. Thus, the degradation rate we
measure describes the rate of proteolytic degradation of the
antibody, which results in release of the payload.
In order to measure the degradation rate constant, kdeg, we
developed a gel-based imaging assay. Cell lysate samples were
collected at different time points (0–130 h) after cells were treated
for 30 min with 10 nM TM-ADC-647. These samples were then
run on a non-reducing SDS-PAGE gel, which was imaged for
fluorescence. The fluorescence signal from the intact antibody
was quantified. Figure 3a depicts a typical gel image with BT-474
cell lysate samples collected from different time points (0–130 h)
after treatment. The higher band corresponds to full antibody, as
confirmed by running samples in a gel with a protein ladder, as
illustrated in Supplemental Fig. 4. The main band at approximately 150 kDa seen in Supplemental Fig. 4 corresponds to intact
full antibody, based on comparison to the protein ladder and the
positive control of TM-ADC-647 in lysis buffer (lane 4). The
signal at the very bottom runs at the small molecule front and
includes Alexa Fluor 647 lysine that has been released via
degradation of the ADC. In addition, some minor bands are seen
which correspond to aggregates (>200 kDa) and the dissociated
heavy (50 kDa) and light (25 kDa) chains of the antibody.
Only the total full antibody was quantified from gels such
as Fig. 3a. The total full antibody is the sum of both antibody
on the cell surface in complex with HER2 and intact antibody
that has been internalized. The predicted contributions of
both of these components to the total antibody signal are
shown in dashed lines in Fig. 3b, c, d. The amount of
internalized, intact ADC in the cells increases initially due
to internalization of ADC in complex with HER2 and then
decreases due to degradation of the ADC. The antibody in
complex on the cell surface decreases due to antibody
internalization and dissociation. The experimental setup was
chosen to isolate the process of degradation as much as
possible. By briefly dosing cells with TM-ADC-647, we
quickly saturate the HER2 receptors on the cell surface. At
later time points, there is no longer ADC on the surface to be
internalized and the decay in signal comes from degradation.
In Fig. 3b, c, d, the fit curves for BT-474, N87, and SK-BR-3,
respectively, are shown. The degradation rate was fit using
the total intact antibody signal, normalized to the initial signal
from cells collected immediately after wash at the end of the
30-min treatment period. The degradation rate constants and
half-lives are shown in Table II. The degradation rate of TMADC-647 is similar across the three cell lines tested, with halflives on the order of 1 day.
Determination of Efflux Rate Constant
With the internalization and degradation rate constants
established, we next turned to measurement of the efflux rate
constant, kout, which describes the rate at which the payload
metabolite exits the cell after the ADC is internalized and
degraded. This model parameter encompasses a number of
possible mechanisms for payload release from the cell,
including passive efflux, such as diffusion of payload across
the cell membrane, and active efflux, such as pumping of the
payload out of the cell via multidrug resistance pumps. Since
endosomal/lysosomal escape was not included as a separate
parameter in this model, the efflux rate includes this escape
rate in series with either passive or active efflux. Efflux of
payload from the cell may also be due to lysosomal fusion
with the cell membrane (34) or exosomes (35–37). A recent
study of residualization rates showed a surprising similarity of
efflux rate for a number of different fluorophores (38),
suggesting that fluorophore efflux mechanisms may be
independent of fluorophore structure and characteristics.
To determine the efflux rate constant, we tracked the
total cell fluorescence over time using flow cytometry
following a 30-min treatment period with TM-ADC-647 to
saturate the surface receptors. The loss of total fluorescence
signal over time is due to dissociation of surface-bound ADC,
efflux of fluorophore metabolites from degraded ADCs, and
dilution by growth. Internalization and degradation change
the form of the ADC, but do not decrease the total
fluorescence signal due to ADC in the cell. Using the
complete model, which takes into account the contributions
from dissociation and dilution by growth, we fit the efflux rate
based on decay of the total cell fluorescence over time. Here,
we tracked efflux of the fluorophore metabolite as a proxy for
the maytansinoid metabolite. Figure 4a, b, c shows the curves
used to fit the efflux rate constant for degraded products from
cells treated with TM-ADC-647. The cell growth rate was
measured during each experimental replicate as illustrated in
Table I. Net Internalization Rates (ke) and Half-Lives (t1/2) for Tras-647 and TM-ADC-647
Tras-647
−1
TM-ADC-647
Cell line
ke(h
)
t1/2(h)
BT-474
NCI-N87
SK-BR-3
0.054 ± 0.007
0.035 ± 0.008
0.043 ± 0.005
12.8
19.8
16.1
ke(h− 1)
t1/2(h)
Significantly different? p value
0.11 ± 0.02
0.051 ± 0.006
0.09 ± 0.01
6.3
13.6
7.7
<0.0001
<0.01
<0.000001
Determination of Cellular Processing Rates
641
a
b
c
d
Fig. 3. Determination of degradation rate constant, kdeg. Image of native SDS-PAGE gel with cell lysate
samples over 0–130 h after BT-474 cells were treated for 30 min with 10 nM TM-ADC-647 (a). The full
antibody at each time point was quantified from images such as this. The decay over time of the full
antibody signal was used to fit the degradation rate constant for BT-474 (b), N87 (c), and SK-BR-3 cells
(d). The full antibody signal is the sum of the full antibody in complex with receptors on the cell surface
and the intact antibody that has been internalized into the cell but not yet degraded. The model
predictions for these two species are shown in dashed lines as indicated by the legend. Data points are from
triplicate independent experiments
Supplemental Fig. 2B-D. The fit efflux rate constants and
corresponding half-lives are listed in Table III.
Sensitivity Analysis
Once we established all of the model parameters, we
performed a local sensitivity analysis in order to determine
which parameters have the largest impact on the amount of
payload delivered into cells. Figure 5 illustrates the model
sensitivity for each of the model parameters for cells treated
with TM-ADC for 10 days at surface saturating conditions,
which is physiologically relevant for cancer patients treated
with tumor-targeting antibodies (8, 9). Figure 5a includes
dilution by cell growth assuming a growth rate equal to that
of untreated cells. Alternatively, if a sufficiently large quantity
Table II. Degradation Rates (kdeg) and Half-Lives (t1/2) for TMADC-647
Cell line
kdeg(h− 1)
BT-474
NCI-N87
SK-BR-3
0.03 ± 0.01
0.027 ± 0.008
0.038 ± 0.009
t1/2(h)
23.3
25.4
18.0
of payload is delivered, then cell growth would cease; Fig. 5b
presents the same sensitivity analysis, but with no cell growth
(μ = 0). In both cases, the internalization rate (keHER2) and
efflux rate (kout) are key parameters for determining how
much payload is delivered to cells.
Another way to evaluate how effectively an ADC delivers
payload to a cell is to consider the payload concentration within
cells at steady state with constant exposure to ADC. Assuming
sufficiently high ADC concentration to saturate HER2 receptors on the cell surface, the expression for steady state payload
concentration is given in Eq. (10).
Dss ¼ À
kdeg ke HER2
Á
:
kdeg þ μ ðkout þ μÞ
ð10Þ
Assuming no cell growth in addition to sufficiently high
ADC concentration to saturate HER2 receptors on the cell
surface, the steady state expression of payload drug is
simplified to Eq. (11).
Dss ¼
ke HER2
:
kout
ð11Þ
Equation 11 illustrates the crucial balance between the
amount of drug that enters the cell via internalization and
Maass et al.
642
a
b
c
Fig. 4. Determination of efflux rate constant, kout. The decay over time of the total fluorescence signal as
measured by flow cytometry from cells treated with 10 nM TM-ADC-647. The fit curves are shown for BT474 (a), N87 (b), and SK-BR-3 cells (c). The total fluorescence signal is the sum of the signal from antibody
in complex with receptors on the cell surface (c), intact ADC (I), and degraded products (d). The model
predictions for these species are shown as indicated in the legend for each graph. Data points are from
triplicate independent experiments
that which leaves the cell. This expression also demonstrates
that expression level and internalization rate do not act
independently of one another, rather the product of the two
dictates the amount of ADC internalized. Although the
amount of payload at steady state (Dss) captures the key
parameters, it is important to note that it would take 8–
15 days for cells to reach steady state with continuous
exposure to surface saturating levels of ADC, based on the
parameters measured for TM-ADC-647 in the three cell lines
tested as described in the BMATERIALS AND METHODS^
section. Supplemental Fig. 5 illustrates the amount of each
species in the cell over time to reach steady state. The
number of slow processing steps results in this long approach
to steady state. Figure 5a, b also includes the model sensitivity
to modifications of keHER2 and kout when holding Dss
constant. For the case with no cell growth (Fig. 5b), although
the model is sensitive to the internalization rate (keHER2)
and efflux rate (kout) independently, it is relatively insensitive
to changes to these parameters if Dss is held constant.
Table III. Efflux Rates (kout) and Half-Lives (t1/2) of Metabolites for
TM-ADC-647
Cell line
kout(h− 1)
BT-474
NCI-N87
SK-BR-3
0.009 ± 0.004
0.022 ± 0.009
0.015 ± 0.006
t1/2(h)
75.3
31.7
45.3
Incorporation of Payload Binding to Target
Another processing step we have incorporated into the
model is payload binding to its intracellular target. DM1
binding to its target, tubulin, provides an additional sink that
could reduce the amount of payload that effluxes from cells.
The balance between target binding and efflux has been
demonstrated previously with D and L isomers of the
maytansinoid DM4 (32). The KD for DM1 binding to
microtubules has been measured experimentally (27), and
the on rate and concentration of tubulin in a tumor have been
estimated via a large scale PK/PD model (8).
Based on the developed model and parameter estimates,
the concentration of payload metabolites in the cell reaches
1–3 μM after 1 day of treatment at surface saturating
concentrations of TM-ADC. This concentration of payload
metabolite is in the range of previously reported IC50 values
for DM1 inhibition of microtubule growth (27) and experimentally determined catabolite concentrations for other
antibody-SMCC-DM1 conjugates (39). At these concentrations, the quantity of DM1 present in a cell is 50–2500 times
greater than the number of tubulin-binding sites, which is on
the order of 1000–10,000 sites per cell (8, 40). Thus,
accounting for payload binding to target does not dramatically affect the free payload concentration in the cell.
However, it is important to note these calculations assume
all of the drug payload catabolite escapes the lysosome and is
in the cytosol. As others have suggested (39, 41), it is possible
Determination of Cellular Processing Rates
a
b
Fig. 5. Local sensitivity analysis for model parameters (a) with cell
growth rate (μ) equal to untreated cell growth rate or (b) with no cell
growth. Sensitivity was calculated based on variations in the area
under the curve for released payload after 10 days of treatment with
10 nM TM-ADC-647 with 10% perturbations in the indicated model
parameter
that some payload metabolite may be trapped in endosomal/
lysosomal compartments. In addition, the payload may nonspecifically bind to other intracellular proteins. Thus, free
payload concentration in the cytosol may be lower than the
concentration of degraded ADC species in this model;
however, free payload concentration in the cytosol is the
relevant value to dictating how much payload ultimately
reaches its target.
DISCUSSION
In this work, we have developed a model for the cellular
processing of ADCs, and we have reported generalizable
methods to measure the model parameters. A trastuzumabmaytansinoid ADC (TM-ADC), which is similar to a
clinically relevant ADC, T-DM1 (Kadcyla), was used to
establish this model. For TM-ADC, we found the internalization rate to be moderately relative to other antibodies (42)
(half-life of 6–14 h), the degradation rate to be slower than
internalization (half-life of 18–25 h), and the efflux rate to be
the slowest rate (half-life of 32–75 h).
The association rate constant (kon) and equilibrium
dissociation constant (KD) are parameters that can be tuned
based on the antibody component of the ADC. Typical values
643
for kon for a protein-protein interaction are 105 M−1s−1, and
KD ranges from 10−12 to 10−6 (43). On the other hand, the net
internalization rate constant (ke) depends on both the antigen
target as well as the antibody itself. For example, trastuzumab
internalizes based on natural HER2 internalization and
recycling, whereas other antibodies induce rapid HER2
downregulation due to internalization upon binding (31).
The net internalization rate can range from 10−3 to 1 h−1 (43).
The degradation rate constant (kdeg), which describes how
quickly the payload is released from the antibody, is highly
dependent on the linker design. For instance, an ADC with a
pH-sensitive or protease-cleavable linker will likely degrade
more quickly than a non-cleavable linker.
The receptor expression level (HER2) and receptor
synthesis rate (Vs) both vary with antigen target. Receptor
expression level can range from 103 to 106 (3). Often, high
receptor expression is considered necessary for an ADC to be
effective. From the cellular processing perspective, the
product of receptor expression level and net internalization
(keHER2) drives how much drug is being delivered into a
cell. Thus, a lower receptor expression level could be
compensated for by more rapid internalization. However, it
is also important to note the impact that antigen expression
and internalization have on tumor penetration (42).
Recent work has shown that internalization is not
required to effectively deliver payload via an ADC (44, 45).
Rather than payload entering a cell via receptor-mediated
endocytosis of the antibody component of the ADC, the
payload may be released from the ADC outside the cell and
then enter the cell via passive diffusion or active uptake via
transporters. In this model, we did not account for free
payload diffusion into the cell and instead focused on classical
receptor-mediated delivery. Since ADC treatment periods
were brief-pulse treatments, excess ADCs in the culture
media that could generate large amounts of free payload were
not present. Depending on the stability of the ADC in the
extracellular space as well as the concentration of ADC in
tumor, diffusion of the payload into the cell could contribute
significantly to the amount of payload delivered to a cell. The
permeability of the payload catabolite, as well as the
catabolite’s interactions with transporters, will dictate how
readily the payload enters the cell from the extracellular
space.
The chemical structure of the payload catabolite may
differ depending on whether the ADC is degraded in
endosomal/lysosomal compartments within the cell or in the
extracellular space. The structure is also highly dependent on
the linker design. As previous studies have demonstrated
(32), different linker designs can result in different catabolites
for the same payload; these payload catabolites may, in turn,
have widely different abilities to penetrate surrounding cells
via the bystander effect. Payload catabolite permeability may
also affect the payload’s ability to escape from endosomal/
lysosomal compartments. Although a minimally permeable
payload may diffuse more slowly out of a cell, thus improving
the chances of cell killing, it may also become trapped in the
endosomal/lysosomal compartments, thus reducing the bystander effect.
The model developed here provides a framework to
compare the rates of cellular processing of ADCs in order to
determine what the rate-limiting steps are for payload
Maass et al.
644
delivery via an ADC. When considering how to optimize
ADC efficacy, it is crucial to understand how these various
cellular processing steps relate to one another, as the
relationships may be non-intuitive. This work highlights the
importance of evaluating cellular processing steps in the
context of the entire system rather than individually. The
framework developed here could help guide decisions during
the drug development process in order to optimize the
performance of a candidate ADC; importantly, the methods
developed here are generalizable for any ADC candidate.
In order to track the processing of TM-ADC, we used
Alexa Fluor 647-labeled TM-ADC. The use of a fluorescent
label offers a number of advantages: the label enables
tracking of the ADC in a quantitative manner; fluorescent
labels can be easily applied to different ADCs of interest;
fluorescence signal can be measured using multiple approaches; and fluorescent labeling is safer than radiolabeling,
a common alternative. On the other hand, fluorescence
labeling also has disadvantages, including susceptibility to
photobleaching and environmental sensitivity; however,
Alexa fluorophores are relatively stable and environmentally
insensitive. An additional caveat to note is that the addition
of any type of label may perturb the structure and behavior of
an ADC.
At a single-cell level, efflux of payload from cells is not
ideal, considering that the desired outcome after ADC
treatment is the payload binding to its target to cause cell
death. However, on the scale of a whole tumor, efflux of
payload could be beneficial due to the so-called bystander
effect (32, 46). Cell killing via the bystander effect involves a
tumor cell taking up an ADC, then releasing free drug
payload into the surroundings, where it can diffuse freely into
nearby cells. The bystander effect can affect both tumor cells
and stroma.
We hypothesize that the escape of an ADC drug payload
from endosomes and lysosomes is a key factor that affects
how much payload actually reaches its intracellular target.
Our analysis of intracellular payload concentrations indicates
that if endosomal escape is not limited, then the concentration of DM1 in the cell is similar to the IC50 for DM1 binding
to tubulin when cells are treated for 1 day with T-DM1 at cell
surface saturating conditions. However, if only 10% of the
payload metabolite escapes endosomes, then it would take
∼four times longer for cells to reach intracellular payload
concentrations equal to the IC50. A more detailed understanding of how different payloads escape the endosomal/
lysosomal compartments could improve ADC design for
more efficient payload delivery. Recent studies demonstrate
that transporters can be involved in payload escape from
endosomal/lysosomal compartments (47) and present
methods to enrich for lysosomes in cellular fractions in order
to study payload concentrations in lysosomes (48).
One limitation of our analysis is that we were unable to
track the payload, DM1, itself once it was separated from the
antibody component of TM-ADC. Instead, we tracked efflux
of the fluorophore metabolite as a proxy for the DM1
metabolite. This assumption is reasonable given that the
molecular weight and hydrophobicity of the fluorophore
metabolite and DM1 metabolite are similar; in TM-ADC647, both DM1 and the Alexa Fluor 647 dye were attached to
trastuzumab via lysine residues. The use of fluorescent drug
payloads or fluorescent drug analogs could be better suited
for studying payload trafficking. However, fluorescent drug
analogs could be processed differently by cells than the
parent drugs depending on the modifications, and they are
generally challenging to access synthetically. In ongoing work,
we are studying ADCs bearing fluorescent drug payloads to
enable tracking of the actual payload metabolite.
In conclusion, a quantitative understanding of ADC
cellular processing allows one to compare the rates at which
different processing steps occur and appreciate how these rates
are related to one another. This level of understanding may be
useful for improving ADC design. The cellular mechanisms of
ADC processing can be integrated into larger PK/PD models, as
described in the associated companion paper.
ACKNOWLEDGMENTS
We thank Lindsay King, Nahor Haddish-Berhane, and
members of the Wittrup Lab for their technical suggestions.
For the gift of the trastuzumab-maytansinoid ADC (TMADC), we are grateful to the Pfizer Oncology Bioconjugation
group, including William Hu, Ellie Muszynska, Nadira
Prashad, Kiran Khandke, and Frank Loganzo. K.F.M. was
supported by a Hertz Foundation Fellowship and a National
Science Foundation Graduate Research Fellowship. C.K. was
supported by the Pfizer Worldwide Research & Development
Post-Doctoral Program. This work was also supported by a
research grant from Pfizer and in part by the Koch Institute
Support (core) grant P30-CA14051 from the National Cancer
Institute. We thank the Koch Institute Swanson Biotechnology Center for the technical support, specifically the Flow
Cytometry Core.
REFERENCES
1. Zolot RS, Basu S, Million RP. Antibody–drug conjugates. Nat
Rev Drug Discov [Internet]. 2013;12(4):259–60. Available from:
/>2. Panowski S, Bhakta S, Raab H, Polakis P, Junutula JR. Sitespecific antibody drug conjugates for cancer therapy. mAbs.
2014;6(1):34–45.
3. Carter PJ, Senter PD. Antibody-drug conjugates for cancer
therapy. Cancer J. 2008;14(3):154–69. Available from: http://
www.ncbi.nlm.nih.gov/pubmed/18536555.
4. McCombs JR, Owen SC. Antibody drug conjugates: design and
selection of linker, payload and conjugation chemistry. AAPS J
[Internet]. 2015;(6). Available from: />10.1208/s12248-014-9710-8
5. Hamblett KJ, Senter PD, Chace DF, Sun MMC, Lenox J,
Cerveny CG, et al. Effects of drug loading on the antitumor
activity of a monoclonal antibody drug conjugate. Clin Cancer
Res [Internet]. 2004 Oct 15 [cited 2012 Mar 31];10(20):7063–70.
Available from: />6. Kovtun Y V, Goldmacher VS. Cell killing by antibody-drug
conjugates. Cancer Lett [Internet]. 2007 Oct 8 [cited 2012 Apr
26];255(2):232–40. Available from: />pubmed/17553616.
7. Barok M, Joensuu H, Isola J. Trastuzumab emtansine: mechanisms of
action and drug resistance. Breast Cancer Res [Internet]. 2014 Jan
[cited 2014 Oct 9];16(2):209. Available from: http://
www.pubmedcentral.nih.gov/articlerender.fcgi?artid=4058749
&tool=pmcentrez&rendertype=abstract
8. Shah DK, Haddish-Berhane N, Betts A. Bench to bedside
translation of antibody drug conjugates using a multiscale
Determination of Cellular Processing Rates
9.
10.
11.
12.
13.
14.
15.
16.
17.
18.
19.
20.
21.
mechanistic PK/PD model: a case study with brentuximabvedotin. J Pharmacokinet Pharmacodyn [Internet]. 2012 Dec
[cited 2012 Dec 10];39(6):643–59. Available from: http://
www.ncbi.nlm.nih.gov/pubmed/23151991.
Shah DK, King LE, Han X, Wentland J-A, Zhang Y, Lucas J,
et al. A priori prediction of tumor payload concentrations:
preclinical case study with an auristatin-based anti-5t4
antibody-drug conjugate. AAPS J [Internet]. 2014 Mar 1 [cited
2014 Apr 1]; Available from: />pubmed/24578215.
Sukumaran S, Gadkar K, Zhang C, Bhakta S, Liu L, Xu K, et al.
Mechanism-based pharmacokinetic/pharmacodynamic model for
THIOMAB TM drug conjugates. Pharm Res [Internet].
2014;1884–93. Available from: />s11095-014-1582-1
Singh AP, Shin YG, Shah DK. Application of pharmacokineticpharmacodynamic modeling and simulation for antibody-drug
conjugate development. Pharm Res [Internet]. 2015;32(11):3508–
25. Available from: />Sadekar S, Figueroa I, Tabrizi M. Antibody drug conjugates:
application of quantitative pharmacology in modality design and
target selection. AAPS J [Internet]. 2015;17(4):828–36. Available
from: />Burris H a, Tibbitts J, Holden SN, Sliwkowski MX, Lewis
Phillips GD. Trastuzumab emtansine (T-DM1): a novel agent for
targeting HER2+ breast cancer. Clin Breast Cancer [Internet].
2011 Oct [cited 2012 Jul 15];11(5):275–82. Available from: http://
www.ncbi.nlm.nih.gov/pubmed/21729661.
Wada R, Erickson HK, Lewis Phillips GD, Provenzano C a,
Leipold DD, Mai E, et al. Mechanistic pharmacokinetic/
pharmacodynamic modeling of in vivo tumor uptake, catabolism,
and tumor response of trastuzumab maytansinoid conjugates.
Cancer Chemother Pharmacol [Internet]. 2014 Nov 4 [cited 2014
Oct 1];74(5):969–80. Available from: .
gov/pubmed/25186956.
Erickson HK, Lewis Phillips GD, Leipold DD, Provenzano C a,
Mai E, Johnson H a, et al. The effect of different linkers on target
cell catabolism and pharmacokinetics/pharmacodynamics of
trastuzumab maytansinoid conjugates. Mol Cancer Ther [Internet]. 2012 May [cited 2012 Aug 6];11(5):1133–42. Available from:
/>Jumbe NL, Xin Y, Leipold DD, Crocker L, Dugger D, Mai E, et
al. Modeling the efficacy of trastuzumab-DM1, an antibody drug
conjugate, in mice. J Pharmacokinet Pharmacodyn [Internet].
2010 Jun [cited 2014 Jan 12];37(3):221–42. Available from: http://
www.ncbi.nlm.nih.gov/pubmed/20424896.
Chudasama VL, Schaedeli Stark F, Harrold JM, Tibbitts J, Girish
SR, Gupta M, et al. Semi-mechanistic population pharmacokinetic model of multivalent trastuzumab emtansine in patients
with metastatic breast cancer. Clin Pharmacol Ther [Internet].
2012;92(4):520–7. Available from: medcentral.
nih.gov/articlerender.fcgi?artid=3745717&tool=pmcentrez
&rendertype=abstract
Lu D, Joshi A, Wang B, Olsen S, Yi JH, Krop IE, et al. An
integrated multiple-analyte pharmacokinetic model to characterize trastuzumab emtansine (T-DM1) clearance pathways and to
evaluate reduced pharmacokinetic sampling in patients with
HER2-positive metastatic breast cancer. Clin Pharmacokinet.
2013;52(8):657–72
Girish S, Gupta M, Wang B, Lu D, Krop IE, Vogel CL, et al.
Clinical pharmacology of trastuzumab emtansine (T-DM1): an
antibody-drug conjugate in development for the treatment of
HER2-positive cancer. Cancer Chemother Pharmacol.
2012;69(5):1229–40.
Maass KF, Kulkarni C, Quadir MA, Hammond PT, Betts AM,
Wittrup KD. A flow cytometric clonogenic assay reveals the
single-cell potency of doxorubicin. J Pharm Sci [Internet]. 2015
Sep;n/a – n/a. Available from: />jps.24631.
Chari RVJ, Martell BA, Gross JL, Gross L, McKenzie SJ,
Goldmacher VS, et al. Immunoconjugates containing novel
maytansinoids: promising anticancer drugs. Cancer Res.
1992;52(1):127–31.
645
22. Loganzo F, Tan X, Sung M, Jin G, Myers JS, Melamud E, et al.
Tumor cells chronically treated with a trastuzumab-maytansinoid
antibody-drug conjugate develop varied resistance mechanisms
but respond to alternate treatments. Mol Cancer Ther [Internet].
2015;14(April):952–64. Available from: rjournals.
org/cgi/doi/10.1158/1535-7163.MCT-14-0862
23. Linderman J, Lauffenburger D. Receptors: models for binding,
trafficking, and signaling. Oxford: Oxford University Press; 1993.
24. Lund KA, Opresko LK, Starbuck C, Walsh BJ, Wiley HS.
Quantitative analysis of the endocytic system involved in
hormone-induced receptor internalization. J Biol Chem. 1990.
25. Schmidt MM, Thurber GM, Wittrup KD. Kinetics of anticarcinoembryonic antigen antibody internalization: effects of
affinity, bivalency, and stability. Cancer Immunol Immunother
[Internet]. 2008 Dec [cited 2011 Jun 29];57(12):1879–90. Available from: />fcgi?artid=2840397&tool=pmcentrez&rendertype=abstract.
26. Harper J, Mao S, Strout P, Kamal A. Selecting and optimal
antibody for antibody-drug conjugate therapy: internalization
and intracellular localization. In: Ducry L, editor. Methods in
Molecular Biology [Internet]. Totowa, NJ: Humana Press; 2013
[cited 2014 Apr 1]. p. 41–9. Available from: http://
link.springer.com/10.1007/978-1-62703-541-5.
27. Lopus M, Oroudjev E, Wilson L, Wilhelm S, Widdison W, Chari
R, et al. Maytansine and cellular metabolites of antibodymaytansinoid conjugates strongly suppress microtubule dynamics
by binding to microtubules. Mol Cancer Ther [Internet]. 2010
Oct [cited 2014 Apr 1];9(10):2689–99. Available from: http://
www.pubmedcentral.nih.gov/articlerender.fcgi?artid=2954514
&tool=pmcentrez&rendertype=abstract
28. Rusnak DW, Alligood KJ, Mullin RJ, Spehar GM, ArenasElliott C, Martin a-M, et al. Assessment of epidermal growth
factor receptor (EGFR, ErbB1) and HER2 (ErbB2) protein
expression levels and response to lapatinib (Tykerb, GW572016)
in an expanded panel of human normal and tumour cell lines.
Cell Prolif [Internet]. 2007 Aug;40(4):580–94. Available from:
/>29. Hendriks BS, Klinz SG, Reynolds JG, Espelin CW, Gaddy DF,
Wickham TJ. Impact of tumor HER2/ERBB2 expression level
on HER2-targeted liposomal doxorubicin-mediated drug delivery: multiple low-affinity interactions lead to a threshold effect.
Mol Cancer Ther [Internet]. 2013 Sep [cited 2014 Jan
12];12(9):1816–28. Available from: .
nih.gov/pubmed/23723124.
30. Pillow TH, Tien J, Parsons-reponte KL, Bhakta S, Li H, Staben
LR, et al. Site-specific trastuzumab maytansinoid antibody–drug
conjugates with improved therapeutic activity through linker and
antibody engineering. 2014.
31. Austin CD, Maziere AM, Pisacane PI, van Dijk SM, Eigenbrot
C, Sliwkowski MX, et al. Endocytosis and sorting of ErbB2 and
the site of action of cancer therapeutics trastuzumab and
geldanamycin. Mol Biol Cell. 2004;15:5268–82.
32. Erickson HK, Park PU, Widdison WC, Kovtun Y V, Garrett LM,
Hoffman K, et al. Antibody-maytansinoid conjugates are activated in targeted cancer cells by lysosomal degradation and
linker-dependent intracellular processing. Cancer Res [Internet].
2006 Apr 15 [cited 2012 Mar 30];66(8):4426–33. Available from:
/>33. Lewis Phillips GD, Li G, Dugger DL, Crocker LM, Parsons KL,
Mai E, et al. Targeting HER2-positive breast cancer with
trastuzumab-DM1, an antibody-cytotoxic drug conjugate. Cancer
Res [Internet]. 2008 Nov 15 [cited 2014 Jan 10];68(22):9280–90.
Available from: />34. Rodríguez A, Webster P, Ortego J, Andrews NW. Lysosomes
behave as Ca2 + -regulated exocytic vesicles in fibroblasts and
epithelial cells. J Cell Biol. 1997;137(1):93–104.
35. Safaei R, Larson BJ, Cheng TC, Gibson M a, Otani S,
Naerdemann W, et al. Abnormal lysosomal trafficking and
enhanced exosomal export of cisplatin in drug-resistant human
ovarian carcinoma cells. Mol Cancer Ther. 2005;4(10):1595–604
36. Federici C, Petrucci F, Caimi S, Cesolini A, Logozzi M, Borghi
M, et al. Exosome release and low pH belong to a framework of
resistance of human melanoma cells to cisplatin. PLoS One.
2014;9(2).
Maass et al.
646
37. Brinton LT, Sloane HS, Kester M, Kelly KA. Formation and role
of exosomes in cancer. Cell Mol Life Sci [Internet].
2014;72(4):659–71. Available from: />10.1007/s00018-014-1764-3.
38. Cilliers C, Liao J, Atangcho L, Thurber GM. Residualization
rates of near-infrared dyes for the rational design of molecular
imaging agents. Mol Imaging Biol [Internet]. 2015; Available
from: />39. Singh R, Salomon PL. A sensitive ELISA method for the
measurement of catabolites of antibody-drug conjugates
(ADCs) in target cancer cells. Mol Pharm [Internet].
2015;150304113735005. Available from: />abs/10.1021/acs.molpharmaceut.5b00028
40. Spiegelman BM, Lopata M a, Kirschner MW. Multiple sites for
the initiation of microtubule assembly in mammalian cells. Cell.
1979;16(2):239–52
41. Loganzo F, Tan X, Sung M, Jin G, Myers JS, Melamud E. Tumor
cells chronically treated with a trastuzumab-maytansinoid antibody-drug conjugate develop varied resistance mechanisms but
respond to alternate treatments. Mol Cancer Ther. 2015.
42. Thurber GM, Schmidt MM, Wittrup KD. Antibody tumor
penetration: transport opposed by systemic and antigenmediated clearance. Adv Drug Deliv Rev [Internet]. 2008 Sep
[cited 2014 Dec 11];60(12):1421–34. Available from: http://
www.pubmedcentral.nih.gov/articlerender.fcgi?artid=2820307
&tool=pmcentrez&rendertype=abstract
43. Thurber GM, Dane Wittrup K. A mechanistic compartmental
model for total antibody uptake in tumors. J Theor Biol
44.
45.
46.
47.
48.
[Internet]. Elsevier; 2012 Dec 7 [cited 2012 Dec 3];314:57–68.
Available from: />Perrino E, Steiner M, Krall N, Bernardes GJL, Pretto F, Casi G,
et al. Curative properties of non-internalizing antibody-drug
conjugates based on maytansinoids. Cancer Res [Internet]. 2014
Feb 11 [cited 2014 Apr 1]; Available from: http://
www.ncbi.nlm.nih.gov/pubmed/24520075
Casi G, Neri D. Noninternalizing targeted cytotoxics for cancer
therapy. Mol Pharm [Internet]. 2015;12(6):1880–4. Available
from: />Okeley NM, Miyamoto JB, Zhang X, Sanderson RJ, Benjamin
DR, Sievers EL, et al. Intracellular activation of SGN-35, a
potent anti-CD30 antibody-drug conjugate. Clin Cancer Res
[Internet]. 2010 Feb 1 [cited 2014 Mar 28];16(3):888–97. Available from: />Hamblett KJ, Jacob AP, Gurgel JL, Tometsko ME, Rock BM,
Patel SK, et al. SLC46A3 is required to transport catabolites of
noncleavable antibody maytansine conjugates from the lysosome
to the cytoplasm. Cancer Res [Internet]. 2015;75(24):5329–40.
Available from: />0008-5472.CAN-15-1610.
Rock BM, Tometsko ME, Patel SK, Hamblett KJ, Fanslow WC,
Rock DA. Intracellular catabolism of an antibody drug conjugate
with a noncleavable linker. Drug Metab Dispos [Internet].
2015;43(9):1341–4. Available from: />cgi/doi/10.1124/dmd.115.064253.