Nghiên cứu chế tạo, xác định đặc trưng, tính chất tổ hợp polymer alginate,chitosan mang hoạt chất ginsenoside rb1 và thuốc lovastatin tt tiếng anh
Bạn đang xem bản rút gọn của tài liệu. Xem và tải ngay bản đầy đủ của tài liệu tại đây (1.41 MB, 30 trang )
MINISTRY OF EDUCATION AND TRAINING
VINH UNIVERSITY
THACH THI LOC
RESEARCHES ABOUT FABRICATION,
CHARACTERIZATION, PROPERTIES OF
ALGINATE/CHITOSAN POLYMER COMPOSITE
WITH GINSENOSIDE RB1 AND LOVASTATIN
Specialization: Organic Chemistry
Code: 9440114
SUMMARY OF DOCTORAL THESIS IN CHEMISTRY
NGHE AN - 2020
THE PROJECT WAS COMPLETED AT
The School of Natural Sciences Education - Vinh University and the Institute
for Tropical Technology - Vietnam Academy of Science and Technology
Supervisors:
Prof. Dr. Thai Hoang
Assoc. Prof. Dr. Le Duc Giang
Reviewer 1: ........................................
Reviewer 2: ........................................
Reviewer 3: ........................................
The thesis will be defended at the Council of doctoral thesis
examiners of Vinh University at…… on ….. of ….., 2020.
The thesis can be found at:
- Nguyen Thuc Hao Library, Vinh University
- Vietnam National Library
1
PREFACE
1. Reasons for the subject choice:
Chitosan (CS) and sodium alginate (AG) are natural polymers that are
applied widely in various fields. CS is a natural polysaccharide formed
during the deacetylation of chitin from shells of shrimp and other
crustaceans in alkaline condition. It comprises an unbranched chain
consisting of poly-(1, 4)-2-amino-2-deoxy-D-glucopyranose, and it is a
unique basic linear polysaccharide. Chitosan polymer having hydroxide and
amine groups in most repeat units and the protonation of the amine groups
makes the polymer soluble in dilute acid solution. CS is widely used in
food and pharmaceutical industry, also in biotechnological fields.
Furthermore, CS has been extensively studied on biomaterials due to its
biodegradability and biocompatibility. However, the disadvantage of CS is
very sensitive to moisture, which limits the use of this natural polymer. To
overcome its disadvantage, CS is often combined with relatively stable
moisture-proof polymers such as alginate (AG), polylactic acid (PLA),
polyethylene glycol fumarate, poly (vinyl alcohol), etc. AG is dissolved in
water to form a highly viscous solution, so it is used to increase storage life
and retain original quality of foods. Therefore, synthesis and application of
AG/CS blend with different active substances have been researched by
many scientists.
According to the review documents, the use of AG/CS polymer
composites carrying drugs has certain effects, so this research direction has
been attracting the attention of many scientists over the world. However, so
far, no work has been published on the characteristics and properties of the
combination of AG/CS polymers with ginsenoside Rb1 (extracted from
Panax Pseudo-Ginseng in Vietnam) and lovastatin as a controlled release
drug (cholesterol reduction, heart-related diseases treatment). Therefore,
I/PhD student chose the topic: “Researches about fabrication,
characterization, properties of alginate/chitosan polymer composite with
ginsenoside Rb1 and lovastatin”.
2. Subjects for study
The AG/CS composites which contain LOV for treatment of
cardiovascular diseases, lowering cholesterol and active ingredient
ginsenoside Rb1 found in Panax Pseudo-Ginseng Wall’s powder with their
characteristics, properties and applications.
3. Research Tasks
- Prepare natural polymer composites of AG/CS/LOV and
AG/CS/LOV/ginsenoside Rb1 in micrometer and nanometer sizes.
2
- Identify characteristics and properties of AG/CS/LOV and
AG/CS/LOV/ginsenoside Rb1 composites.
- Study on release LOV from AG/CS/LOV composites, release
LOV and ginsenoside Rb1 from AG/CS/LOV/ginsenoside Rb1 composites
in different pH buffer solutions.
- Set-up different kinetic models for drug release from
AG/CS/LOV and AG/CS/LOV/ginsenoside Rb1 composites in different pH
buffer solutions.
- Determine toxicity of AG/CS/LOV nanoparticles on rat.
4. Thesis structure
The thesis consists of 135 pages, including 21 tables of data, 50
figures and 144 references. The structure of the thesis consists of:
Introduction: 4 pages; Overview: 32 pages; Experimental part: 13 pages;
Results and discussion: 63 pages; Recent contributions of the thesis: 1
page; The list of published works: 2 pages; References: 18 pages. There is
also an appendix containing the spectrums and diagrams that measure the
characteristics and properties of components and AG/CS/LOV,
AG/CS/LOV/ginsenoside Rb1 composites with 11 pages.
CHAPTER 1. OVERVIEW
In chapter 1, we presented an overview of the following:
1. Chitosan (CS): Introduction, composition, structure, properties
and main applications of CS.
2. Alginate (AG): Introduction, structure, classification, physical
and chemical properties and applications of AG.
3. Polymer composite materials based on alginate/chitosan
(AG/CS) carrying drugs, pharmaceuticals: Domestic and foreign studies on
preparing methods and applications of AG/CS/drug composites in film and
particle forms.
4. Overview of lovastatin (LOV): General introduction about the
structure, properties, pharmacokinetics of LOV and research results on the
polymers carrying LOV in the world.
5. Overview of Panax Pseudo-ginseng and ginsenoside Rb1:
General introduction about the structure, characteristics, properties and
applications of Ginsenoside Rb1 and polymers carrying Panax Pseudoginseng and ginsenoside Rb1 in the world.
6. Current update on researching polymer composites carrying
drugs in Vietnam.
From the overview, it can be seen that the the use of AG/CS
polymer composites carrying drugs has certain effects, so this research
3
direction has been attracting the attention of scientists in the world.
However, so far, no work has been published on the characteristics and
properties of the combination of AG/CS polymers with ginsenoside Rb1
and LOV to a controlled release drug (cholesterol reduction, heart-related
diseases treatment).
CHAPTER 2. EXPERIMENTS AND METHODS
2.1. Raw materials, chemicals, and tools
2.1.1. Raw materials, chemicals
Alginate (AG), chitosan (CS), lovastatin (LOV) are produced by
Sigma Aldrich; Ginsenoside Rb1 (Rb1) is provided by the Institute of
Medicinal Materials, Ministry of Health.
Sodium tripolyphosphate (STPP), polyethylene oxide (PEO) and
polycaprolactone (PCL) are commercial products manufactured by Sigma
Aldrich.
Potassium chloride (KCl, solid), sodium hydroxide (NaOH, solid),
calcium chloride (CaCl2, solid), monopotassium phosphate (KH2PO4,
solid), 37% chlorhydric acid (HCl) solution, ethanol, acetic acid solution
(CH3COOH) 1% formulated with 99.5% acetic acid: commercial products
of China.
2.1.2. Experimental tools and devices
- Magnetic stirrer, analytical balance, dryer, ultrasonic machine,
centrifuge, etc.
- Glassware: measuring cylinders, pipettes, beakers, conical flasks,
burettes, glass chopsticks, etc.
2.1.3. Research devices
- Fourier Nexus 670 transformative infrared spectrometer (United
States) at the Institute for Tropical Technology - Vietnam Academy of
Science and Technology (VAST) ; Zetasizer Ver 620 device at the Institute
of Materials Science - VAST; Scanning field scanning electron microscope
(FESEM) (FESEM S- 4800, Hitachi, Japan) at the Institute of Hygiene and
Epidemiology and the Institute of Materials Science - VAST; Differential
scanning thermal analyzer DSC DSC-60 (Japan) at Department of
Chemistry, Hanoi National University of Education; UV-Vis Spectrometer
(Cintra 40, GBC, USA) at the Institute for Tropical Technology - VAST.
2.2. Preperation of alginate/chitosan (AG/CS) composites
carrying LOV
4
2.2.1. Preperation of alginate/chitosan/lovastatin (AG/CS/LOV)
composite films by solution method
120 mg of AG was dissolved in 20 ml of distilled water and 30 mg
of CS was dissolved in 20 ml of 1% acetic acid before mixing together to
obtain solution A (ratio of AG/CS is 80/20). 15 mg of LOV (10% in
comparison with total weight of AG-CS) was dissolved in 10 ml of ethanol
to obtain solution B. Solution B was added into solution A and this mixture
was sonicated for 15 minutes to obtain a uniform solution. Then, this
solution was poured into the petri dish and naturally evaporated solvent
about 48 hours. The obtained AG/CS/LOV film is abbreviated AC82-L10.
Similary, the content of LS was varied from 0 to 30 % and ratio of AG/CS
is fixed to prepare other samples. The obtained AG/CS/LOV films are
abbreviated AC82Lx (AG/CS 80/20 –LOV 10-30) where x is LOV content
(10-30%).
2.2.2. Preperation of AG/CS/LOV nanoparticles by ionic gelation
method
The AG/CS/LOV nanoparticles were prepared by ionic gelation
according to the following steps: First, AG was dissolved in distilled water
until a solution was formed before the addition of CaCl2 to increase the
viscosity of the solution (solution 1). In addition, CS was dissolved in 1%
acetic acid solution (solution 2), while LOV was dissolved in ethanol
(solution 3). Next, solution 1 was added dropwise to solution 2 and stirred
in an ultrasonic bath to form a uniform solution. Thereafter, solution 3 was
poured into the mixture of solution 1 and solution 2 and then ultrasonicated
five times for 5 mins. Finally, the mixed solution was centrifuged at 4°C
before lyophilization in a FreeZone 2.5 machine (Labconco, USA). The
ratios of AG, CS, LOV, and the coding of prepared samples are presented
in Table 2.1.
Table 2.1. Ratios of AG, CS, LOV and the coding of prepared
samples
AG (wt.%)
CS (wt.%)
LOV (wt.%)
Signature of
samples
60.6
30.4
9.0
AC6/3-L10
62.2
28.8
9.0
AC6.5/3-L10
63.6
27.3
9.0
AC7/3-L10
57.0
26.3
16.7
AC6.5/3-L20
52.6
24.3
23.1
AC6.5/3-L30
2.3. Preperation of alginate/chitosan/lovavstati/ginsenoside Rb1
(AG/CS/LOV/ginsenoside Rb1) composites
5
2.3.1. Preperation of AG/CS/LOV/ginsenoside Rb1 composite
films by solution method
Firstly, AG and CS with calculated weights were dissolved in
distilled water and 1% acetic acid solution, respectively whereas LOV and
ginsenoside Rb1 were dissolved in ethanol solvent (drug solution). Next,
the drug solution was dropped into the solution of AG which was added
CaCl2 and stirred on a magnetic stirrer. After that, the CS solution was
dropped to mixture of AG and drug, and the mixed solution was
ultrasonicated three times for 15 minutes. Then, the composite mixture was
poured into the petri dish and the solvent was been naturally evaporated for
24 hours. Finally, film production was dried at 500C for 8 hours. The mass
of AG and CS was fixed at 0.8 gram and 0.2 gram, respectively. The mass
of LOV and ginsenoside Rb1 was changed to make AG/CS/LOV/Rb1
composite films..
2.3.2. Preperation of AG/CS/LOV/ginsenoside Rb1 nanoparticles
by ionic gelation method
General procedure: 50 mg of STPP and 11 mg of CaCl2 were
dissolved in 50 ml and 20 ml of distilled water, respectively. 20 mg (10%)
of LOV and ginsenoside Rb1 (1 -5%) in were dissolved in 10 ml of ethanol
(drug solution). 100 mg CS was dissolved in 50 ml of 1% acetic acid
solution (CS solution) and 100 mg of AG in 50 ml of distilled water (AG
solution). 5 ml of CaCl2 solution was slowly added to STPP solution and
the mixed solution was ultrasonicated three times at 18000-20000 rpm for
15 minutes before mixing them with LOV solution. The mixed solution
was slowly added to AG solution and they were stirred by sonication for 30
minutes. The CS was poured into the mixed solution and this solution was
ultrasonicated three times at 18000-20000 rpm for 15 minutes. Finally, the
mixed solution was centrifuged at 4°C before lyophilization in a FreeZone
2.5 machine (Labconco, USA). Products after centrifuging was dried on
FreeZone 2.5 freeze-drying equipment (Labconco, USA) at the Institute of
Natural Products Chemistry - VAST to evaporate the remaining solvent in
the product. After that, the solid mixture is finely ground into a powder
with agate mortar and stored in a sealed PE bag.
2.4. Research methods
Fourier transform infrared spectroscopy (FTIR), dynamic light
scattering (DLS) method; Scanning field emission electron microscopy
(FESEM), Differential scanning calorimetric method (DSC), ultravioletvisible spectroscopy (UV-Vis)
2.5. In vitro release studies of alginate/chitosan/lovastatin
(AG/CS/LOV) and alginate/chitosan/lovatstain/ginsenoside Rb1
6
(AG/CS/LOV/ginsenoside Rb1) from composite materials in various
pH buffers
2.5.1. Setting - up calibration equations of LOV and ginsenoside
Rb1 in different pH buffers
Research simulating drug release process similar to the typical
digestive organs in the human body in environments with pH 2.0; pH 4.5;
pH 6.8 and pH 7.4 as the following process: weighing 0.01g LOV, put into
a beaker containing 200 ml of different pH buffer solutions and stirring
continuously for 48 hours at 400 rpm. After 48 hours, removing the
insoluble LOV and recording the UV - Vis spectrum of the LOV solution at
different concentrations by dilution method at the maximum absorption
wavelength of LOV in each buffer. Setting – up the calibration equation
for ginsenoside Rb1 is quite similar to LOV.
Processing data obtained by Excel software, find the calibration
equations of LOV in different pH media/solutions with corresponding
regression coefficients.
2.5.2. Determining drug carrying efficiency of AG/CS/LOV and
AG/CS/LOV/ginsenoside Rb1 composites
Similar to the calibration of LOV and ginsenoside Rb1 in different
pH buffer solutions, the calibration equations of LOV and ginsenoside Rb1
was also set – up in ethanol solvent to determine the content of LOV and
ginsenoside Rb1 carried by the AG/CS composites.
Steps to take: drying AG/CS/LOV/ginsenoside Rb1 composites in
a vacuum drying device at 25 - 30oC for 6 hours. Dissolve an exact mass of
the sample in a suitable volume of ethanol for 2 hours so that the LOV in
the sample dissolves completely into ethanol. Filter the solution and record
UV-Vis spectra at the maximum wavelengths corresponding to LOV and
ginsenoside Rb1. The volume of LOV and ginsenoside Rb1 carried by the
AG/CS compossite was processed by Excel software using the calibration
equations of LOV and ginsenoside Rb1 in ethanol. LOV and ginsenoside
Rb1 carrying capacity of AG/CS composite materials is calculated by the
following formula:
The amount of medication carried
Medicines carrying performance (%) =
x
The initial medication volume
100%.
2.5.3. In vitro drug release studies
In vitro LOV and ginsenoside Rb1 release process from
AG/CS/LOV and AG/CS/LOV/ginsenoside Rb1 composites were carried
out in different pH solutions. An exact amount of the composite material
was put into a 200 ml container containing a buffer solution at 37°C. Stir
7
the mixture with a magnetic stirrer at 400 rpm. Every hour from stirring,
draw exactly 10ml of solution and compensate 10ml buffer solution to
maintain the volume of solution. The filtered solution was measured optical
density at λmax determined from the calibration curve equation for each
different pH solution. The drug release test was conducted for 32
consecutive hours and the percentage of LOV and ginsenoside Rb1
released at time t was calculated using the following formula:
The amount of Lov released at t
% Lovgp =
x 100%
The initial Lov volume
The amount of Rb1 released at t
% Rb1gp =
x 100%.
The initial Rb1 volume
2.5.4. Kinetic studies
The drug release mechanism from polymer matrix usually is
calculated according to some popular kinetics as depicted below:
Zero-orderer kinetic (ZO): Wt = W0 + k1t
(Eq.1)
First-orderer kinetic (FO): log Ct = log C0 - k2t/2.303
(Eq.2)
Hixson – Crowell’s cube-root equation (HCW):
(100 – W)1/3 = 1001/3 – k3t
(Eq.3)
Higuchi’s square root of time equation (diffusion model) (HG):
Wt = k4t
(Eq.4)
Power law equation or Korsmeyer-Peppas model (KMP):
Mt/M∞ = k5tn
(Eq.5)
Where k is drug release constant; Ct and C0 is concentration of drug at
initial time and testing time; Wt and W0 is weight of drug at 0 and t hour;
Mt/M∞ is the fractional drug release into dissolution medium; and n is the
diffusional constant that characterizes the drugrelease transport mechanism.
With n ≤ 0.5, the drug diffusion from the polymer matrix corresponds to a
Fickian diffusion and a quasi-Fickian diffusion mechanism,
respectively. With 0.5 < n < 1, an anomalous, non-Fickian drug diffusion
occurs. With n = 1, a non-Fickian, case of II (relaxational) transport or
zero-order release kinetics could be observed, and n > 1 to super case II
transport.
To find the most suitable kinetic models for the release process of
LOV
and
ginsenoside
Rb1
from the
AG/CS/LOV
and
AG/CS/LOV/ginsenoside Rb1 composites (in film and particle forms), the
data of drug release content were calculated according to Eq.1-Eq.5
equations.
2.6. Toxicity test of AG/CS/LOV nanoparticles
Acute and subchronic toxicities of LOV-carrying nanoparticles was
carried out in vivo in adult healthy Swiss mice. The procedure was strictly
8
performed in a laboratory at the Military Medical Academy following the
guidance of the Organization for Economic Co-operation and Development
(OECD).
CHAPTER 3. RESULTS AND DISCUSSIONS
3.1.
Investigation
of
conditions
for
manufacturing
alginate/chitosan/lovastatin (AG/CS/LOV)
After investigating some conditions for making alginate/chitosan
(AG/CS) composite film, the results are as follows:
Condition Result
Condition
Result
AG:
CS
Ratio
:4
250C
Temperature
7:3
500C
900C
8:2
9:1
Evenly
Using
Used
ultrasonicator Didn’t Frontloaded
use
The results showed that when using an AG: CS ratio of 6: 4 or 7: 3
or stirring the mixture at high temperatures (500C and 900C), the polymer
solution mixture had agglomeration phenomenon and using ultrasonic
stirring at high speed, the mixed solution is more homogeneous. Therefore,
suitable conditions for creating AG/CS composite film are: AG: CS ratio =
8: 2; temperature: 250C; concentration of substances: [AG] = 0.32 g/ml;
[CS] = 0.1 g/ml; stirring time: 1 hour; using ultrasonicator.
3.2. Characteristics and properties of alginate/chitosan/lovastatin
composite material (AG/CS/LOV)
3.2.1. Characteristics and properties of AG/CS/LOV composite
film
3.2.1.1. Fourier transform infrared spectroscopy (FTIR) of
AG/CS/LOV composite film
9
.Figure 3.2 indicated the FTIR spectra of AG, CS and LOV. The FTIR
spectra of AG/CS/LOV (AC82-Lx) blend with the diffetent content of OVS were
presented in figure 3.3.
Figure 3.2. FTIR spectrum of AG,
CS and LOV.
Figure 3.3. FTIR spectrum of
composite film AC82Lx.
The peaks characterized for AG, CS and LOV also appeared in the
AC82-Lx FTIR spectra. Interestingly, a slight shift of corresponding peaks in
FTIR spectra of AC82-Lx in comparison with that of AG, CS or LOV
spectrum was found. This proved that the AG, CS and LOV had strong
interaction together though the dipole-dipole interaction and hydrogen
bonding between the amine and hydroxyl groups in CS with the cacboxyl
group in AG. When the change of LOV content, the peaks characterized for
corresponding groups in AC82-Lx blend films was not change much. It
implied that the drug content was not affect significantly on interoperability
between the drug and polymer blend (Table 3.1).
Table 3.1. Wavenumbers corresponding to peaks of specific functional
groups in AC82Lx nanocomposite films
Wavenumber (cm-1)
Oscillation
Samples
-NH2, -OH
CH
C=O
-NH2
C-O-C
AC82L10
3381
2926
1606
1414
1081
AC82L20
3441
2930
1603
1414
1035
AC82L30
3421
2935
1603
1414
1030
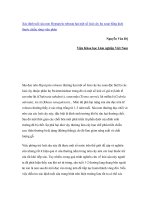
3.2.1.2. Morphology of AG/CS/LOV composite film
The SEM images of AC82 film, LOV and AC82L10, AC82L30
films in figure 3.4, figure 3.5 and figure. 3.6, respectively. It is clear that
LOV (bar shape) and CS (circle shape) were dispersed into AG matrix. For
AC82L10 film, the size of LOV and CS phases about 5-10 µm and 0.5-3
10
µm, respectively. The CS particles and LOV bars were agglomerated
together due to interactions between polymer-polymer and drug-drug. The
SEM image of AC82L30 film appeared CS and LOV phases with bigger
size, the size of CS phase in range 1 to 6 µm and LOV phase from 5 to 20
µm. The size of dispersion phases of blend film was increased at high LOV
content can be caused by affinity of drug-drug stronger than affinity of
drug-polymer leading to agglomeration of drug to bigger size. At LOV
content of 10%, dispersion phases in blend film had smaller size due to
good interaction of CS, AG and LOV by hydrogen bonding and dipole –
dipole interactions as mentioned above.
Figure 3.4. FESEM images of the
AC82 composite films
A
Figure 3.5. FESEM images of LOV
B
Figure 3.6. Ảnh FESEM images of AC82L10 (A) and AC82L30 (B)
composite films
3.2.2. Characteristics and properties of AG/CS/LOV composite
particles
3.2.2.1. FTIR spectra of AG/CS/LOV nanoparticles
Figure 3.7 is FTIR spectra of AG/CS/LOV nanoparticles prepared with
different content of LOV. It can observe clearly the slight shift of some
characteristic peaks when comparing the FTIR spectra of AG/CS/LOV
nanoparticles with the FTIR spectrum of LOV, CS and AG as was stated
above.
11
Figure 3.7. FTIR spectra of AG/CS/LOV nanoparticles prepared
with different content of LOV.
Clearly, it can be descried the difference in wavenumber of C=O groups in
the FTIR spectra of AG/CS/LOV nanoparticles in comparison with that of CS,
AG and LOV. In particular, the peaks corresponding to NH2, C-O, OH groups
in FTIR spectra of ACL nanoparticles also shifted significantly (3-105 cm-1) in
comparison with similar peaks in FTIR spectra of AG, CS and LOV. This
change can be caused by interactions between C=O, C-O, OH groups in LOV
with C-O, NH, OH groups in CS and C=O, C-O, OH groups in AG through
dipole-dipole interactions and hydrogen bond. In addition, the change in LOV
content is less effect on the structure of AG/CS/LOV nanoparticles becausse
the wavenumber of some characterized groups shift slightly, only 1-7 cm-1.
3.2.2.2. Size distribution of AG/CS/LOV composite particles
To investigate the influence of AG/CS ratio on the size distribution of
AG/CS/LOV nanoparticles, the AG/CS/LOV samples were prepared with
different AG/CS ratio. Figure 3.8 performed the size distribution diagrams
of AC6/3-L10, AC6.5/3-L10 and AC7/3-L10 samples. It can be seen that
the size particles of all samples changed in the range from 68 nm to 1718
nm. Among all prepared samples, the average diameter particles reached
minimum size at 86.2 ± 3.7 nm corresponding to AG/CS ratio of 6.5/3. The
different size distribution of tested samples may be caused by the
interaction diverse between solvent and drug, drug and drug, solvent and
polymer, polymer and polymer, solvent and solvent, drug and polymer, and
so on. In general, smaller the size of particles is, better distribution of drug
in solution is. So, the suitable AG/CS ratio for preparation AG/CS/LOV
nanoparticles is 6.5/3.
12
Figure 3.8. The size distribution
diagrams of AG/CS/LOV
nanoparticles prepared with
different AG/CS ratio.
Figure 3.9. The size distribution
diagrams of AG/CS /LOV
nanoparticles.
The AG/CS/LOV nanoparticles were prepared with the LOV content
changed in the range of 10 to 30 wt.% in comparison with the total weight
of AG and CS to investigate the effect of LOV on the particle size of
AG/CS/LOV nanoparticles. It is clearly observed that the size of
AG/CS/LOV nanoparticles with LOV content of 10 wt.% and 20 wt.% was
much smaller than that of AG/CS/LOV nanopaticles containing 30 wt.% of
LOV. This means that using LOV low weight in the AG/CS/LOV
nanoparticles can affected more effectively to particle size nanoparticles
than LOV large weight in the nanoparticles. It can suggest an explaintion:
at a small weight of LOV, the interactions between drug and polymer are
stronger than that between drug and drug. Therefore, polymers can absord a
large amount of drug and drug can distribute more regularly in the struture of
AG/CS/LOV nanoparticles and AG/CS/LOV nanoparticles have structure
closer and smaller size. In contrast, using a large of LOV, the interactions
between drug-drug predominate more than interactions between drugpolymer. Thus, it can occur the agglomeration of drug together in the struture
of AG/CS/LOV nanoparticles causing the AG/CS/LOV nanoparticles have
bigger size.
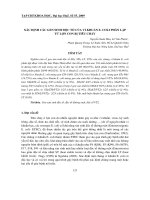
3.2.2.3. Morphology of AG/CS/LOV composite particles
The FESEM images of AC6.5/3 and AG/CS/LOV nanoparticles with
different content of LOV are demonstrated in figure 3.10. The AC6.5/3L20 and AC6.5/3-L30 nanoparticles had a tendency of agglomeration
together from 100-200nm basical particles to form larger particles with
micromet size (Figures 3.10 C,D). Interestingly, the AC6.5/3-L10
nanoparticles were spherical, separate and uniform size, only 50-80 nm
13
(Fig.3.10B). This result was similar to the size distribution of AC6.5/3-L10
nanoparticles presented above. Predictably, at 10 wt.% of LOV, it can
interact stronger and distribute better in CS and AG than other content of
LOV.
A
B
C
D
Figure 3.10. FESEM image of AG/CS nanocomposites without LOV:
AC6.5/3 (A) and with LOV: AC6.5/3-L10 (B); AC6.5/3-L20(C); AC6.5/3L30 (D).
3.2.2.4. Thermal behavior of AG/CS/LOV nanoparticles
Table 3.2 showed some thermal characteristics of LOV, CS, AG and
AG/CS/LOV nanoparticles with different LOV content. The melting temperature of
LOV, CS and AG was performed at 174.6oC, 106.8oC and 119.7oC, respectively
while the melting temperature of AG/CS/LOV nanoparticles was exhibited from
107.2oC - 113.4oC depending on the LOV content. Noticealy, the melting
temperature of AG/CS/LOV nanoparticles was higher than that of CS and lower
than that of AG. It can be confirmed that CS and AG were partly combatibility
through some physical interactions as mentioned. Therefore, the structure of
AG/CS/LOV nanoparticles became closer and drug release from nanoparticles can
be controlled more easily.
Table 3.2. Melting temperature and enthalpy of AG/CS/LOV nanoparticles
Sample
Tm (oC)
ΔHm (J/g)
AC6.5/3
115.4
500.1
AC6.5/3-L10
113.4
545.2
AC6.5/3-L20
107.5
467.4
AC6.5/3-L30
106.2
541.3
14
The AG/CS/LOV nanoparticles with different LOV content had a
difference in melting temperature and melting enthalpy as listed in Table 3.
This result can explained by LOV interacts weakly with CS, AG at the
large content of LOV, leading to structure of AG/CS/LOV nanoparticles
less tightly and easier for melting. As a result, AC6.5/3-L20 and AC6.5/3L30 nanoparticles have melting temperature and melting enthalpy lower
than the AC6.5/3-L10 nanoparticles.
3.3.
Characteristics
and
properties
of
alginate/chitosan/lovastatin/ginsenoside Rb1 (AG/CS/LOV/ginsenoside
Rb1) composite materials
3.3.1. Characteristics and properties of AG/CS/LOV/ginsenoside
Rb1 composite films
3.3.1.1. FTIR spectra of AG/CS/LOV/ginsenoside Rb1 composite films
Figures 3.11 and 3.12 presented the FTIR spectra of AC82L10Rx
composite films. It can be seen the characteristic peaks of AG, CS, LOV,
and ginsenoside Rb1 were appeared in the FTIR spectra of AC82L10Rx
composite films. The peaks of -NH3OC group which were formed by the
electrostatic interaction between the protonated amino groups of CS and the
carboxylate groups of AG dissociated to COO− groups were located at
2167 cm-1 and 2360 cm-1.
Figure 3.11. FTIR spectrum of
Figure 3.12. FTIR spectrum of
AC82L10Rx composite film.
AC82-Lx-R5 composite film
As adding ginsenoside Rb1 into the AG/CS/LOV composite films, it was
recognized a strong shift of NH3OC and the hydroxyl group in the FTIR spectra of
CS, AG, LOV, ginsenoside Rb1 and AC82L10Rx composite films. This proved that
the presence of ginsenoside Rb1 could lead to the stronger electrostatic interaction
between AG and CS as well as increase the intermolecular hydrogen bond between
ginsenoside Rb1, LOV, AG and CS.
3.3.1.2. Morphology of AG/CS/LOV/ginsenoside Rb1 composite films
15
Figure 3.13 displayed the FESEM images of the AC82L10Rx
composite films at different content of ginsenoside Rb1. It can be seen that
the presence of ginsenoside Rb1 in the composite film helped the
dispersion of LOV to become more evenly in AG/CS blend and the size of
LOV bars were significantly decreased. For instance, LOV had bar and rod
shape with size in the range from 30 µm to 40 µm in AG/CS/10% LOV
(AC82L10R0) film and LOV size was reduced (5 – 10 µm) when adding 5
wt.% of ginsenoside Rb1. This result exhibited that ginsenoside Rb1 can
play an important role of auxiliary dispersion and a compatibilizer in the
AC82L10Rx composite films thanks to the increase in intermolecular
hydrogen bond of components in the film. As a result, the agglomeration of
LOV in the composite films was decreased. Similarly, the FESEM images
of AG/CS/LOV/5% ginsenoside Rb1 composite films with variable LOV
content (AC82-Lx-R5) were expressed in Figure 3.14.
AC82L10
AC82L10R1
AC82L10R3
AC82L10R5
Figure 3.13. FESEM image of the AC82L10Rx composite film.
AC82
(a)
AC82R5 (b)
AC82L5R5 (c)
AC82L10R5 (d)
AC82L15R5 (e)
AC82L20R5 (f)
Figure 3.14. FESEM images of composite films: AC82 (a), AC82R5 (b),
AC82L5R5 (c), AC82L10R5 (d), AC82L15R5 (e) and AC82L20R5 (f).
3.3.1.3. Thermal behavior of AG/CS/LOV/ginsenoside Rb1 composite films
From data in table 3.3, the temperature melting of AC82L10R0
composite film was significantly lower than that of AG, CS and LOV. The
AC82L10R0 film had two endothermic peaks at close to 1300C and 1800C
characterized for the dehydration and melting of polymer blend. The
decomposition of the biopolymers took place represented by an exothermic
peak at close 2400C similar to the decomposition of AG. When adding
16
ginsenoside Rb1 into AC82L10R0 film, the melting temperature of the
AC82L10Rx composite films was fixed but their melting enthalpy had a
great change. The decrease in the melting enthalpy as increasing the
ginsenoside Rb1 content in the composite films can confirm the reduction
in the relative crystal degree of the composite films. It can affect on the
drug release from AG/CS/LOV and AG/CS/LOV/ginsenoside Rb1
composite films as discussed below.
Table 3.3. Thermal parameters obtained from DSC diagrams of AG, CS,
LOV, ginsenoside Rb1 and AG/CS/LOV/ginsenoside Rb1 composite films
Exothermic
Endothermic peak
DSC
peak (oC)
Melting
Enthalpy
Sample
temperature
melting
(oC)
(J/g)
AG
119.7
358.6
240 - 2600C
CS
106.8
130.6
LOV
174.6
Ginsenoside Rb1
98.9
186.7
134.1
444.6
AC82L10
240.6
181.6
133.7
401.6
AC82L10R1
241.4
178.8
130.1
415.8
AC82L10R3
239.7
180.7
133.5
383.1
AC82L10R5
243.9
178.4
AC82R5
131.5
520.7
241.6
AC82L5R5
120.9
293.2
241.4
136.1
371.1
AC82L15R5
244.7
179.4
1334.0
444.8
AC82L20R5
241.4
181.2
3.3.2. Characteristics and properties of AG/CS/LOV/ginsenoside
Rb1 composite particles
3.3.2.1. FTIR spectra of AG/CS/LOV/ginsenoside Rb1 nanoparticles
FTIR spectra of AG/CS/LOV/ginsenoside Rb1 nanocomposites
using sodium tripolyphosphate (STPP) as a cross-linking agent were
indicated in Figure 3.15.
17
Figure 3.15. FTIR spectra of AC11L10Rx composite particles.
When changing the content of ginsenoside Rb1 in
AG/CS/LOV/ginsenoside Rb1 composite particles (AC11L10Rx), the
positions of wave number corresponding to the characteristic peaks for
functional groups in AC11L10Rx composite particles was similar. Thus,
the content of ginsenoside Rb1 did not affect on the interaction between the
components in AC11L10Rx composite particles.
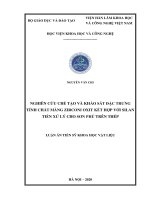
3.3.2.2. Morphology of AG/CS/LOV/Rb1 composite particles
The FESEM image of AC11L10R0 composite particles (ratio of
AG/CS was fixed at 1/1 (wt.%/wt.%), the content of LOV was 10 wt. %)
at magnifications of 10,000 times and 30,000 times was represented in
Figure 3.16. Observing SEM images, it can be seen that the AC11L10R0
composite particles had an uneven structure, the LOV bars and LOV
particles dispersed in AG/CS polymer blend with a size of about 1.5 μm
had a tendency to agglomeration to form bigger – size particles.
Figure 3.16. FESEM image of
Figure 3.17. FESEM image of
AC11L10 sample.
AC11L10R1 sample.
The dispersion ability of LOV in AG/CS polymer blend was improved
when ginsenoside Rb1 was added to the AC11L10R0 nanoparticles. Observing the
SEM image of the AC11L10Rx nanoparticles (Figures 3.17 - 3.19), it is clear that the
18
composites particles had tended to be separated when using a small amount of 1
wt.% ginsenoside Rb1. However, the LOV bars had not been completely broken in
the AG/CS polymer blend.
Figure 3.18. FESEM image of
Figure 3.19. FESEM image of
AC11L10R3 sample.
AC11L10R5 sample.
Observing the FESEM image of AC11L10R3 nanoparticles (Figure 3.18),
it can be seen the nanoparticles were formed quite uniformly and separated with a
size of about 100 - 300 nm. By increasing the content of ginsenoside Rb1 to 5 wt.%,
the particle size of the nanoparticles were greatly reduced, even reached to several
tens of nanometers (Figure 3.19). However, LOV bars and particles tended to
coalesce forming larger blocks, about 200 nm - 1 μm in AG/CS polymer blend. This
can be explained by the increase in the content of ginsenoside Rb1 which can
increase the internal molecular linkage between the ginsenoside Rb1 molecules,
leading to the agglomeration of ginsenoside Rb1 particles. As a result, the
AC11L10Rx nanoparticles having ginsenoside content Rb1, x > 3 wt.%) were
obtained with uneven structures.
3.3.2.3. Size distribution of AG/CS/LOV/ginsenoside Rb1 composite
particles
Table 3.4 performed particle size, peak width of the AC11L10
composite particles with different content of ginsenoside Rb1.
Table 3.4. Average particle size of AC11L10Rx composite particles
Peak
Average particle
Particle size
Particle size
width
size (nm)
range (nm)
d (nm)
%
(nm) (r)
D = d ± r/2
AC11L10R0 480 – 1053
586.80 24.30 123.70
586.80 ± 61.85
76 – 150
78.20
2.30
9.78
78.20 ± 4.89
AC11L10R1
250 – 800
369.10 22.90
76.92
369.10 ± 38.46
AC11L10R3
95 – 950
328.50 12.70 136.90
328.50 ± 68.45
19
4000 – 6500 5274.00 1.70
424.60 5274.00 ± 212.30
55 – 90
58.40
0.40
10.36
58.40 ± 5.18
AC11L10R5 90 – 1050
333.50 10.80 158.50
333.50 ± 79.25
4500 – 8500 5118.00 2.70
537.00 5118.00 ± 268.50
It was clear that the AC11L10 composite particles without
ginsenoside Rb1 had the largest average particle size. The remaining samples
with different ginsenoside Rb1 content had relatively uniform average
particle size (328.5 ± 68.45 nm - 369.1 ± 38.46 nm) and smaller than the
AC11L10 composite particles. The AC11L10R5 nanoparticles had average
particle sizes smaller than the other two samples. This can be due to
ginsenoside Rb1 acting as a size stabilizer for AG/CS/LOV nanoparticles.
In the presence of ginsenoside Rb1, thanks to the interaction of ginsenoside
Rb1 with AG, CS and LOV, the dispersion ability of LOV bars into AG/CS
polymer blend was improved.
3.3.2.4. Thermal bahavior analysis of AG/CS/LOV/ginsenoside Rb1
nanoparticles
DSC diagrams of the AG/CS/LOV/ginsenoside Rb1 composite
particles using sodium tripolyphosphate (STPP) as a crosslinking agent
were demonstrated in Figure 3.20.
Figure 3.20. DSC diagram of AC11L10Rx composite particles.
Observing the DSC diagram of the composite particle AC11L10R0, it can
be seen that 4 peaks were corresponding to 4 phase transition processes of the
composite particles. Endothermic and exothermic peaks of the composite particles
reflected the melting and decomposition processes of the components in the
composite particle to form peaks larger than those corresponding peak on the DSC
diagrams of original AG, CS, and LOV.
3.3.2.5.
Drug
carrying
efficiency
of
AG/CS/LOV
and
AG/CS/LOV/ginsenoside Rb1 composite particles
LOV and ginsenoside Rb1 carrying efficiency of the composite
particles depends on AG/CS ratio, LOV content and ginsenoside Rb1
content, method of preparing composite particles. Tables 3.5 and 3.6
20
presented the LOV and ginsenoside Rb1 carrying efficiency of
AC11L10Rx composite particles. The LOV and ginsenoside Rb1 carrying
efficiency was determined by the ultraviolet-visible spectroscopy method
using the maximum wavelengths corresponding to LOV and ginsenoside
Rb1. The obtained results showed that the AC11L10R3 composite particles
had the highest both LOV and ginsenoside Rb1 carrying capacity.
Table 3.5. LOV carrying efficiency of AC11L10Rx composite particles
Optical
LOV carrying
LOV amount
Sample
density
efficiency (%)
(g)
AC11L10R0
0.57
62.81
0.0126
AC11L10R1
0.58
61.38
0.0123
AC11L10R3
0.63
77.69
0.0155
AC11L10R5
0.59
70.64
0.0141
Table 3.6. Ginsenoside Rb1 carrying efficiency of AC11L10Rx nanoparticles
Ginsenoside Rb1
Optical
Ginsenoside Rb1
Sample
carrying
density
amount(g)
efficiency (%)
AC11L10R1
0.0039
71.22
0.00142
AC11L10R3
0.0074
76.80
0.00461
AC11L10R5
0.0103
73.31
0.00733
3.4. In vitro drug release and kinetic studies from AG/CS/LOV
and AG/CS/LOV/ginsenoside Rb1 composites in different pH buffer
solutions
3.4.1. Study on release of LOV and ginsenoside Rb1 from
AG/CS/LOV composite films and AG/CS/LOV/ginsenoside Rb1
Figure 3.21 and 3.22 displayed the content of LOV released from
the AC82Lx composite films with the various content of LOV from 10 to
30 wt.% in pH 2 and pH 7.4 buffer solutions.
Figure 3.21. Content of LOV
released from AC82Lx composite
films with various initial LOV
content in pH 2.0 solution.
Figure 3.22. Content of LOV
released from AC82Lx composite
films with various initial LOV
content in pH 7.4 solution.
21
It can be seen that the LOV content significantly influenced on
content of LOV released from the composite films. The content of LOV
released from AC82Lx nanocomposite films was decreased with rising
initial content of LOV in the nanocomposite films at the same pH solution
and testing time. In the pH 2.0 and pH 7.4 solutions, process of LOV
release from the AC82Lx nanocomposite films had two stages: rapid
release stage at the first 12 hours and then the slow release (controlled)
stage. This results were similar to the release of LOV and ginsenoside Rb1
from AG/CS/LOV/ginsenoside Rb1 composite films.
Figure 3.23. Content of ginsenoside
Rb1 released from AC82L10Rx
nanocomposite films in pH 2
solution.
Figure 3.24. Content of ginsenoside
Rb1 released from AC82L10Rx
nanocomposite films in pH 7.4
solution.
3.4.2. Kinetics of LOV and Rb1 release from AG/CS/LOV and
AG/CS/LOV/ginsenoside Rb1 composite films
Figure 3.25 presented the dynamic lines for LOV releasing from
AG/CS/LOV nanocomposite films containing 3 wt.% PEO as
compatibilizer in pH 2.0 solution according to 2 fast and slow release
stages. The Kosmeyer - Peppas (KMP) dynamic model had the highest
regression coefficient which was always higher 0.9 for all of composite
films. Observing the n values in the equation, it was clearly regcognize that
the slow release process of both of LOV and Rb1 was non-Fickian
transport (n < 0.45) while the slow release process of LOV and ginsenoside
Rb1 follow Fickian diffusion in both of the acid and base enviroment.
22
Figure 3.25. Kinetic models of LOV released from AG/CS/LOV
nanocomposite films containing 3 wt.% PEO in pH 2.0 solution.
3.4.3. Study on release of LOV and ginsenoside Rb1 from
AG/CS/LOV and AG/CS/LOV/ginsenoside Rb1 composite particles
Figures 3.26 and 3.27 displayed the content of LOV released from
the AC6.5/3-Lx composite particles with the various content of LOV from
10 to 30 wt.% in pH 2 and pH 7.4 solutions. It is clearly that the process of
releasing LOV from AG/CS/LOV nanoparticles also included 2 stages: fast
release and slow release. The content of LOV released from AC6.5/3-Lx
composite particles was decreased with rising initial content of LOV in the
composite particles at the same pH solution and testing time.
23
Figure 3.26. Content of LOV
Figure 3.27. Content of LOV
released from AG/CS/LOV
released from AG/CS/LOV
composite particles with various
composite particles with various
initial LOV content in pH 2.0
initial LOV content in pH 7.4
solution.
solution.
3.4.4. Kinetics of LOV and Rb1 release from AG/CS/LOV and
AG/CS/LOV/ginsenoside Rb1 nanoparticles
The kinetics of LOV release process from AC6.5/3-L10 composite
particles in different pH solutions (7.4, 6.5, 4.5 and 2.0) were statistically calculated
in table 3.7. It is clear that the KMP dynamic model had the highest regression
coefficient which were always higher 0.9 for all of samples. The slow release
process of both of LOV and Rb1 was non-Fickian transport (n < 0.45) while the
slow release process of LOV and ginsenoside Rb1 follow Fickian diffusion in both
of the acid and base environment.
Table 3.7. Regression coefficient (R2) of kinetic equations reflects LOV
released from AC6.5/3-L10 composite particles in different pH solutions
LOV quick release stage
pH of solution
ZO
FO
HG
HCW
KMP
pH = 7.4
0.99
0.96
0.98
0.95
0.99
pH = 6.5
0.96
0.98
0.94
0.96
0.99
pH = 4.5
0.97
0.99
0.91
0.90
0.99
pH = 2.0
0.98
0.96
0.93
0.92
0.99
LOV slow release stage
pH of solution
ZO
FO
HG
HCW
KMP
pH = 7.4
0.94
0.90
0.99
0.99
0.97
pH = 6.5
0.99
0.92
0.92
0.93
0.98
pH = 4.5
0.95
0.97
0.97
0.93
0.95
pH = 2.0
0.96
0.97
0.97
0.91
0.98
3.5. Study on toxicity of AG/CS/LOV nanoparticles on rat
Table 3.8 - 3.11 displayed mean body weight, hematological and
biochemical parameters, rats’ organs mean weights of rats treated by
AG/CS/LOV nanoparticles with two doses of 100, 300 mg/kg body and