Experimental scrutiny to induce the ramification of cutting parameters in CNC turning of AISI H21 steel employing response surface methodology
Bạn đang xem bản rút gọn của tài liệu. Xem và tải ngay bản đầy đủ của tài liệu tại đây (1.42 MB, 12 trang )
International Journal of Industrial Engineering Computations 6 (2015) 315–326
Contents lists available at GrowingScience
International Journal of Industrial Engineering Computations
homepage: www.GrowingScience.com/ijiec
Experimental scrutiny to induce the ramification of cutting parameters in CNC turning of AISI
H21 steel employing response surface methodology
Rajan Jindala and Deepak Choudharyb*
a
M.Tech. Scholar, Department of Mechanical Engineering, Yamuna Institute of Engineering & Technology, Gadholi, Distt. Yamuna Nagar, 133103, India
Assistant Professor, Department of Mechanical Engineering, Yamuna Institute of Engineering & Technology, Gadholi, Distt. Yamuna Nagar, 133103,
India
b
CHRONICLE
Article history:
Received October 14 2014
Received in Revised Format
February 10 2015
Accepted March 27 2015
Available online
March 28 2015
Keywords:
Analysis of variance
Face centered central composite
design
Response surface methodology
Surface roughness
Turning process
ABSTRACT
This paper demonstrates an experimental scrutiny into turning process of hot work tool steel
AISI H21 under dry machining plight. In this paper, face centered central composite design
concealed by response surface methodology is practiced and analysis of variance is implemented
to analyze the eloquent benefaction of machining parameters on responses. To access
accommodate between the surface roughness and the MRR, an approach for concurrent
optimization of multi-objective characteristics based on comprehensive desirability function is
employed. The multi objective optimization concludes a spindle speed of 1599.568 rpm, feed
rate of 0.262 mm/rev and depth of cut of 2 mm.
© 2015 Growing Science Ltd. All rights reserved
1. Introduction
In any machining operation, along with accomplishing the factual dimensions, increase metal removal
rate and a good surface trait are also important. Quality influences the degree of amusement of the
customers. At the same time, higher MRR is coveted by the industry to cope up with mass production
product in shorter time without enduring the product trait. Higher MRR is accomplished by increasing
the process parameters like depth of cut, feed and cutting speed. However, very high cutting speed craves
the larger power which may eclipse the power accessible in the machine tool. Also at the same time, the
cutting temperature increases with the increase in the process parameters. This influences both the tool
as well as the product as it causes dimensional inaccuracies by built-up-edge formation, thermal
deformation and amends the keenness of the tool and results in reverberation of the machine tool. So,
excerption of pertinent process parameter plays a very vital aspect in the efficiency, effectiveness and
comprehensive economy of manufacturing to accomplish the targets higher MRR and higher product
trait.
* Corresponding author. Tel: +919896911777
E-mail: (D. Choudhary)
© 2015 Growing Science Ltd. All rights reserved.
doi: 10.5267/j.ijiec.2015.3.003
316
This leads optimization problem which shots to access best parametric combination for the said
manufacturing process. Optimization of input variables is one of the most important characteristics in
any process planning of materials to lessen the cost and time for machining. However, optimization of
multi-objective problems is a great commitment of today’s producers to yield the precision parts at little
costs. In order to advance and optimize a surface roughness and material removal rate model, it is
indispensable to perceive the current status of work in this area. A number of researchers have been
focused on an appropriate method to evaluate the optimal value of the process parameters to predict the
surface roughness and material removal rate. Jiang et al. (1997) examined the effect of austenite grain
size on tool life & chip deformation in turning of AISI 304L austenitic stainless steel bar and showed
that inhomogeneous distribution of grain size up to a depth of 15 mm of the bar, resulted in tool edge
breakage & lower tool life when turning hot-forged bar as compared with quenched bars. Noordin et al.
(2004) described the performance of a multi-layer WC tool using RSM when turning AISI 1045 steel.
The experimental results indicated that feed was the most important parameter that influenced the
tangential force & the surface roughness.
Gaitonde et al. (2008) determined the optimum amount of MQL and the most appropriate cutting speed
and feed rate during turning of brass using K10 carbide tool. The optimization results indicated that MQL
of 200 ml/h, cutting speed of 200 m/min and a feed rate of 0.05 mm/rev were essential to simultaneously
minimize surface roughness and specific cutting force. Aggarwal et al. (2008) presented an experimental
investigation into the effect of feed rate, depth of cut, cutting speed, cutting environment and nose radius
in CNC turning of AISI P-20 tool steel and revealed that cryogenic environment was the most prominent
factor in minimizing power consumption followed by depth of cut and cutting speed & also concluded
that although both techniques predicted approximately similar result, RSM technique, however, seemed
to an edge over the Taguchi's technique. Kaladhar et al. (2010) optimized the process parameters in
turning of AISI 202 austenitic stainless steel using CVD coated cemented carbide tools. From the
analysis, it was observed that the feed was the most prominent factor that affected the surface roughness
followed by nose radius. Mahdavinejad and Saeedy (2011) optimized turning parameters of AISI 304
stainless steel. It was showed that cutting speed and feed rate had the main effect on the flank wear &
surface roughness respectively and the use of cutting fluid resulted in greater tool life and better surface
finish.
Rodríguez et al. (2011) conducted experiments on AISI 316L, AISI 304 and AISI 420 steels during a
turning process and observed that the cutting temp. increased when feed, cutting speed, depth of cut and
material maximum strength increased and cutting temperature decreased with the increased of material’s
thermal conductivity. Asilturk et al. (2011) focused on optimizing turning parameters based on the
Taguchi method to minimize surface roughness (Ra and Rz). Dry turning tests were carried out on AISI
4140 (51 HRC) with coated carbide cutting tools. Results indicated that the feed rate had the most
significant effect on Ra and Rz. Sivaraman et al. (2012a) turned the multiphase (ferrite-bainitemartensite) micro alloyed steel to study the effect of machining parameters such as feed, cutting speed
and depth of cut on cutting forces. The result showed that feed and depth of cut influenced more on
cutting force than cutting speed. Kumar et al. (2012) examined the effect of process parameters in turning
of carbon alloy steels in a CNC lathe. They used SAE8620, EN8, EN19, EN24 and EN47 carbon alloy
steels for turning. It was observed that the surface roughness increased with increased feed rate and was
higher at lower speeds and vice versa for all feed rates. Sivaraman et al. (2012b) carried out the machining
of multiphase (ferrite-bainite-martensite) microalloyed steel in a high speed lathe to assess the
machinability. The result showed that the feed rate and depth of cut influenced more on cutting force and
for surface roughness the only influencing parameter was feed rate. Khamel et al. (2012) investigated the
effect of process variables (depth of cut, feed rate & cutting speed) on performance characteristics such
as surface roughness, cutting forces and tool life in hard turning of AISI 52100 bearing steel with CBN
tool. The results showed that feed rate and cutting speed greatly affected the tool life and surface
roughness. However, depth of cut revealed maximum influenced on cutting forces.
R. Jindal and D. Choudhary / International Journal of Industrial Engineering Computations 6 (2015)
317
Barik and Mandal (2012) presented an experimental study of roughness characteristics of surface
roughness generated in CNC turning of EN 31 alloy steel. It was seen that the surface roughness
parameter decreased with increased in spindle speed and depth of cut but increased with increased in feed
rate. Kumbhar and Waghmare (2013) used Taguchi approach to find optimum process parameters for
turning hardened EN31 alloy steel. The conclusion revealed that the feed rate was the most effective
parameter on surface roughness & tool life. Ahmed et al. (2013) investigated the effect of tool overhang
in the turning process on surface quality of the work piece& tool wear. They observed that the effect of
depth of cut on the surface roughness was negligible and deflection of the cutting tool increased with
increased in tool overhang.
This is winded up from literature review that the Taguchi design of experiments & response surface
methodology techniques are being broadly employed in the current & past research works on turning
process. Despite the techniques RSM and Taguchi predicted near similar results, however, RSM
technique sounds to an edge over the Taguchi’s technique. It has also been noted that during turning, the
cutting parameters which has prominent consequence on performance characteristics are speed, feed and
depth of cut. Therefore, these are the parameters which are preferred to perform the experimental work
on AISI H21 steel.
2. Design of Experiments (DOE)
The most widely employed techniques for surface roughness and material removal rate prediction in
terms of machining parameters is the RSM. Therefore, face centered central composite design concealed
by Response surface methodology is employed for the experiment plan in this work.
3. Experimental Campaign
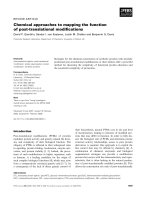
In the pageant work, a set of experiments are run on the work piece AISI H21 hot work tool steel (as
illustrated in Fig. 1) to appraise the consequence of machining parameters such as feed rate, spindle speed
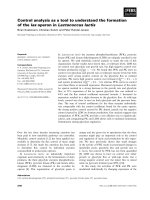
& depth of cut on material removal rate and surface roughness. The cutting insert which is employed for
the experiment is Taegu Tech make TT8135 grade CNMG 120412 MP TiN coated carbide insert as
depicted in Fig. 2. It is clenched onto a tool holder, ISO designation DCLNR 20 20 K 12. The total length
of the work piece is seized as 750 mm which is cut into 7 pieces in the cylindrical pattern of steel bars
with diameter of 50 mm and length of 90 mm by employing Power Hacksaw. Then, 30mm length of each
bar is retained in the chuck and 60 mm is turned in dry plight to perform 3 experiments in a single piece.
Fig. 1. Hot work tool steel (H21) rod
Fig. 2. Turning insert
AISI H21 steel is employed for high stressed hot work tools such as mandrels, dies and containers for
metal tube and rod extrusion, screws, rivets, hot extrusion tools, tools for manufacture of hollows, die
casting tools, die inserts, extrusion dies for brass, bronze and steel, hot-press dies, drawing and hotswaging dies etc. The Design Expert_ software (Stat-Ease Inc., USA) version 9.0.3.1 is employed to
318
advance the experimental design matrix for RSM and to interpret the data possessed from
experimentation. The range of each parameter is associated at three different levels, namely low, medium,
and high based on tool manufacturer recommendation. The process parameters, their designated symbols
and ranges are demonstrated in Table 1.
Table 1
Levels of Independent Control Parameters
Sr. No.
Cutting Parameters
Symbol
1
2
3
Spindle speed
Feed rate
Depth of cut
N
f
a
Level of Parameters
-1
0
1
400
1000
1600
0.15
0.25
0.35
1.5
1.75
2
Unit
RPM
mm/rev
mm
3.1 Composition testing
Composition Testing employs the EDAX analysis which exemplifies Energy Dispersive X-ray
spectroscopy. Composition of AISI H21 steel is approved on Polyvac 181 TJM Spectrometer. The
chemical composition of AISI H21 hot work tool steel is exhibited in Table 2.
Table 2
Percentage of Elements in H21 hot work tool steel
Elements
Carbon, C
Silicon, Si
Manganese, Mn
Chromium, Cr
Phosphorus, P
Sulphur, S
Vanadium, V
Tungsten, W
Molybdenum, Mo
Cobalt, Co
Tin, Sn
Iron, Fe
%age
0.321
0.242
0.335
3.300
0.023
0.020
0.393
9.120
0.350
0.150
0.015
85.630
3.2 Properties of the material
The various physical and mechanical properties of AISI H21steel are shown in Tables 3 and Table 4.
Table 3
Physical Properties
Physical Properties
Specific gravity g/cc
Density (kg/m3)
Table 4
Mechanical Properties
Mechanical Properties
Poisson's ratio
Elastic modulus (GPa)
Metric
8.19
8.28 x 1000
Metric
0.27 - 0.30
190 - 210
Conditions
25
25
T (°C)
319
R. Jindal and D. Choudhary / International Journal of Industrial Engineering Computations 6 (2015)
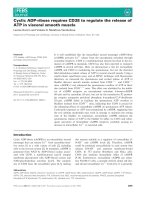
3.3 Equipment employed
A HMT CNC turning center STALLION 100HS is employed for experimentation as presented in Fig. 3.
The lathe equipped with variable spindle speed from 100 rpm to 3000 rpm, and a 5.5 kW motor drive is
employed for the tests.
Fig. 3. A HMT CNC turning center STALLION
100HS
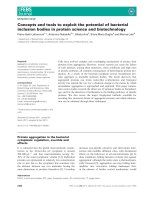
Fig. 4. Mitutoyo surftest-4 surface roughness
tester
3.4 Roughness measurement
Surface roughness is consistent employing stylus type Mitutoyo surftest-4 on a turned length of 20 mm
as exposed in Fig. 4. Three measurements are run along the length of cut on each work piece and the
average Ra value is listed.
Table 5
Experimental Design matrix with uncoded values and observed responses
Stadard
order
Spindle
speed,
r.p.m.
Feed rate
mm/rev
Depth of
cut, mm
Material
removal rate,
mm3/sec
Ra 1
Ra 2
Ra 3
Mean surface
roughness, Ra in
µm
1
2
3
4
5
6
7
8
9
10
11
12
13
14
15
16
17
18
19
20
400
1600
400
1600
400
1600
400
1600
400
1600
1000
1000
1000
1000
1000
1000
1000
1000
1000
1000
0.15
0.15
0.35
0.35
0.15
0.15
0.35
0.35
0.25
0.25
0.15
0.35
0.25
0.25
0.25
0.25
0.25
0.25
0.25
0.25
1.50
1.50
1.50
1.50
2.00
2.00
2.00
2.00
1.75
1.75
1.75
1.75
1.50
2.00
1.75
1.75
1.75
1.75
1.75
1.75
226.08
904.32
527.52
2110.08
301.44
1205.76
703.36
2813.44
439.6
1758.4
659.4
1538.6
942.00
1256.00
1099.00
1099.00
1099.00
1099.00
1099.00
1099.00
2.63
2.29
2.83
3.02
2.75
2.47
2.81
2.86
3.04
2.05
2.59
2.94
2.20
2.50
2.06
2.27
2.02
2.53
2.72
2.74
2.18
2.00
3.15
3.12
2.78
2.18
3.11
3.00
3.00
1.95
2.98
2.86
2.67
3.16
2.48
3.42
2.64
2.81
2.7
2.57
2.75
2.10
2.49
3.02
2.77
2.36
3.35
2.82
2.47
2.30
2.55
2.77
2.64
2.76
3.20
2.80
2.81
3.15
2.40
2.42
2.520
2.130
2.823
3.053
2.767
2.337
3.090
2.893
2.837
2.100
2.707
2.857
2.503
2.807
2.580
2.830
2.490
2.830
2.607
2.577
320
In Table 5 material removal rate is computed by the product of cutting speed (Vc), feed rate (f) and depth
of cut (a) and revealed in mm3/sec as:
MRR = 1000 × Vc × f ×a (mm3/min)
And cutting speed is calculated as,
𝑉𝑉𝑉𝑉 =
𝜋𝜋 × 𝐷𝐷 × 𝑁𝑁
1000
Where Vc = cutting speed in m/min; D = Diameter of work piece in mm; N = Spindle Speed in r.p.m.
4. Results and Discussion
4.1 Development of empirical models
Employing the experimental data, analytical model for surface roughness and material removal rate is
developed using multiple linear regression (MLR) analysis. The dependent variable surface roughness
and MRR is conceived as a linear consolidation of the independent variables namely feed rate, spindle
speed & depth of cut.
Since, there are large numbers of variables governing the process, so empirical models are imperative to
represent the process. However, these models are advanced using only the momentous factors.
4.2 Final equation in terms of actual factors for MRR and Ra
𝑀𝑀𝑀𝑀𝑀𝑀 = 1099 − 1.099𝑁𝑁 − 4396𝑓𝑓 − 628𝑎𝑎 + 4.396 𝑁𝑁𝑁𝑁 + 0.628𝑁𝑁𝑁𝑁 + 2512𝑓𝑓𝑓𝑓
𝑅𝑅𝑅𝑅 = 2.362 − (2.550 × 10⁻⁴ 𝑁𝑁) + 2.240𝑓𝑓
(1)
(2)
These equations are in terms of actual factors which can be employed to build predictions about the
responses MRR and surface roughness (Ra) for given levels of each factor.
4.3 Analysis of variance (ANOVA)
In order to develop empirical models, statistical analysis of the experimental results is indispensable by
employing analysis of variance. ANOVA is a computational technique that empowers the estimation of
the relative contributions of each of the control factors to the comprehensive deliberated response.
Table 6
Analysis of variance table for MRR after backward elimination
Source
Model
A-Spindle speed
B-Feed rate
C-Depth of cut
AB
AC
BC
Residual
Lack of fit
Pure error
Cor Total
Sum of
Squares
7.19 x 10⁶
4.35 x 10⁶
1.93 x 10⁶
2.47 x 10⁵
5.57 x 10⁵
70989.12
31550.72
11358.26
11358.26
0
7.20 x 10⁶
df
6
1
1
1
1
1
1
13
8
5
19
Mean
Square
1.20 x 10⁶
4.35 x 10⁶
1.93 x 10⁶
2.47 x 10⁵
5.57 x 10⁵
70989.12
31550.72
873.71
1419.78
0
…
F Value
1370.81
4976.56
2211.81
282.12
637
81.25
36.11
….
….
….
…
p-value
Prob> F
< 0.0001
< 0.0001
< 0.0001
< 0.0001
< 0.0001
< 0.0001
< 0.0001
…
….
….
….
Contribution
%age
60.4056
26.8407
3.4245
7.7327
0.986
0.438
0.157
significant
significant
significant
significant
significant
significant
significant
321
R. Jindal and D. Choudhary / International Journal of Industrial Engineering Computations 6 (2015)
Table 6 reveals that model is significant and there is only a 0.01% incidental that an F-value of model
can be large due to noise. If the p- value probability > F is less than 0.05 then, it depicts model terms are
significant. In this case A (spindle speed), B (feed rate), C (depth of cut), AB, AC, BC are significant
model terms.
4.3.1 ANOVA for response surface linear model i.e. for Ra
Result of ANOVA for the Ra model is delineated in Table 7. It represents that model is significant and
there is only a 0.19% contingent that an F-value of model can be large due to noise. In this case A (spindle
speed) and B (feed rate) are significant model terms. The values > 0.100 manifests that the model terms
are not significant.
Table 7
Analysis of variance table for Ra
Source
Model
A-Spindle speed
B-Feed Rate
C-Depth of cut
Residual
Lack of fit
Pure error
Cor Total
Sum of
Squares
0.81
0.23
0.5
0.077
0.55
0.45
0.1
1.37
df
Mean Square
F Value
3
1
1
1
16
11
5
19
0.27
0.23
0.5
0.077
0.035
0.041
0.02
…
7.82
6.75
14.47
2.23
….
2.02
….
….
p-value
Prob> F
0.0019
0.0194
0.0016
0.1545
…
0.2255
….
….
significant
significant
significant
not significant
….
not significant
….
…
4.3.2 ANOVA for response surface reduced linear model i.e. for Ra
The ANOVA table for the reduced linear model for Ra is laid out in Table 1.8. The F-value of lack of fit
i.e. 2.17 implies that lack of fit is insignificant relative to the pure error. There is a 20.16 % incidental that
a lack of fit, F-value can be large due to noise.
Table 8
Analysis of variance table for Ra after backward elimination
Source
Model
A-Spindle speed
B-Feed rate
Residual
Lack of fit
Pure error
Cor Total
Sum of
Squares
0.74
0.23
0.5
0.63
0.53
0.1
1.37
df
2
1
1
17
12
5
19
Mean
p-value
F Value
Square
Prob> F
0.37
9.89
0.0014
0.23
6.3
0.0225
0.5
13.49
0.0019
0.037
….
….
0.044
2.17
0.2016
0.02
…
….
….
…
…
Contribution
%age
16.788
36.496
significant
significant
significant
….
not significant
….
….
Table 1.9 represents that the value of predicted R2 i.e. 0.9791 is in reasonable agreement with the value
of adjusted R2 i.e. 0.9977 for MRR since the difference is less than 0.2. The value of adequate precision
> 4 is desirable which manifests an adequate signal and summons that model can be employed to navigate
the design space.
Table 9
Various R2 statistics for MRR
Standard deviation
Mean
29.56
1099
2.69
1.50 x 10⁵
R2 (Coefficient of determination)
Adjusted R2
Predicted R2
Adequate Precision
0.9984
0.9977
0.9791
143.649
322
Table 10 illustrates that the value of predicted R2 is in reasonable agreement with the value of adjusted
R2 for the Ra.
Table 10
Various R2 statistics for Ra
Standard deviation
Mean
0.19
2.67
7.23
0.93
R2
Adjusted R2
Predicted R2
Adequate Precision
0.5379
0.4835
0.3229
10.096
4.4 Influence of cutting parameters on MRR & Ra
The influence of process parameters on output responses i.e. MRR and Ra are presented in Figures below.
4.4.1 Residuals vs. Run plot
The plots below illustrate a random pattern of residuals on both sides of 0.00 and do not expose any
recognizable patterns. Thus, it implies that there is nothing awesome about the residuals in Fig. 5 and
Fig. 6.
Design-Expert® Software
MRR
Residuals vs. Run
Color points by value of
Ra:
3.09
4.00
2.1
4.00
Externally Studentized Residuals
Externally Studentized Residuals
226.08
Design-Expert® Software
Ra
Residuals vs. Run
Color points by value of
MRR:
2813.44
2.00
0.00
-2.00
-4.00
2.00
0.00
-2.00
-4.00
1
4
7
10
13
16
19
1
4
Run Number
7
10
13
16
19
Run Number
Fig. 5. Residuals vs Run plot for MRR
Fig. 6. Residuals vs Run plot for Ra
4.4.2 Interaction plot
An interaction occurs when the response is disparate, anticipating on the settings of two factors. When
the lines are parallel, interaction influences are zero. The more distinctive the slopes, the more influence
the interaction repercussion on the results. The interaction plots for MRR vs spindle speed and feed rate
delineate that MRR increases with increase in spindle speed, however, the influence of spindle speed is
large when feed rate is at 0.35 mm/rev as shown in Fig. 7. Similarly, the influence of feed rate on MRR
is more, when depth of cut is 2 mm as demonstrate in Fig. 8. Thus, the maximum value of MRR is
achieved at the highest range of the input parameters in all the interaction plots.
Design-Expert® Software
Factor Coding: Actual
MRR (mm3/sec)
Design Points
95% CI Bands
Design-Expert® Software
Factor Coding: Actual
MRR (mm3/sec)
Design Points
95% CI Bands
Interaction
B: Feed Rate (mm/rev)
3000
X1 = A: Spindle Speed
X2 = B: Feed Rate
X1 = B: Feed Rate
X2 = C: Depth of Cut
2500
2500
2000
C- 1.5
C+ 2
1500
6
1000
MRR (mm3/sec)
Actual Factor
A: Spindle Speed = 1000
MRR (mm3/sec)
Actual Factor
C: Depth of Cut = 1.75
B- 0.15
B+ 0.35
Interaction
C: Depth of Cut (mm)
3000
2000
1500
6
1000
500
500
0
0
400
700
1000
1300
1600
A: Spindle Speed (R.P.M.)
Fig. 7. Interaction plot for MRR vs Spindle
speed and feed rate
0.15
0.2
0.25
0.3
0.35
B: Feed Rate (mm/rev)
Fig. 8. Interaction plot for MRR vs Feed rate and
depth of cut
323
R. Jindal and D. Choudhary / International Journal of Industrial Engineering Computations 6 (2015)
Fig. 9 reveals interaction plot for surface roughness vs feed rate and spindle speed. This plot represents
that Ra is minimum when spindle speed is at 1600 r.p.m.
Design-Expert® Software
Factor Coding: Actual
Ra (µm)
Design Points
95% CI Bands
Interaction
A: Spindle Speed (R.P.M.)
3.4
X1 = B: Feed Rate
X2 = A: Spindle Speed
3.2
Actual Factor
C: Depth of Cut = 1.75
3
Ra (µm)
A- 400
A+ 1600
2
2.8
2.6
2
2.4
2.2
2
0.15
0.2
0.25
0.3
0.35
B: Feed Rate (mm/rev)
Fig. 9. Interaction plot for Ra vs Feed rate and spindle speed
4.4.3
3-D surface plots
It is contemplated that increase in spindle speed and feed rate lean to increase the MRR as exhibit in Fig.
10. It is noted from Fig. 11 that the increase in depth of cut causes the MRR marginally increase. Thus,
increasing the feed rate, spindle speed & depth of cut expedite an increase in the extent of material
removal rate.
Design-Expert® Software
Factor Coding: Actual
MRR (mm3/sec)
2813.44
Design-Expert® Software
Factor Coding: Actual
MRR (mm3/sec)
2813.44
226.08
226.08
X1 = A: Spindle Speed
X2 = B: Feed Rate
Actual Factor
C: Depth of Cut = 1.75
3000
X1 = A: Spindle Speed
X2 = C: Depth of Cut
2500
Actual Factor
B: Feed Rate = 0.25
3000
2500
2000
MRR (mm3/sec)
MRR (mm3/sec)
2000
1500
1000
500
0
1500
1000
500
0
1600
0.35
1300
0.3
1000
0.25
B: Feed Rate (mm/rev)
700
0.2
0.15
A: Spindle Speed (R.P.M.)
400
1600
2
1.9
1300
1.8
1000
1.7
C: Depth of Cut (mm)
700
1.6
1.5
Fig. 10. Influence of Feed rate & Spindle speed
on MRR
A: Spindle Speed (R.P.M.)
400
Fig. 11. Influence of Depth of cut & Spindle
speed on MRR
The consequence of process parameters on output response, surface roughness is shown in Fig. 12. From
this Fig, it is ascertained that as the feed rate increases, Ra also increases but as the spindle speed increases
then surface roughness decreases.
324
Design-Expert® Software
Factor Coding: Actual
Ra (µm)
Design points above predicted value
Design points below predicted value
3.09
2.1
3.4
X1 = B: Feed Rate
X2 = A: Spindle Speed
3.2
3
Actual Factor
C: Depth of Cut = 1.75
Ra (µm)
2.8
2.6
2.4
2.2
2
0.35
1600
0.3
1300
0.25
1000
A: Spindle Speed (R.P.M.)
0.2
700
400
B: Feed Rate (mm/rev)
0.15
Fig. 12. Influence of Spindle speed & Feed rate on Ra
5. Optimization of the problem
Desirability is quietly a mathematical method to access the optimum. By default, the input factors are set
“in range”, thus preventing extrapolation as laid out in Table 11.
Table 11
Constraints for combined MRR and Ra
Name
Goal
Lower Limit
Upper Limit
Lower
Weight
Upper
Weight
Importance
A: Spindle speed
B: Feed rate
C: Depth of cut
MRR
Ra
is in range
is in range
is in range
maximize
minimize
400
0.15
1.5
226.08
2.1
1600
0.35
2
2813.44
3.09
1
1
1
1
1
1
1
1
1
1
3
3
3
3
3
Three solutions are attained. They are presented in Table 12. Solution 1, which is having maximum value
of desirability i.e. 0.634, is tabbed. The optimum values of spindle speed, feed rate and depth of cut to
maximize the MRR (2097.3 mm3/sec) & minimize the Ra (2.54 µm) are 1599.568 r.p.m., 0.262 mm/rev
and 2 mm respectively.
Table 12
Optimization solutions for combined MRR and Ra
Number
1
2
3
Spindle speed
1599.568
1600
1600
Feed rate
0.262
0.272
0.222
Depth of Cut
2
2
2
MRR
2097.3
2176.9
1796.2
Ra
2.54
2.563
2.452
Desirability
0.634
0.633
0.625
Selected
…..
…..
5.1 Numerical optimization Ramps
Ramps view reveals the desirability for each factor and each response. The ramp function graph for
overall desirability for MRR and Ra is illustrated in Fig. 13. In this figure, red mark on curves of spindle
speed, feed rate and depth of cut are delineating the optimum values. The corresponding optimum value
325
R. Jindal and D. Choudhary / International Journal of Industrial Engineering Computations 6 (2015)
of response i.e. MRR and Ra is also exposed by blue dot on curves of these responses. Fig. 13 also depicts
the individual desirability value of these multi-objective characteristics.
Design-Expert® Software
Factor Coding: Actual
Desirability
Design Points
1.000
1
6
0
0
A
:S
p
in
d
leS
p
e
e
d=1
5
9
9
.5
7
0
.1
5
0
.3
5
0.000
X1 = A: Spindle Speed
X2 = B: Feed Rate
B
:F
e
e
dR
a
te=0
.2
6
1
5
2
3
Actual Factor
C: Depth of Cut = 2
1
.5
2
C
:D
e
p
tho
fC
u
t=2
2
2
6
.0
8
2
8
1
3
.4
4
M
R
R=2
0
9
7
.3
2
0.3
B: Feed Rate (mm/rev)
4
0
0
Desirability
0.35
Prediction
0.634
0.6
0.2
0.3
0.25
0.4
0.5
0.2
D
e
sira
b
ility=0
.6
3
4
0.15
2
.1
3
.0
9
400
R
a=2
.5
4
0
4
2
Fig. 13. Ramp function plot for combined for
MRR & Ra
700
1000
1300
1600
A: Spindle Speed (R.P.M.)
Fig. 14. Contour plot at maximum desirability
value for combined MRR & Ra
5.2 Contour plot at maximum desirability value of responses
Contour graph (Fig. 14) at maximum desirability value (0.634) presents optimum values of spindle speed
and feed rate. This plot manifests that increase in spindle speed and feed rate result in increase in
desirability value of MRR & Ra.
6. Conclusion
It can be winded up from above analysis that response surface method can be successfully employed to
induce optimal values of cutting parameters for multi-objective problem. Surface roughness & MRR
parameters greatly rely on work piece material. Material removal rate increases with the increase in feed
rate, spindle speed & depth of cut. The ramification of the depth of cut on the surface roughness is
negligible. Surface roughness parameter decreases with increase in spindle speed but increases with
increase in feed rate. The values of cutting parameters: spindle speed of 1599.568 rpm, feed rate of 0.262
mm/rev and depth of cut of 2 mm are foreseen to counter with a minimum surface roughness and
maximum MRR.
Acknowledgement
We would like to acknowledge Research & Development Centre for Bicycle & Sewing Machine,
Ludhiana, India for providing CNC machining facility and the surface roughness tester to carry out this
experimental work.
References
Aggarwal, A., Singh, H., Kumar, P., & Singh, M. (2008). Optimizing power consumption for CNC turned
parts using response surface methodology and Taguchi's technique—a comparative analysis. Journal
of Materials Processing Technology, 200(1), 373-384.
Ahmed, G. S., Ahmed, H., & Samad, S. S. (2013). Experimental investigation of effect of tool length on
surface roughness during turning operation and its optimization. IOSR Journal of Mechanical and
Civil Engineering, 7(2), 73-80.
Asiltürk, I., & Akkuş, H. (2011). Determining the effect of cutting parameters on surface roughness in
hard turning using the Taguchi method. Measurement, 44(9), 1697-1704.
Barik, C. R., & Mandel, N. K. (2010). Parametric effect and optimization of surface roughness of EN 31
in CNC dry turning. International Journal of Lean Thinking, 3(2), 1-13.
326
Gaitonde, V. N., Karnik, S. R., & Davim, J. P. (2008). Selection of optimal MQL and cutting conditions
for enhancing machinability in turning of brass. Journal of Materials Processing Technology, 204(1),
459-464.
Jiang, L., Roos, Å., & Liu, P. (1997). The influence of austenite grain size and its distribution on chip
deformation and tool life during machining of AISI 304L.Metallurgical and Materials Transactions
A, 28(11), 2415-2422.
Kaladhar, M., Subbaiah, K. V., Rao, C. S., & Rao, K. N. (2010). Optimization of process parameters in
turning of AISI202 austenitic stainless steel. ARPN Journal of Engineering and Applied
Sciences, 5(9), 79-87.
Khamel, S., Ouelaa, N., & Bouacha, K. (2012). Analysis and prediction of tool wear, surface roughness
and cutting forces in hard turning with CBN tool. Journal of mechanical science and
technology, 26(11), 3605-3616.
Kumar, N. S., Shetty, A., Shetty, A., Ananth, K., & Shetty, H. (2012). Effect of spindle speed and feed
rate on surface roughness of Carbon Steels in CNC turning. Procedia Engineering, 38, 691-697.
Kumbhar, Y. B., & Waghmare, C. A. (2013). Tool Life And Surface Roughness Optimization Of PVD
TiAlN/TiN Multilayer Coated Carbide Inserts In Semi Hard Turning Of Hardened EN31 Alloy Steel
Under Dry Cutting Conditions. International Journal of Advanced Engineering Resources Studies,
2(4), 22-27.
Mahdavinejad, R. A., & Saeedy, S. (2011). Investigation of the influential parameters of machining of
AISI 304 stainless steel. Sadhana, 36(6), 963-970.
Noordin, M. Y., Venkatesh, V. C., Sharif, S., Elting, S., & Abdullah, A. (2004). Application of response
surface methodology in describing the performance of coated carbide tools when turning AISI 1045
steel. Journal of Materials Processing Technology, 145(1), 46-58.
Rodríguez, J., Muñoz-Escalona, P., & Cassier, Z. (2011). Influence of cutting parameters and material
properties on cutting temperature when turning stainless steel. Revista de la Facultad de Ingeniería
Universidad Central de Venezuela, 26(1), 71-80.
Sivaraman, V., Sankaran, S., & Vijayaraghavan, L. (2012a). The Effect of Cutting Parameters on Cutting
Force During Turning Multiphase Microalloyed Steel. Procedia CIRP, 4, 157-160.
Sivaraman, V., Sankaran, S., & Vijayaraghavan, L. (2012b). Machinability of multiphase microalloyed
steel. Procedia CIRP, 2, 55-59.