Principal component and cluster analysis in inbred lines of maize (Zea mays L.)
Bạn đang xem bản rút gọn của tài liệu. Xem và tải ngay bản đầy đủ của tài liệu tại đây (540.15 KB, 9 trang )
Int.J.Curr.Microbiol.App.Sci (2018) 7(6): 3221-3229
International Journal of Current Microbiology and Applied Sciences
ISSN: 2319-7706 Volume 7 Number 06 (2018)
Journal homepage:
Original Research Article
/>
Principal Component and Cluster Analysis in
Inbred Lines of Maize (Zea mays L.)
K. Mounika1*, M. Lal Ahamed2 and Sk. Nafeez Umar3
1
Department of Genetics and Plant Breeding, Agricultural College, Bapatla, Acharya N G
Ranga Agricultural University, Guntur, Andhra Pradesh, India
2
Department of Molecular Biology and Biotechnology, APGC, Lam, Guntur, A.P. India
3
Department of Statistics and Computer Applications, Agricultural College, Bapatla, Acharya
N G Ranga Agricultural University, Guntur, Andhra Pradesh, India
*Corresponding author
ABSTRACT
Keywords
Genetic divergence,
Hierarchical cluster
analysis, Maize, Principal
Component Analysis
Article Info
Accepted:
22 May 2018
Available Online:
10 June 2018
In the present investigation a total of forty seven maize inbred lines were studied to assess
the genetic diversity for 10 quantitative traits viz., days to 50% tasseling, days to 50%
silking, days to maturity, plant height (cm), ear length (cm), ear height (cm), 100-seed
weight (g), kernel rows per ear, number of kernels per row and grain yield per plant (g)
using principal component analysis and hierarchical cluster analysis. The PCA identified
four principal components (PCs) with Eigen value greater than 1.00 and accounted for
80.35 per cent of total variation. Cluster analysis based on Ward’s minimum variance
procedure distributed the inbreds into 7 clusters indicating their broad genetic base of
which cluster II was the largest containing ten inbreds and maximum inter-cluster distance
was recorded between clusters IV and VII (1177.88) suggesting their use in breeding
programmes for the exploitation of heterosis for the desirable yield traits.
Introduction
varied climatic situations throughout the year
suggesting its wider adaptability.
Maize (Zea mays L.) is an important cereal
crop of the family Poaceae belonging to the
tribe Maydeae. The plant is native to South
America and has chromosome number of
2n=20. Maize (Zea mays L.) is known as
golden crop because every part of this crop is
useful to man, animals and the industries.
Globally, it is the most important cereal food
crop after wheat and rice accounting for 9 per
cent of the total food grain production. It has
occupied a prominent place in Indian
agriculture as it is widely grown in India in
The major objective of the maize breeding
programmes is to develop high yielding
hybrids than the existing cultivars as hybrids
are popular among the farming community for
their yield advantage over the varieties and
others. To develop high yielding hybrids in
maize, the development and evaluation of
inbreds form the major thrust area of the plant
breeding programmes. Hence, inbred lines
developed through sib mating etc. need to be
evaluated for their genetic diversity and
3221
Int.J.Curr.Microbiol.App.Sci (2018) 7(6): 3221-3229
performance to plan an effective hybrid
breeding programme as genetically diverse
parents are known to produce high heterotic
effects.
Evaluation, characterization and classification
of genotypes based on estimates of genetic
diversity will help to identify diverse parental
lines which can be used in hybrid breeding to
develop potential hybrids or varieties. Several
methods have been reported to decipher the
pattern and magnitude of variability such as
Mahalanobis D2 analysis, Principal component
analysis and hierarchical cluster analysis
based on Ward’s minimum variance method.
PCA and cluster analysis is better utilized for
studying the diversity among the genotypes in
various crops, In view of the above, 47 inbred
lines were investigated to study the nature and
magnitude of genetic divergence for grain
yield and its component characters to provide
a basis for selection of parents in hybridization
programme
in
Maize
hybridization
programme.
Materials and Methods
plant. The data on remaining quantitative
characters viz., days to 50% tasseling, days to
50% silking and days to maturity were
recorded on plot basis. The mean values of the
data were used for statistical analysis.
Statistical analysis
The data was analyzed for Principal
component analysis (PCA) for dimensional
reduction and to know the importance of
different traits in explaining multivariate
polymorphism. Hierarchical cluster analysis
was done following the minimum variance
method of Ward (1963) based on squared
Euclidean distances.
Results and Discussion
The analysis of variance for 47 inbred lines of
Maize for ten quantitative traits showed
significant differences between the inbred
lines for the characters studied indicating a
considerable amount of genetic variability in
the studied material and the utility of
divergence analysis in the present material for
identification of divergent groups.
Experimental material
The present investigation was carried out
during rabi, 2016-17 at Agricultural college
farm, Bapatla, Guntur district using 47 maize
inbred lines obtained from IARI Regional
Maize Research Center, Dharwad, Karnataka
in a Randomized Block Design with three
replications. Each entry was sown in two rows
of 3m length maintaining a spacing of
60cmx30cm.
Standard
agronomic
management
practices
were
followed
throughout the growing period to maintain
proper plant stand and good crop growth. The
observations were recorded on ten randomly
selected plants for seven quantitative
characters viz., plant height, ear length, ear
height, 100-seed weight, kernel rows per ear,
number of kernels per row and grain yield per
In principal component (PC) analysis, the
number of variables was reduced to linear
functions called canonical vectors which
accounted for most of the variation produced
by the characters under study. The eigen
values, per cent variance, per cent cumulative
variance and factor loading of different
characters studied are presented in Table 1. In
this experiment, first four principal
components (PC) based on 10 quantitative
traits showed eigen values greater than 1. The
contribution of these four PCs was 80.35% in
the overall variability among the genotypes.
The contribution of PC1 was found to be
28.95% in the total divergence of the studied
population, in which the major contributing
traits were days to 50% tasseling, days to 50%
silking, days to maturity, ear height, plant
3222
Int.J.Curr.Microbiol.App.Sci (2018) 7(6): 3221-3229
height, 100-seed weight, ear length, grain
yield per plant and number of kernels per row.
The second principal component (PC2) was
responsible for about 25.16% of the variation
and was mainly contributed by days to
maturity, days to 50% silking and days to 50%
tasseling. The third principal component
(PC3) explained 13.96% of variation and was
associated mainly with grain yield per plant,
kernel rows per ear, days to 50% tasseling,
days to 50% silking and days to maturity. The
fourth principal component (PC4) explained
12.28% variation and was contributed by
number of kernels per row, grain yield per
plant, kernel rows per ear, days to maturity,
days to 50% tasseling and days to 50%
silking.
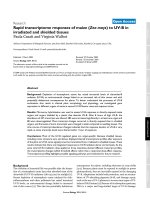
Cluster analysis based on PCA scores were
compared with the results of the principal
component analysis on a visual aid in
desecrating clusters in the two dimensional
scattered diagram and the genotypes falling in
same cluster were present closer to each other
in the scattered diagram.
Two dimensional scatter diagram was shown
in Figures 1, and the genotypes numbered 41
and 36 i.e., CDM-306 and CDM-320 scattered
away from other genotypes.
These results were in accordance with those of
Jinju et al., (2009), Muhammad et al., (2012),
Sandeep et al., (2015), Avinash and Mishra
(2016) and Shrestha (2016) in maize.
Fig.1 Two dimensional graph showing relative position of 47 maize (Zea mays L.) genotypes
based on PCA scores
3223
Int.J.Curr.Microbiol.App.Sci (2018) 7(6): 3221-3229
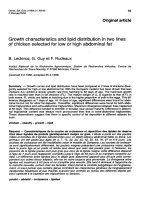
Fig.2 Dendrogram showing relationship of 47 maize (Zea mays L.) inbreds in seven clusters
based on Euclidean2 distance
3224
Int.J.Curr.Microbiol.App.Sci (2018) 7(6): 3221-3229
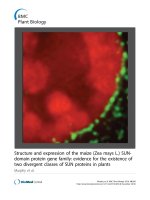
Fig.3 Intra and inter-cluster distance of 47 maize (Zea mays L.) inbreds in seven clusters based
on Euclidean2 values
Table.1 Eigen values, proportion of the total variance represented by first four Principal
components, cumulative per cent variance and component loading of different characters in
maize (Zea mays L.)
Eigen Value (Root)
% Var. Exp.
Cum. Var. Exp.
Days to 50% tasseling
Days to 50% silking
Days to maturity
Plant height
Ear length
Ear height
100-seed weight
Kernel rows per ear
Number of kernels per row
Grain yield per plant
PC = Principal component
PCA1
2.89
28.95
28.95
0.55
0.55
0.52
0.21
0.07
0.22
0.08
-0.10
0.04
0.07
3225
PCA2
2.52
25.16
54.10
0.11
0.13
0.16
-0.40
-0.17
-0.43
-0.19
-0.44
-0.28
-0.51
PCA3
1.40
13.96
68.07
0.04
0.03
0.13
-0.29
-0.13
-0.37
-0.71
0.21
-0.27
0.36
PCA4
1.23
12.28
80.35
0.09
0.07
0.13
-0.37
-0.27
-0.27
-0.30
0.16
0.70
0.28
Int.J.Curr.Microbiol.App.Sci (2018) 7(6): 3221-3229
Table.2 Clustering pattern of 47 maize (Zea mays L.) inbreds by
Ward’s minimum variance method
Cluster No
I
No. of inbreds
9
II
10
III
7
IV
9
V
9
VI
VII
2
1
Names of inbreds
PDM-4441, PDM-40-1, CDM-110, PDM-24-6A, PDM-3R,
CDM-105, PDM-24-1, CDM-106, PDM-24-3R
PDM-24-3K, PDM-260-1A, PDM-4131R-1, C-2746-1,
PDM-260-2-1, PDM-6508, PDM-194-2, CDM-313, PDM258-1, PDM-203-1(PS-35-1)
PDM-4131K, HK1-163-1, PDM-113-2, PDM-71-2, CDM327, PDM-256-4, PDM-256-1R
PDM-4611, CM-1388, PDM-4591, PDM-6571, CDM-115,
PDM-84, CDM-116, CDM-107, CM-138A-2
PDM-4351, C-2730-1, PDM-4241, CDM-311, CDM-119,
PDM-4251K, C-2703-1, PDM-96-1, CDM-309
CDM-320, CDM-342
CDM-306
Table.3 Average intra and inter-cluster Euclidean2 values among seven clusters in 47 maize (Zea
mays L.) inbreds
Cluster No.
I
II
III
IV
V
VI
VII
I
46.19
II
71.45
40.64
III
92.98
87.31
51.08
IV
96.43
141.62
101.57
56.20
V
134.75
88.34
154.78
174.28
174.28
VI
364.91
355.49
421.09
293.51
293.85
234.70
VII
897.70
716.38
1042.03
1177.88
575.70
907.62
0.00
Note: Diagonal values are intra-cluster distances. Off-diagonal values are inter-cluster distances
Table.4 The nearest and the farthest cluster from each cluster using Ward’s Minimum Variance
method in 47 inbreds of maize (Zea mays L.)
Cluster No.
I
II
III
IV
V
VI
VII
Nearest cluster with D2 values
II (71.45)
I (71.45)
II (87.31)
I (96.43)
II (88.34)
IV (293.51)
V (575.70)
3226
Farthest cluster with D2 values
VII (897.70)
VII (716.38)
VII (1042.03)
VII (1177.88)
VII (575.70)
VII (907.62)
IV (1177.88)
Int.J.Curr.Microbiol.App.Sci (2018) 7(6): 3221-3229
Table.5 Mean values of seven clusters estimated by Ward’s minimum variance method from 47 maize (Zea mays L.) inbreds
Cluster
No.
Days
Days
to 50% to 50%
tasseling silking
Days
to Plant height
maturity
(cm)
Ear
length
(cm)
Ear
height
(cm)
100
- Kernel
seed
rows
weight
per ear
(g)
No.
of Grain
kernels
yield per
per row
plant
(g)
I
53.63
59.96
90.96
141.75
17.71
50.01
18.32
12.74
19.71
58.28
II
56.87
63.50
99.47
140.27
20.80
47.65
20.58
13.45
21.46
71.57
III
58.14
64.67
100.43
168.55
20.20
61.09
18.36
13.18
17.66
50.20
IV
55.15
61.33
94.33
156.56
20.02
59.13
14.17
13.42
22.76
56.21
V
57.00
63.63
97.49
173.99
21.22
64.31
20.85
14.69
25.82
94.93
VI
55.17
61.33
94.50
184.37
21.38
74.63
16.30
14.27
45.21
103.61
VII
56.33
61.33
96.00
182.27
17.13
66.40
34.78
17.87
27.27
170.96
Note: Bold figures indicate minimum and maximum values in each character
3227
Int.J.Curr.Microbiol.App.Sci (2018) 7(6): 3221-3229
The principal component scores of genotypes
were used as input for cluster analysis using
Euclidean2 distances in order to group the
genotypes into various clusters and to confirm
the results of principal component analysis.
Forty seven genotypes were grouped into
seven clusters using the Ward’s minimum
variance procedure (Anderberg, 1993) and the
distributions of the genotypes into different
clusters are depicted in Table 2 and Figure 3.
Among all the clusters, cluster II was the
largest containing ten genotypes followed by
clusters I, IV, and V containing nine
genotypes in each cluster, cluster III with
seven genotypes, cluster VI with two
genotypes and cluster VII was monogenotypic
having only one genotype. The mutual
relationship between clusters is represented
diagrammatically in Figure 4 by taking
average intra and inter-cluster Euclidean2
distances. The average intra and inter-cluster
Euclidean2 distance were estimated based on
Ward’s minimum variance and are presented
in the Table 3. Similar results of clustering
were reported by Mehrnaz et al., (2014),
Hafiz et al., (2015), Muhammad et al., (2015)
and Sandeep et al., (2015).
The nearest and farthest cluster for each of the
seven clusters are presented in Table 4. The
cluster VII was solitary with intra-cluster
distance zero. Cluster II had minimum intracluster Euclidean2 distance value of 40.64
followed by cluster I (46.19), cluster III
(51.08), cluster IV (56.20), cluster V (174.28)
and maximum was recorded in the cluster VI
(234.70). The maximum inter-cluster distance
was observed between clusters IV and VII
(1177.88) followed by clusters III and VII
(1042.03) and clusters VI and VII (907.62)
suggesting wide genetic diversity between
these clusters and can be exploited for traits
improvement in the breeding programmes.
Cluster means were computed for the 10
characters studied by Ward’s minimum
variance method and are presented in Table 5.
Out of all the clusters, cluster VI showed
higher mean values for most of the yield
contributing traits like plant height, ear
length, ear height and number of kernels per
row indicating the importance of this cluster
genotypes in maize yield improvement
programmes.
Based on inter-cluster distances and per se
performance of the genotypes included in the
farthest clusters, genotypes viz., CDM-306,
CDM-320, CDM-342 AND CM-138A-2 are
showing maximum inter cluster distance and
good per se performance. Hence, they can be
included in crossing programmes for
generating heterotic hybrids for various yield
traits in maize.
Acknowledgements
The authors are highly grateful to the Dr.
Jayanth S. Bhat, IARI Regional Research
Station, Dharwad for providing the material
and the first author acknowledge the receipt
of financial help in the form stipend from
Acharya N G Ranga Agricultural University,
Guntur, Andhra Pradesh during the Degree
programme.
References
Anderberg, M.R. 1993. Cluster Analysis for
Application. Academic Press, New
York.
Avinash, J and Mishra, D.K. 2016. Genetic
studies of elite landraces of maize based
on divergence for yield and its
components. Environment and Ecology.
34(3): 858-862.
Hafiz, S.B.M., Jehanzeb, F., Ejaz-ul-Hasan.,
Tahira, B and Mahmood, T. 2015.
Cluster and principle component
analyses of maize accessions under
normal and water stress conditions.
3228
Int.J.Curr.Microbiol.App.Sci (2018) 7(6): 3221-3229
Journal of Agricultural Sciences. 60 (1):
33-48.
Jinju, H., Xiang, Z.C., Rouyi, C., Fabo, C and
Fahui, C. 2009. Analysis on principal
components
of
maize
cross
combinations in Guizhou. Guizhou
Agricultural Sciences. 8: 4-6.
Mehrnaz, T., Elham, B., Ali, R, A and Ali,
R.A.K. 2014. Genetic diversity of 13
maize (Zea mays L.) hybrids based on
multivariate
analysis
methods.
International Journal of Farming and
Allied Sciences. 3 (5): 467-470.
Muhammad, R.W., Qayyum, A., Hamza,
A., Ahmad, M.Q., Naseer, N.S., Liaqat,
S., Ahmad, B., Malik, W and Noor, E.
2015. Analysis of genetic traits for
drought tolerance in maize. Genetics
and Molecular Research. 28: 14(4):
13545-65.
Muhammad, R.W., Rukhsana, A., Shoib, L.,
Abdul, Q., Waqas, M., Naveed,
M., Mumtaz, H., Jahangir, S., Khan, S.
M., Bashir, A., Rao, S. A and Etrat, N.
2012. Numerical evaluation of local and
exotic maize genotypes in arid
conditions. Journal of Food Agriculture
and Environment. 10 (1): 624-630.
Sandeep, S., Bharathi, M., Narsimha, R.V and
Eshwari,
K.B.
2015.
Principal
component analysis in inbreds of Maize
(Zea mays L.). International Journal of
Tropical Agriculture. 33(2): 213-216.
Shrestha, J. 2016. Cluster Analysis of Maize
inbred lines. Journal of Nepal
Agricultural Research Council. 2: 3336.
How to cite this article:
Mounika K., M. Lal Ahamed and Nafeez Umar Sk. 2018. Principal Component and Cluster
Analysis in Inbred Lines of Maize (Zea mays L.). Int.J.Curr.Microbiol.App.Sci. 7(06): 32213229. doi: />
3229