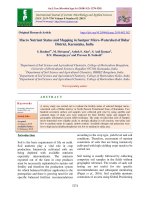
Influence of different sources of nutrient modules on soil characteristics, plant nutrient contents and economics in banana cv. Grand Naine
Bạn đang xem bản rút gọn của tài liệu. Xem và tải ngay bản đầy đủ của tài liệu tại đây (223.96 KB, 9 trang )
Int.J.Curr.Microbiol.App.Sci (2018) 7(1): 1995-2003
International Journal of Current Microbiology and Applied Sciences
ISSN: 2319-7706 Volume 7 Number 01 (2018)
Journal homepage:
Original Research Article
/>
Influence of Different Sources of Nutrient Modules on Soil Characteristics,
Plant Nutrient Contents and Economics in Banana cv. Grand Naine
T. Ganapathi* and P.R. Dharmatti
Department of Horticulture, University of Agricultural Sciences, Dharwad-580 005,
Karnataka, India
*Corresponding author
ABSTRACT
Keywords
Banana, INM,
Nutrient module,
Soil properties and
NPK content in
plant
Article Info
Accepted:
14 December 2017
Available Online:
10 January 2018
A study was conducted in new orchard, Department of Horticulture, Main Agricultural
Research Station (MARS), College of Agriculture, University of Agricultural Sciences,
Dharwad, Karnataka during 2014-15 and 2015-16 on “Integrated nutrient management
studies in banana cv. Grand Naine (AAA)” to unravel the beneficial effects of application
of organic manures and chemical fertilizers with green manure, Azospirillum and PSB. At
the start of experiment, the organic carbon and available NPK were medium. After the
completion of the experiment the results indicated that, the organic carbon was found to be
enhanced in organic treatments (T 1 to T5) from 0.65 % to 0.72 %, whereas it decreased
from 0.65 % to 0.57 % in integrated treatments (T 6 to T12). The available N and available
potash in soil was significantly higher in organic treatments than integrated treatments.
The available phosphorous was decreased in organic treatments compared to integrated
treatments. Plants applied with T 7 {Vermicompost equivalent to 40 % RDN (24.20 t/ha) +
Urea equivalent to 40 % RDN (535.73 kg/ ha) + Green manure (sunnhemp @ 8.88 t/ha)
and Azospirillum (30.86 kg/ha) equivalent to 20 % RDN + PSB (30.86 kg/ha)} recorded
the highest NPK concentration in banana leaf, fruit and pseudostem at harvest (3.25%,
0.32% and 2.87 % in leaf, 3.27%, 0.32% and 3.15% in fruit and 3.43%, 0.34% and 3.02%
in pseudo stem respectively). The highest and gross returns (Rs.4.97 lakh/ha) and moderate
net returns (Rs.3.04 lakh/ha) was also recorded in T 7 treatment
Introduction
Banana is one of the important fruit crops
known to mankind since ancient times.
In India, bananas are cultivated in an area of
0.83 million ha with a production of 30
million tonnes and its productivity is 35.9 t/ha
(Anon, 2011). The major banana growing
areas include Tamil Nadu, Maharashtra,
Andhra Pradesh, Gujarat, Kerala, Karnataka,
West Bengal and Orissa. It is being grown in
an area of 1.12 lakh ha with a production of
2.28 lakh tonnes and with a productivity of
20.40 Mt/ha in Karnataka state.
Banana is a heavy feeder of nutrients and
requires large quantity of nutrients for its
growth, yield and biomass production
(Sridhara, 2009). The use of chemical
1995
Int.J.Curr.Microbiol.App.Sci (2018) 7(1): 1995-2003
fertilizers alone to feed the requirement not
only become costly but also have deleterious
effect on soil physical, chemical and
biological properties and productivity in the
long run. The availability of organic manures
is one of the limitations for successful banana
production. Achieving the entire nutrient
requirement only through organic or inorganic
or bio- fertilizers alone is seldom possible but
integration of all these sources with different
manures will not only aid in achieving higher
yields but also in sustaining the same through
enhanced soil fertility status.
Materials and Methods
The field experiments with an integrated
nutrient management module consisting of
organic manures, chemical fertilizers and biofertilizers on soil properties, plant nutrient
contents and economics of banana cv. Grand
Naine was conducted during 2014-15 and
2015-16 at new orchard, Department of
Horticulture, University of Agricultural
Sciences, Dharwad. The soil type is red clay.
At the start of experiment, the soil organic
carbon (0.65 %) and available NPK status
were medium (285, 28.75 and 156.25 kg/ha).
The soil pH was neutral (7.38) and EC was
non saline (0.25 dS/m).
The experiment consisted of 12 treatments viz.
Plant crop
T1- FYM equivalent to 40% RDN (48.40 t/ha)
+ VC equivalent to 40% RDN (24.20 t/ha) +
GM (Sunnhemp @ 8.88 t/ha) and Azospirillum
(30.86 kg/ha) equivalent to 20% RDN + PSB
(30.86 kg/ha).
T2 –FYM equivalent to 40% RDN (48.40 t/ha)
+ PM equivalent to 40% RDN (8.96 t/ha) +
GM (Sunnhemp @ 8.88 t/ha) and Azospirillum
(30.86 kg/ha) equivalent to 20% RDN + PSB
(30.86 kg/ha).
T3- FYM equivalent to 40% RDN (48.40 t/ha)
+ SM equivalent to 40% RDN (10.17 t/ha) +
GM (Sunnhemp @ 8.88 t/ha) and Azospirillum
(30.86 kg/ha) equivalent to 20% RDN + PSB
(30.86 kg/ha).
T4- FYM equivalent to 40% RDN (48.40 t/ha)
+ AG equivalent to 40% RDN (10.52 t/ha) +
GM (Sunnhemp @ 8.88 t/ha) and Azospirillum
(30.86 kg/ha) equivalent to 20% RDN + PSB
(30.86 kg/ha).
T5- FYM equivalent to 40% RDN (48.40 t/ha)
+ BL equivalent to 40% RDN (7.56 t/ha) +
GM (Sunnhemp @ 8.88 t/ha) and Azospirillum
(30.86 kg/ha) equivalent to 20% RDN + PSB
(30.86 kg/ha).
T6- FYM equivalent to 40% RDN (48.40 t/ha)
+ 40% RDN through chemical fertilizer (Urea
535.73 kg/ ha) + GM (Sunnhemp @ 8.88 t/ha)
and Azospirillum (30.86 kg/ha) equivalent to
20% RDN + PSB (30.86 kg/ha).
T7- VC equivalent to 40% RDN (24.20 t/ha) +
Chemical fertilizer (Urea 535.73 kg/ ha)
equivalent to 40% RDN + GM (Sunnhemp @
8.88 t/ha) and Azospirillum (30.86 kg/ha)
equivalent to 20% RDN + PSB (30.86 kg/ha).
T8- PM equivalent to 40% RDN (8.96 t/ha) +
Chemical fertilizer (Urea 535.73 kg/ ha)
equivalent to 40% RDN + GM (Sunnhemp @
8.88 t/ha) and Azospirillum (30.86 kg/ha)
equivalent to 20% RDN + PSB (30.86 kg/ha).
T9- SM equivalent to 40% RDN (10.17 t/ha) +
Chemical fertilizer (Urea 535.73 kg/ ha)
equivalent to 40% RDN + GM (Sunnhemp @
8.88 t/ha) and Azospirillum (30.86 kg/ha)
equivalent to 20% RDN + PSB (30.86 kg/ha).
T10- AG equivalent to 40% RDN (10.52 t/ha)
+ Chemical fertilizer (Urea 535.73 kg/ ha)
equivalent to 40% RDN + GM (Sunnhemp @
8.88 t/ha) and Azospirillum (30.86 kg/ha)
1996
Int.J.Curr.Microbiol.App.Sci (2018) 7(1): 1995-2003
equivalent to 20% RDN + PSB (30.86 kg/ha)
T11- BL equivalent to 40% RDN (7.56 t/ha) +
Chemical fertilizer (Urea 535.73 kg/ ha)
equivalent to 40% RDN + GM (Sunnhemp @
8.88 t/ha) and Azospirillum (30.86 kg/ha)
equivalent to 20% RDN + PSB (30.86 kg/ha)
T12 -Control (RDF 200: 100: 300 g NPK /plant
or 617.20:308.60: 925.80 kg NPK/ha + Farm
yard manure @ 40 t/ha)
The recommended dose of phosphorous and
potash (100 g/plant and 300 g/plant
respectively) was supplied through DAP and
MOP.
Ratoon crop
RDF = 100:50:100 NPK g /plant or
308.60:154.20: 308.60 kg NPK/ha) + FYM @
20 t/ha
The recommended dose of phosphorous and
potash (50 g / plant and 100 g / plant
respectively) was supplied through DAP and
MOP.
The organic manures, chemical fertilizers with
bio-fertilizers and green manure to
compensate the majority of the plant nutrition
thereby to increase the productivity of banana
cv. Grand Naine.
The influence was assessed on soil properties,
nutrient content of plants and economics of
banana.
The results of the field experiments conducted
during the year 2014-15 and 2015-16 are
pooled and discussed.
Results and Discussion
The results of the field experiments conducted
during the year 2014-15 and 2015-16 and
pooled are presented and discussed.
Effect of different sources of nutrient
modules on soil properties in banana (Table
1)
At the start of experiment, the soil organic
carbon and available NPK status were
medium. The soil pH was neutral and EC was
non saline. After the harvest of plant crop the
soil registered decline in soil pH, EC, organic
carbon and available nitrogen with integrated
nutrient module treatments as compared to
organic nutrient modules, where it was found
to increase for these parameters except in T6.
The available nitrogen was also increased in
organic treatments as compared to integrated
treatments including T12 where it was fond to
decline in all the parameters except
phosphorous.
Similarly
the
available
phosphorous was found to increase in all the
treatments compared to initial status. The
available potash was found to decrease in all
the treatments as compared to initial status.
After the harvest of ratoon crop the soil status
with respect to organic carbon and available
nitrogen was found to improve as compared to
previous year in all the treatments. Available
phosphorous and potash status was found to
decrease compared to previous year.
After the completion of the experiment the
pooled data indicated that, the organic carbon
was found to enhance in organic treatments
(T1 to T5) from 0.65 % to 0.72 %, where as it
was decreased from 0.65 % to 0.57 % in
integrated treatments (T6 to T12). The available
N in soil was significantly higher in organic
treatments than integrated treatments. The
available phosphorous was decreased in
organic treatments compared to integrated
treatments. The available potash recorded
higher status in integrated nutrient modules
compared to organic treatments except T1, T4
and T5 (Table 1).
Gogoi et al., (2004) reported that the
combined application of inorganic fertilizer
1997
Int.J.Curr.Microbiol.App.Sci (2018) 7(1): 1995-2003
and bio-fertilizers in banana cv. „Barjahaji‟
significantly increased the available NPK
status, organic C and microbial biomass and
dehydrogenase activity in soil after harvest.
Ansari and Hazarika (2009) also reported that,
the integrated use of organics with 100 %
recommended dose of NPK (P as rock
phosphate) along with bio-fertilizers increased
nitrogen,
phosphorus
and
potassium
concentration availability in soil after harvest
in banana.
The results of the present study were in line
with Hazarika et al., (2011). They reported
that, the least pH was recorded in soils where
the plants applied with 100 % RDF +
Vermicompost (4.69) and the highest organic
carbon 0.85 %, available nitrogen 296.64
(kg/ha), available P2O5 37.33 (kg/ha) and
available K2O 223.66 (kg/ha)
The present study results also indicated
increase in available nitrogen status in organic
nutrient modules. However, in integrated
nutrient modules the nitrogen status was found
to decline.
This may be attributed to the higher uptake of
nutrients in turn higher yield obtained in these
integrated treatments as compared to organic
treatments.
According to Virendra Kumar and Mishra
(1991) available phosphorus decreased due to
application of carbonation press mud. This
indicates that, the application of organic
nutrient modules would reduce the available
phosphorous as found in the present study.
Kale et al., (1992) also found that combined
application of vermicompost with NPK
fertilizers resulted in higher content of
phosphorous as compared to FYM in
combination with NPK fertilizers or control.
Balaji (1994) recorded higher levels of
available phosphorous in the treatments which
received either vermicompost or FYM in
combination with chemical fertilizers than
control. Similar results were also recorded in
the present study where integrated nutrient
modules were imposed compared to organic
nutrient modules. The integrated nutrient
module would maintain the available potash or
might increase as compared to the organic
nutrient treatment which was confirmed with
the present study results.
Effect of different sources of nutrient
modules on plant nutrient contents in
banana (Table 2)
The pooled data indicated that the highest leaf
nitrogen was recorded in T7 (3.25 %) and T10
(3.23 %) which was significantly superior
over rest of the treatments. The phosphorous
content in leaf was highest in T7 (0.32 %)
which was on par with T10, T11 and T6 and
significantly superior over rest of the
treatments.
The higher potash content in leaf was recorded
in T7 treatment (2.87 %) which was
significantly superior over rest of the
treatments. The organic treatments recorded
comparatively low nitrogen and phosphorous
content in leaf compared to integrated nutrient
modules.
The pooled data indicated that the highest
nitrogen in fruit was recorded in T10 (3.31%)
which was on par with T7 (3.27 %) followed
by T11 (3.11 %). The phosphorous content in
fruit was highest in T7 (0.32 %) which was on
par with T10 and T11 and significantly superior
over rest of the treatments.
The higher potash content in fruit was
recorded in T7 treatment (3.22 %) which was
significantly superior over rest of the
treatments. The organic treatments recorded
comparatively low nitrogen, phosphorous and
potash contents in fruit compared to integrated
nutrient modules.
1998
Int.J.Curr.Microbiol.App.Sci (2018) 7(1): 1995-2003
Table.1 Influence of different sources of nutrient modules on soil characteristics in banana cv. Grand Naine (Pooled mean)
Treatments
Soil pH (1:2.5)
EC (dS/m)
Organic C (%)
Avail N (kg/ha)
T1
T2
T3
T4
T5
T6
T7
T8
T9
T10
T11
T12
S Em+/CD at 5%
7.24
7.27
7.34
7.16
6.98
6.93
6.91
7.37
7.07
7.04
7.20
7.11
0.02
0.06
0.14
0.11
0.12
0.12
0.16
0.11
0.11
0.10
0.14
0.12
0.11
0.16
0.01
0.02
0.72
0.68
0.69
0.70
0.71
0.57
0.59
0.58
0.59
0.61
0.59
0.63
0.01
0.01
319.95
302.95
306.68
311.25
314.98
264.48
271.53
268.20
271.10
281.88
271.93
285.18
1.73
5.08
Avail P2O5
(kg/ha)
24.05
22.50
23.90
21.55
23.90
28.20
30.70
26.30
28.20
29.30
28.80
30.70
0.80
2.36
Avail K2O (kg/ha)
133.50
118.80
118.65
133.35
132.90
118.90
130.85
125.80
118.60
123.65
130.85
130.40
0.68
2.00
T1- FYM equivalent to 40% RDN (48.40 t/ha) + VC equivalent to 40% RDN (24.20 t/ha) + GM (sunnhemp @ 8.88 t/ha) and Azospirillum (@ 30.86 kg/ha) equivalent to 20% RDN + PSB (@ 30.86
kg/ha).
T2-FYM equivalent to 40% RDN (48.40 t/ha) + PM equivalent to 40% RDN (8.96 t/ha) + GM (sunnhemp @ 8.88 t/ha) and Azospirillum (@ 30.86 kg/ha) equivalent to 20% RDN + PSB (@ 30.86
kg/ha).
T3- FYM equivalent to 40% RDN (48.40 t/ha) + SM equivalent to 40% RDN (10.17 t/ha) + GM (sunnhemp @ 8.88 t/ha) and Azospirillum (@ 30.86 kg/ha) equivalent to 20% RDN + PSB (@ 30.86
kg/ha).
T4- FYM equivalent to 40% RDN (48.40 t/ha) + AG equivalent to 40% RDN (10.52 t/ha) + GM (sunnhemp @ 8.88 t/ha) and Azospirillum (@30.86kg/ha) equivalent to 20% RDN + PSB (@
30.86kg/ha).
T5- FYM equivalent to 40% RDN (48.40 t/ha) + BL equivalent to 40% RDN (7.56 t/ha) + GM (Sun hemp @ 8.88 t/ha) and Azospirillum (@ 30.86kg/ha) equivalent to 20% RDN + PSB (@ 30.86kg/ha).
T6 FYM equivalent to 40% RDN (48.40 t/ha) + 40% RDN through chemical fertilizer (Urea 535.73 kg/ ha) + GM (sunnhemp @8.88 t/ha) and Azospirillum (@ 30.86 kg/ha) equivalent to 20% RDN +
PSB (@ 30.86kg/ha).
T7- VC equivalent to 40% RDN (24.20 t/ha) + 40% RDN through chemical fertilizer (Urea 535.73 kg/ ha) + GM (sunnhemp@ 8.88 t/ha) + Azospirillum (@ 30.86kg/ha) equivalent to 20% RDN + PSB
(@ 30.86kg/ha).
T8- PM equivalent to 40% RDN (8.96 t/ha)+ 40% RDN through chemical fertilizer (Urea 535.73 kg/ ha) + GM (sunnhemp @8.88 t/ha) and Azospirillum (@ 30.86 kg/ha) equivalent to 20% RDN + PSB
(@ 30.86 kg/ha).
T9- SM equivalent to 40% RDN (10.17 t/ha) + 40% RDN through chemical fertilizer (Urea 535.73 kg/ ha) + GM (sunnhemp @8.88 t/ha) and Azospirillum (@ 30.86 kg/ha)equivalent to 20% RDN +
PSB (@ 30.86 kg/ha).
T10- AG equivalent to 40% RDN (10.52 t/ha) + 40% RDN through chemical fertilizer (Urea 535.73 kg/ ha) + GM (sunnhemp @8.88 t/ha) and Azospirillum (@ 30.86 kg/ha)equivalent to 20% RDN +
PSB (@ 30.86 kg/ha
T11- BL equivalent to 40% RDN (7.56 t/ha) + 40% RDN through chemical fertilizer (Urea 535.73 kg/ ha) + GM (sunnhemp @8.88 t/ha) and Azospirillum (@30.86 kg/ha) equivalent to 20% RDN + PSB
(@ 30.86 kg/ha)
T12 -Control (RDF=617.20:308.60: 925.80 kg NPK/ha + Farm yard manure@ 40 t/ha (plant crop)
Ratoon crop: RDF=308.60:154.20: 308.60 kg NPK/ha) + FYM @ 20/ha accordingly it has been supplied through different sources
FYM- Farmyard manure, VC-Vermicompost, PM-Poultry manure, SM-Sheep manure, AG-Agrigold, BL-Bhumilabh, GM-Green manure, PSB-Phosphate Solubilizing bacteria
1999
Int.J.Curr.Microbiol.App.Sci (2018) 7(1): 1995-2003
Table.2 Influence of different sources of nutrient modules on nutrient concentration (%) in banana cv. Grand Naine (Pooled mean)
Treatments
T1
T2
T3
T4
T5
T6
T7
T8
T9
T10
T11
T12
S. Em.±
C.D. at 5%
N
2.57
2.30
2.26
2.55
2.45
3.01
3.25
2.09
2.95
3.23
3.07
2.96
0.02
0.05
Leaf
P
0.24
0.23
0.21
0.23
0.23
0.28
0.32
0.20
0.25
0.30
0.29
0.25
0.01
0.04
K
2.33
2.21
2.14
2.29
2.24
2.48
2.87
2.04
2.42
2.75
2.62
2.47
0.01
0.04
Fruit
P
0.25
0.23
0.22
0.23
0.23
0.29
0.32
0.20
0.25
0.30
0.30
0.25
0.01
0.03
N
2.67
2.13
1.64
2.31
2.32
3.06
3.27
1.60
2.67
3.31
3.11
2.98
0.01
0.04
K
2.55
2.43
2.43
2.52
2.44
2.73
3.22
2.27
2.70
3.03
2.91
2.77
0.05
0.15
N
2.81
2.22
1.72
2.43
2.41
3.18
3.43
1.69
2.81
3.42
3.25
3.12
0.02
0.06
Stem
P
0.24
0.25
0.24
0.25
0.24
0.30
0.34
0.21
0.27
0.32
0.32
0.27
0.01
0.04
K
2.64
2.46
2.41
2.59
2.51
2.83
3.32
2.24
2.73
3.15
3.00
2.79
0.04
0.12
T1- FYM equivalent to 40 % RDN (48.40 t/ha) + VC equivalent to 40 % RDN (24.20 t/ha) + GM (sunnhemp @ 8.88 t/ha) and Azospirillum (@ 30.86 kg/ha) equivalent to 20 % RDN + PSB (@ 30.86
kg/ha).
T2-FYM equivalent to 40 % RDN (48.40 t/ha) + PM equivalent to 40 % RDN (8.96 t/ha) + GM (sunnhemp @ 8.88 t/ha) and Azospirillum (@ 30.86 kg/ha) equivalent to 20 % RDN + PSB (@ 30.86
kg/ha).
T3- FYM equivalent to 40 % RDN (48.40 t/ha) + SM equivalent to 40 % RDN (10.17 t/ha) + GM (sunnhemp @ 8.88 t/ha) and Azospirillum (@ 30.86 kg/ha) equivalent to 20 % RDN + PSB (@ 30.86
kg/ha).
T4- FYM equivalent to 40 % RDN (48.40 t/ha) + AG equivalent to 40 % RDN (10.52 t/ha) + GM (sunnhemp @ 8.88 t/ha) and Azospirillum (@ 30.86 kg/ha) equivalent to 20 % RDN + PSB (@ 30.86
kg/ha).
T5- FYM equivalent to 40 % RDN (48.40 t/ha) + BL equivalent to 40 % RDN (7.56 t/ha) + GM (Sunnhemp @ 8.88 t/ha) and Azospirillum (@ 30.86 kg/ha) equivalent to 20 % RDN + PSB (@ 30.86
kg/ha).
T6 FYM equivalent to 40 % RDN (48.40 t/ha) + 40 % RDN through chemical fertilizer (urea 535.73 kg/ ha) + GM (sunnhemp @8.88 t/ha) and Azospirillum (@ 30.86 kg/ha) equivalent to 20 % RDN +
PSB (@ 30.86 kg/ha).
T7- VC equivalent to 40 % RDN (24.20 t/ha) + 40 % RDN through chemical fertilizer (urea 535.73 kg/ ha) + GM (sunnhemp@ 8.88 t/ha) and Azospirillum (@ 30.86 kg/ha) equivalent to 20 % RDN +
PSB (@ 30.86 kg/ha).
T8- PM equivalent to 40 % RDN (8.96 t/ha)+ 40 % RDN through chemical fertilizer (urea 535.73 kg/ ha) + GM (sunnhemp @8.88 t/ha) and Azospirillum (@ 30.86 kg/ha) equivalent to 20 % RDN +
PSB (@ 30.86 kg/ha).
T9- SM equivalent to 40 % RDN (10.17 t/ha) + 40 % RDN through chemical fertilizer (urea 535.73 kg/ ha) + GM (sunnhemp @8.88 t/ha) and Azospirillum (@ 30.86 kg/ha) equivalent to 20 % RDN +
PSB (@ 30.86 kg/ha).
T10- AG equivalent to 40 % RDN (10.52 t/ha) + 40 % RDN through chemical fertilizer (urea 535.73 kg/ ha) + GM (sunnhemp @8.88 t/ha) and Azospirillum (@ 30.86 kg/ha) equivalent to 20 % RDN +
PSB (@ 30.86 kg/ha
T11- BL equivalent to 40 % RDN (7.56 t/ha) + 40 % RDN through chemical fertilizer (urea 535.73 kg/ ha) + GM (sunnhemp @8.88 t/ha) and Azospirillum (@ 30.86 kg/ha) equivalent to 20 % RDN +
PSB (@ 30.86 kg/ha)
T12 -Control (RDF=617.20:308.60: 925.80 kg NPK/ha + Farm yard manure@ 40 t/ha (plant crop)
Ratoon crop: RDF=308.60:154.20: 308.60 kg NPK/ha) + FYM @ 20/ha accordingly it has been supplied through different sources
FYM- Farmyard manure, VC-Vermicompost, PM-Poultry manure, SM-Sheep manure, AG-Agrigold, BL-Bhumilabh, GM-Green manure, PSB-Phosphate Solubilizing bacteria
2000
Int.J.Curr.Microbiol.App.Sci (2018) 7(1): 1995-2003
Table.3 Influence of different sources of nutrient modules on economics of banana cv. Grand Naine (Pooled mean)
Treatments
T1
T2
T3
T4
T5
T6
T7
T8
T9
T10
T11
T12
S Em+/CD at 5%
GC (Rs)
1,72,070
1,41,057
1,47,347
1,84,279
2,07,715
1,68,454
1,92,654
1,29,016
1,35,306
1,72,238
1,95,674
1,21,164
-
GR (Rs)
4,25,377
3,51,422
3,39,108
4,22,733
4,06,747
4,09,822
4,97,621
3,58,638
4,11,605
4,90,095
4,28,279
4,13,830
24394
71546
NR (Rs)
2,53,307
2,10,365
1,91,761
2,38,454
1,99,032
2,41,368
3,04,967
2,29,622
2,76,299
3,17,857
2,32,605
2,92,667
24395
71546
B:C ratio
2.45
2.49
2.30
2.29
1.96
2.43
2.58
2.78
3.04
2.85
2.19
3.42
0.14
0.41
Banana fruit selling price (Rs/t): plant crop Rs.8,000 and ratoon crop Rs.7,000
GC: Gross cost, GR: Gross returns, NR: Net returns and B: C ratio benefit : cost ratio
T1- FYM equivalent to 40 % RDN (48.40 t/ha) + VC equivalent to 40 % RDN (24.20 t/ha) + GM (sunnhemp @ 8.88 t/ha) and Azospirillum (@ 30.86 kg/ha) equivalent to 20 % RDN + PSB (@ 30.86
kg/ha).
T2-FYM equivalent to 40 % RDN (48.40 t/ha) + PM equivalent to 40 % RDN (8.96 t/ha) + GM (sunnhemp @ 8.88 t/ha) and Azospirillum (@ 30.86 kg/ha) equivalent to 20 % RDN + PSB (@ 30.86
kg/ha).
T3- FYM equivalent to 40 % RDN (48.40 t/ha) + SM equivalent to 40 % RDN (10.17 t/ha) + GM (sunnhemp @ 8.88 t/ha) and Azospirillum (@ 30.86 kg/ha) equivalent to 20 % RDN + PSB (@ 30.86
kg/ha).
T4- FYM equivalent to 40 % RDN (48.40 t/ha) + AG equivalent to 40 % RDN (10.52 t/ha) + GM (sunnhemp @ 8.88 t/ha) and Azospirillum (@ 30.86 kg/ha) equivalent to 20 % RDN + PSB (@ 30.86
kg/ha).
T5- FYM equivalent to 40 % RDN (48.40 t/ha) + BL equivalent to 40 % RDN (7.56 t/ha) + GM (Sunnhemp @ 8.88 t/ha) and Azospirillum (@ 30.86 kg/ha) equivalent to 20 % RDN + PSB (@ 30.86
kg/ha).
T6 FYM equivalent to 40 % RDN (48.40 t/ha) + 40 % RDN through chemical fertilizer (urea 535.73 kg/ ha) + GM (sunnhemp @8.88 t/ha) and Azospirillum (@ 30.86 kg/ha) equivalent to 20 % RDN +
PSB (@ 30.86 kg/ha).
T7- VC equivalent to 40 % RDN (24.20 t/ha) + 40 % RDN through chemical fertilizer (urea 535.73 kg/ ha) + GM (sunnhemp@ 8.88 t/ha) and Azospirillum (@ 30.86 kg/ha) equivalent to 20 % RDN +
PSB (@ 30.86 kg/ha).
T8- PM equivalent to 40 % RDN (8.96 t/ha)+ 40 % RDN through chemical fertilizer (urea 535.73 kg/ ha) + GM (sunnhemp @8.88 t/ha) and Azospirillum (@ 30.86 kg/ha) equivalent to 20 % RDN +
PSB (@ 30.86 kg/ha).
T9- SM equivalent to 40 % RDN (10.17 t/ha) + 40 % RDN through chemical fertilizer (urea 535.73 kg/ ha) + GM (sunnhemp @8.88 t/ha) and Azospirillum (@ 30.86 kg/ha) equivalent to 20 % RDN +
PSB (@ 30.86 kg/ha).
T10- AG equivalent to 40 % RDN (10.52 t/ha) + 40 % RDN through chemical fertilizer (urea 535.73 kg/ ha) + GM (sunnhemp @8.88 t/ha) and Azospirillum (@ 30.86 kg/ha) equivalent to 20 % RDN +
PSB (@ 30.86 kg/ha
T11- BL equivalent to 40 % RDN (7.56 t/ha) + 40 % RDN through chemical fertilizer (urea 535.73 kg/ ha) + GM (sunnhemp @8.88 t/ha) and Azospirillum (@ 30.86 kg/ha) equivalent to 20 % RDN +
PSB (@ 30.86 kg/ha)
T12 -Control (RDF=617.20:308.60: 925.80 kg NPK/ha + Farm yard manure@ 40 t/ha (plant crop)
Ratoon crop: RDF=308.60:154.20: 308.60 kg NPK/ha) + FYM @ 20/ha accordingly it has been supplied through different sources
FYM- Farmyard manure, VC-Vermicompost, PM-Poultry manure, SM-Sheep manure, AG-Agrigold, BL-Bhumilabh, GM-Green manure, PSB-Phosphate Solubilizing bacteria
2001
Int.J.Curr.Microbiol.App.Sci (2018) 7(1): 1995-2003
The pooled data indicated that the highest
nitrogen in stem was recorded in T7 (3.43 %)
which was significantly superior over rest of the
treatments. The phosphorous content in stem
was highest in T7 (0.34 %) which was on par
with T10, T11 and T6 and significantly superior
over rest of the treatments. The higher potash
content in stem was recorded in T7 treatment
(3.32 %) which was significantly superior over
rest of the treatments (Table 2). The integrated
nutrient modules recorded the superior nitrogen,
phosphorous and potash contents in stem
compared to organic treatments.
Among the different plant parts, the nitrogen
content of leaf was higher compared to fruit and
stem. The phosphorous content of fruit was
higher compared to leaf and stem. The potash
content in banana pseudostem was superior
compared to fruit and leaf in all the treatments.
The present study results were in line with the
results reported by Ansari and Hazarika (2009).
They opined that, the integrated use of organics
with 100 % recommended dose of NPK (P as
rock phosphate) along with bio-fertilizers
increased nitrogen, phosphorus and potassium
concentration in banana plant.
Effect of different sources of nutrient
modules on economics of banana (Table 3)
Banana crop is an exhaustive commercial
horticultural crop which is grown for two-tothree years from single planting. The nutrient
management plays a major role in its
cultivation. The nutrient module which fetches
higher returns as well as on par benefit: cost
ratio as that of highest returns and highest
benefit: cost ratio can be adopted for cultivation
of banana.
The pooled economic analysis of treatments
revealed that the lowest gross cost (Rs.1.29
lakh/ha) was incurred in the treatment T8
{Poultry manure equivalent to 40 % RDN (8.96
t/ha) + 40 % RDN through chemical fertilizer
(urea 535.73 kg/ ha) + Green manure
(sunnhemp @ 8.88 t/ha) and Azospirillum
(30.86 kg/ha) equivalent to 20 % RDN + PSB
(30.86
kg/ha)}.
The
treatment
T7
{Vermicompost equivalent to 40 % RDN (24.20
t/ha) + 40 % RDN through chemical fertilizer
(urea 535.73 kg/ ha) + Green manure
(sunnhemp @ 8.88 t/ha) and Azospirillum
(30.86 kg/ha) equivalent to 20 % RDN + PSB
(30.86 kg/ha)} recorded the highest gross
returns (Rs.4.97 lakh/ha). The highest net
returns {Rs.3.17 lakh/ha} in T10 {Agrigold
equivalent to 40 % RDN (10.52 t/ha) + 40 %
RDN through chemical fertilizer (urea 535.73
kg/ ha) + Green manure (sunnhemp @ 8.88
t/ha) and Azospirillum (30.86 kg/ha) equivalent
to 20 % RDN + PSB (30.86 kg/ha)} followed
by T7 (Rs.3.04 lakh/ha). The highest benefit:
cost ratio (3.42) was recorded in T12 {RDF =
617: 308.6: 925.8 kg NPK /ha) + Farmyard
manure (@ 40.00 t/ha) followed by T9, T10, T8
and T7 (3.04, 2.85, 2.78 and 2.58 respectively)
treatments. The treatment T7 (vermicompost
combination) recorded moderate net returns
(3.04 lakh/ ha) and B: C ratio (2.58) and is
considered to be good due to the fact that if
vermicompost is produced by farmers
themselves the BC ratio can also be improved.
Bhalerao et al., (2009) reported that application
of 100 % recommended dose of NPK with 10
kg FYM per plant and bio-fertilizers
(Azospirillum and PSB at 25 g each per plant)
was found beneficial in terms financial returns
with highest benefit cost ratio (1.48) in banana
cv. Grand Naine.
Tangaselvabai et al., (2009) also reported that
treatment with 100:30:330 g NPK/plant in 2
splits + Azospirillum was found to be superior
for increased net profit (Rs/ha) and benefit: cost
ratio. The integrated nutrient modules would be
superior in obtaining higher net profit and on
par benefit: cost ratio as compared to the control
treatment (100% RDF + FYM).
Kuttimani et al., (2013b) reported that, higher
gross returns of Rs. 3,63,850/- and
Rs.3,85,600/- was recorded during 2010-11 and
2011-12 respectively with the application of
100 per cent recommended dose of fertilizer
2002
Int.J.Curr.Microbiol.App.Sci (2018) 7(1): 1995-2003
along with 40 % Wellgro soil and the net return
was higher (Rs. 2,25,403/- and Rs. 2,48,364/-)
with the application of 100 % recommended
dose of fertilizer along with 40 % Well grow
soil. The benefit-cost ratio was higher (2.63)
with 40 % Well grow soil + 100 % RDF. The
results of the present study also indicated higher
gross returns when integrated nutrient modules
were followed. However, the organic nutrient
modules registered lesser gross returns owing to
the fact that the banana crop is an exhaustive
crop which might not be coped up by organics
alone.
The integrated nutrient modules favoured
higher nutrient concentrations of NPK in
different plant parts of banana through higher
soil availability of nutrients and in turn yield.
Therefore the higher yield per hectare was
obtained
in
T7
(with
Vermicompost
combination), T10 (with Agri-gold combination)
and T11 (with Bhumilabh combination)
indicating the potentiality of these organic
manures when used in conjunction with
chemical and bio- fertilizers. The treatment T7
recorded the highest gross returns (Rs.4.97
lakh/ha) and moderate net returns (Rs.3.04
lakh/ha). However, the B: C ratio was highest in
control (T12, 3.42).
References
Anonymous, 2011. National Horticulture Board.
Department
of
Agriculture
and
Cooperation, Ministry of Agriculture, Govt.
of India, New Delhi.
Ansari, S. and Hazarika, B. N., 2009. Effect of
integrated nutrient management on leaf
nutrient content in banana and nutrient
availability in soil after harvest. Environ.
Ecol., 27(2): 553-556.
Balaji, S. K., 1994. Effect of vermicompost on
growth and flower yield of China aster
(Callistephus chinensis). M. Sc. (Agri.)
Thesis, Univ. Agric. Sci., Dharwad,
Karnataka (India).
Bhalerao, V. P., Patil, N. M., Badgujar, C. D. and
Patil, D. R., 2009. Studies on integrated
nutrient management for tissue cultured
Grand Naine banana. Indian J. Agric. Res.,
43 (2):107-112.
Gogoi, D., Kotoky, U. and Hazarika, S., 2004.
Effect of bio-fertilizers on productivity and
soil characteristics in banana. India J. Hort.
61: 354-356.
Hazarika, T. K., Nautiyal, B. P. and Bhattacharya,
R. K., 2011. Effect of INM on productivity
and soil characteristics of tissue cultured
banana cv. Grand Naine in Mizoram, India.
Indian J. Hort. 43(1): 30-35.
Kale, R. D., Mallesh, B. C., Bano, K. and
Bhagyaraj, D. J., 1992. Influence of
Vermicompost application on available
micro nutrients and selected microbial
population in a paddy field soil. Bio and
Biochem, 29(12): 1317-1320.
Kuttimani, R., Velayudham, K., Somasundaram
E. and Muthukrishnan, P. 2013b. Effect of
integrated nutrient management on yield
and economics of banana. Global Journal
of Biology, Agriculture and Health
Sciences., 2(4):191-195.
Sridhara,
R.,
2009.
Integrated
nutrient
management in hill banana cv. Virupakshi.
M. Sc. (Hort.) Thesis, Horticultural College
and
Research
Institute,
TNAU,
Periyakulam, Tamil Nadu (India).
Tangaselvabai, T., Gailice leo justin, C., Nirmal
Johnson, S.B. and Jayasekhar, M., 2009.
Influence of nutrients on qualitative and
quantitative traits of banana. Indian J.
Agric. Res. 43(4): 274-278.
Virendra Kumar and Mishra, B., 1991. Effect of
two types of Press mud cake on growth of
rice- maize and soil properties. Indian Soc.
Soil Sci., 39: 109-113.
How to cite this article:
Ganapathi, T. and Dharmatti, P.R. 2018. Influence of Different Sources of Nutrient Modules on Soil
Characteristics, Plant Nutrient Contents and Economics in Banana cv. Grand Naine.
Int.J.Curr.Microbiol.App.Sci. 7(01): 1995-2003. doi: />
2003