Effect of different colour of shadenet and growing media on the quality parameters and yield of spinach cultivated by hydroponics
Bạn đang xem bản rút gọn của tài liệu. Xem và tải ngay bản đầy đủ của tài liệu tại đây (287.01 KB, 10 trang )
Int.J.Curr.Microbiol.App.Sci (2018) 7(3): 159-168
International Journal of Current Microbiology and Applied Sciences
ISSN: 2319-7706 Volume 7 Number 03 (2018)
Journal homepage:
Original Research Article
/>
Effect of Different Colour of Shadenet and Growing Media on the Quality
Parameters and Yield of Spinach Cultivated by Hydroponics
Sanjivani C. Karne1*, Suchita V. Gupta1, Bhagyashree N. Patil2 and
Amrapali A. Aakhre3
1
Department of Farm Structures, CAET, Dr. PDKV, Akola, Maharashtra, India
2
Department of APE, CAET, Dr. PDKV, Akola, Maharashtra, India
3
Department of Biotechnology, CAET, Dr. PDKV, Akola, Maharashtra, India
*Corresponding author
ABSTRACT
Keywords
Hydroponics,
Quality parameters,
Moisture content,
Leaf area, Yield
Article Info
Accepted:
04 February 2018
Available Online:
10 March 2018
The experiment was conducted during summer season of 2016- 2017 at the field of
Department Farm Structures, Dr. Panjabrao Deshmukh Krishi Vidyapeeth, Akola. The
experimental site was fairly uniform and levelled. Hydroponic structure was designed for
the cultivation of leafy vegetables by different hydroponic methods. The dimensions of
portable hydroponic structure were 1375 mm high x 925 mm long and were made from
locally available materials. The structure was made up of mild steel hollow pipes of size
25.4 mm which were bended and welded together to form a Quonset-type structure.
Cultivation of spinach by using two different hydroponic methods was carried out under
controlled atmosphere and on the open field. Solid media culture and liquid hydroponics
were used and in solid media three different types of media were used on cocopeat, soil
rite and 50% cocopeat and 50% soil rite. Various chemical characteristics like iron content
and chlorophyll content were determined by different methods of determination of iron
and chlorophyll content of spinach in Green and white portable hydroponic structure and
open-field after the proper growth of crop. All the observations were analyzed by Design
expert version 9.0.2.0 software was used to analyze the result using response surface
methodology (RSM). Maximum Moisture content was found 90.877% and maximum leaf
area was found 32.798 dm/sq. m. Yield of spinach was found greater in the green colour
hydroponic structure in between 150-210 q/ha. Yield inside the white colour hydroponic
structure was found between 120-200 q/ha and in the open field it was found between 5080 q/ha.
Introduction
The technology for food production in
greenhouse has advanced a great deal in the
last 20 years. Greenhouse food production
often
termed
controlled
environment
agriculture (CEA) usually accompanies
hydroponics. Hydroponic culture is possibly
the most intensive method of crop production
in today’s agricultural industry in combination
with greenhouses. Yet, for most of its
employees, hydroponic culture requires only
basic agricultural skills. Since regulating the
aerial and root environment is a major concern
in such agricultural systems, production takes
place inside enclosed design to control air and
159
Int.J.Curr.Microbiol.App.Sci (2018) 7(3): 159-168
root temperatures, light, water, plant nutrition
and adverse climate (Dalrymple, 1973).
Soil is usually the most available growing
medium for plants. It provides anchorage,
nutrients, air, water, etc. for successful plant
growth. However, soils do pose serious
limitations for plant growth too, at times.
Presence of disease causing organisms and
nematodes,
unsuitable
soil
reaction,
unfavourable soil compaction, poor drainage,
degradation due to erosion etc. are some of
them. In addition, conventional crop
cultivation in soil (Open Field Agriculture) is
somewhat difficult as it involves large space,
lot of labour and large volume of water.
Moreover, some places like metropolitan
areas, soil is not available for crop growing at
all, or in some areas, we find scarcity of fertile
cultivable arable lands due to their
unfavourable geographical or topographical
conditions. Therefore the portable greenhouse
is an excellent alternative for garden
enthusiasts to indulge in their favourite
activity given a small space and budget. A
portable greenhouse is a huge space saver that
can help jump-start spring planting that can be
continued until the fall compared to traditional
greenhouse structures.
Spinach (Spinacia Oleracea) is an edible
flowering plant in the family Amaranthaceae
native to central and western Asia. Its leaves
are eaten as a vegetable, it is an annual plant
(rarely biennial) growing as tall as 30 cm
(1 ft.). Spinach may survive over winter in
temperate regions. The leaves are alternate,
simple, ovate to triangular, and very variable
in size from about 2-30 cm (1-12 in) long and
1-15 cm (0.4-5.9 in) broad, with larger leaves
at the base of the plant and small leaves higher
on the flowering stem. Spinach is a storehouse
for many phytonutrients that have health
promotional and disease prevention properties.
It is very low in calories and fats (100 g of raw
leaves provide just 23 calories). Also, its
leaves hold a good amount of soluble dietary
fiber. Spinach is a hot weather crop but can
also be grown during moderate winter season.
It can also tolerate frost to some extent
(Agrifarming).
The very limited study is available regarding
the cultivation of vegetables and the quality
parameters of spinach by different hydroponic
methods. Therefore the study is taken with the
following an objective, to evaluate the quality
parameters of spinach grown under portable
hydroponic structure.
Materials and Methods
Study area
The experiment
summer season of
Department Farm
Deshmukh Krishi
experimental site
levelled.
was conducted during
2016- 2017 at the field of
Structures, Dr. Panjabrao
Vidyapeeth, Akola. The
was fairly uniform and
Portable hydroponic structure
Hydroponic structure was designed for the
cultivation of leafy vegetables by different
hydroponic methods. Two same size frames of
structure were designed and fabricated in
which different colour of covering material
was used such as green and white. The
structure was lightweight so that it can move
from one place to another place as per the
convenience of crop environment. The
dimensions of portable hydroponic structure
were 1375 mm high x 925 mm long. The
structure was made up of mild steel hollow
pipes of size 25.4 mm which were bended and
welded together to form a Quonset-type
structure.
The portable hydroponic structure was
specially designed for leafy vegetable
cultivation. In this study two structures was
160
Int.J.Curr.Microbiol.App.Sci (2018) 7(3): 159-168
constructed with different covering materials
one for white and another for green covering.
Also two types of media culture were used
such as solid media and liquid media. The
different combinations are as follows,
Types of structures
Green hydroponic structure
White hydroponic structure
Open field
Similarly procedure was carried out for Green
and White portable hydroponic structure and
also for the open field.
Cultivation Media
Cocopeat
Soil rite
50% Cocopeat 50% soil rite
Liquid media
Size and material
cultivation
of
respectively was manually filled with
cocopeat and soil rite in the following manner.
Each was filled with cocopeat, soil rite and
mixture of cocopeat and soil rite (50-50 %).
Sample was thoroughly mixed with small
amount of water. As per the size of trays,
same size square was drawn on the growing
medium and seeds were sown at the middle of
the square. The process was replicated thrice.
Liquid culture
tray used
for
For the solid media culture method, small
plastic tray was used having size 36 cm * 25
cm * 6cm in length, width and height
respectively. For liquid culture method tray of
GI material was used having size 75 cm * 28
cm * 7 cm in length, width and height
respectively, having 20 liter water holding
capacity. In this method tray require a cover
which holds the cups containing growing
media. Cover of the liquid media tray was
made up of plywood material having size 78
cm* 30 cm length, width respectively and
thickness was 0.5 cm. Each cover contains 8
holes having diameter 5 cm to hold the
hydroponic cups. Also the hydroponic cups
for liquid culture method and air pumps for air
circulation were used in the experiment.
Sowing of seeds
Solid media culture method
In this method plastic tray of size 36 cm * 25
cm * 6cm in length, width and height
In this method seeds are not directly sown in
liquid medium. In liquid culture seeds were
first sown in seedling trays. For ease of
transplant of seedlings, they were sown in
hydroponic cups which contain cocopeat as
growing medium. They were placed in
seedling tray cups. After 5 days from sowing
seedling were transplanted in to the trays
which contains water and application of
fertilizers doses was applied at 5 days equal
interval as 1 g/ lit of 19:19:19 as major
nutrient and suprimo 5 ml. in lit. of water as
micro nutrient for solid media and also for
liquid media cultivation. Environmental
parameters like temperature, relative humidity,
light intensity and CO2 were measured from
6thmarch, 2017 to 23 rd April 2017 under
controlled condition. These data were used to
calculate the monthly average data, which
were used for observing daily variation in
microclimate during the experiment.
Quality parameters of spinach
In the present study various quality parameters
were determined as moisture content, leaf
area, and yield of spinach in each hydroponic
structure and open field. Following methods
was used to study the different quality
parameters. The moisture content of spinach
161
Int.J.Curr.Microbiol.App.Sci (2018) 7(3): 159-168
during experiment was determined on the dry
basis using the following method (AOAC,
1984). A small sample approximately 50 g of
spinach was kept in a pre-dried and weighed
moisture box. The mass of the sample was
recorded as W1. The box was placed in an
oven maintained at 70o C temperature for 18
hours. After drying, the sample was cooled in
desiccators at room temperature and weighed
after cooling. The mass of the dried sample
was recorded as W2. The moisture content of
the sample was calculated by using the
following formula:
Moisture content (%) =
Where,
W1 = Initial Weight of sample and
W2 = Final Weight of Sample
Leaf area of spinach was determined directly
by using Leaf Area Meter. Yield is the most
important factor in the crop production. After
harvesting Weight of spinach harvested from
each tray was measured and yield quintal per
hector was calculated.
All the observations were analysed by Design
expert trail version 9.0.2.0 software was used
to analyze the result using response surface
methodology (RSM) which is a collection of
mathematical and statistical technique that are
useful for modelling and analysis of problems
in which a response of interest is influenced
by several variables (Montgomery, 2001). The
two variable Multilevel Cathagoric Factorial
Design model was used for obtaining the
Multilevel Cathagoric Factorial Design as
responses for each treatment was applied in
this work to study the variables for quality
parameters of spinach cultivated by
hydroponics. This method is suitable for
fitting a quadratic surface and it helps to
optimize the effective parameters with a
minimum number of experiments as well as
analyze the interaction between parameters
(Kwaghger et al., 2012).
Results and Discussion
Experimental data for response surface
method
The experimental data for moisture content,
leaf area and yield are presented in Table 1.
The second order polynomial response surface
model was fitted to each response variable.
Regression analysis and ANOVA were
calculated for fitting the model and the
significant of the model term was examined
statistically. The computed regression
coefficients of the second order polynomial
models for the response variables along with
the corresponding R2 and coefficient of
variance (CV) are given in Table 2. As a
general rule, the coefficient of variation (CV)
should not be greater than 10% (Snedecorand
Cochran, 1967). Two variable Multilevel
Cathagoric Factorial Design used for
obtaining responses for each treatment. Table
1 represents experimental data for quality
parameters of spinach in portable hydroponic
structures.
Analysis of variance for moisture content
It has been observed that for the moisture
content highest results were obtained inside
the liquid media in both the green and white
structure effect (higher coefficient values).
Analysis of variance shows that the models
are highly significant (p≤0.001) for all the
responses (Table 2).
The coefficient of determination (R2) values of
all responses are quite high (>0.86), indicating
a high proportion of variability was explained
by the data and the RSM models were
adequate (Table 2). The equation describing
the effects of Structure and growing media on
moisture content in terms of coded values of
variable is given as:
162
Int.J.Curr.Microbiol.App.Sci (2018) 7(3): 159-168
Moisture Content = +85.88+4.21* A[1]
+1.95* A[2] -0.37* B[1] -0.34* B[2] -1.88*
B[3] (R2-0.8662) ……..1
Positive sign in front of the term indicates
synergistic effect, whereas negative sign
indicates antagonistic effect (Hameed et al.,
2008). The linear positive terms Eqn. (1)
indicated that moisture content was found
more inside the structure than open field also
it shows different results in different growing
medium. The different solid growing media
show different results.
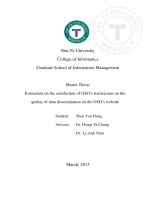
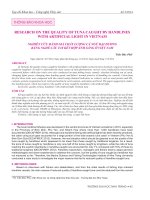
The graphical representation of the equation
for the optimization of moisture content is
shown as 3-D dimensional plot in Figure 1.
The response surface plot representing the
effect structure and growing medium on the
moisture content. The results showed that
green hydroponic structure with liquid
medium shows the high moisture content.
White hydroponic structure followed by green
hydroponic structure and less moisture content
was found on the open field.
Analysis of variance for leaf area
It has been observed that for the leaf area
highest results were obtained inside the liquid
media in both the green and white structure
effect (higher coefficient values). Analysis of
variance shows that the models are highly
significant (p≤0.001) for all the responses
(Table 3). The coefficient of determination
(R2) values of all responses are quite high
(>0.78), indicating a high proportion of
variability was explained by the data and the
RSM models were adequate (Table 3). The
equation describing the effects of Structure
and growing media on leaf area in terms of
coded values of variable is given as:
Leaf Area = +20.56+3.95* A[1] +2.43* A[2]
+0.19* B[1] -8.21* B[2] -0.27* B[3] (R2 –
0.7849)………..2
Positive sign in front of the term indicates
synergistic effect, whereas negative sign
indicates antagonistic effect (Hameed et al.,
2008). The linear positive terms Eqn. (2)
indicated that leaf area was found more inside
the structure than open field also it shows
different results in different growing medium.
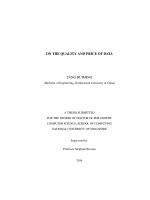
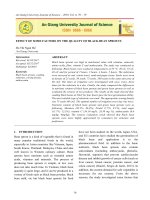
The graphical representations of the equation
for the optimization of leaf area are shown as
3-D dimensional plot in Figure 2. The
response surface plot representing the effect
structure and growing medium on the leaf
area. The results showed that green
hydroponic structure with liquid medium
shows the high leaf area. White hydroponic
structure followed by green hydroponic
structure and less leaf area was found on the
open field. For the different solid growing
media showing different result.
Analysis of variance for yield
It has been observed that for the yield highest
results were obtained inside the liquid media
in both the green and white structure effect
(higher coefficient values). Analysis of
variance shows that the models are highly
significant (p≤0.001) for all the responses
(Table 3). The coefficient of determination
(R2) values of all responses are quite high
(>0.85), indicating a high proportion of
variability was explained by the data and the
RSM models were adequate (Table 4).
The equation describing the effects of
Structure and growing media on yield in terms
of coded values of variable is given as:
Yield = +127.72+29.72* A[1] +27.54* A[2] 6.60* B[1] -27.28* B[2] -3.29* B[3] (R2 –
0.8592)………..3
Positive sign in front of the term indicates
synergistic effect, whereas negative sign
indicates antagonistic effect (Hameed et al.,
2008).
163
Int.J.Curr.Microbiol.App.Sci (2018) 7(3): 159-168
Table.1 Experimental data for quality parameters of spinach
Sr.
No.
1
2
3
4
5
6
7
8
9
10
11
12
13
14
15
16
17
18
19
20
21
22
23
24
25
26
27
28
29
30
31
32
33
34
35
36
Structures
Green Hydroponic Structure
White Hydroponic structure
Open field
Green Hydroponic Structure
White Hydroponic structure
Open field
Green Hydroponic Structure
White Hydroponic structure
Open field
Green Hydroponic Structure
White Hydroponic structure
Open field
Green Hydroponic Structure
White Hydroponic structure
Open field
Green Hydroponic Structure
White Hydroponic structure
Open field
Green Hydroponic Structure
White Hydroponic structure
Open field
Green Hydroponic Structure
White Hydroponic structure
Open field
Green Hydroponic Structure
White Hydroponic structure
Open field
Green Hydroponic Structure
White Hydroponic structure
Open field
Green Hydroponic Structure
White Hydroponic structure
Open field
Green Hydroponic Structure
White Hydroponic structure
Open Field
Growing
Media
Cocopeat
Cocopeat
Cocopeat
Soil Rite
Soil Rite
Soil Rite
Co.+ SR.
Co.+ SR.
Co.+ SR.
Liquid
Liquid
Liquid
Cocopeat
Cocopeat
Cocopeat
Soil Rite
Soil Rite
Soil Rite
Co.+ SR.
Co.+ SR.
Co.+ SR.
Liquid
Liquid
Liquid
Cocopeat
Cocopeat
Cocopeat
Soil Rite
Soil Rite
Soil Rite
Co.+ SR.
Co.+ SR.
Co.+ SR.
Liquid
Liquid
Liquid
164
Moisture
Content (%)
90.56
88.12
80.32
89.87
87.26
79.86
89.26
87.23
75.26
95.26
92.15
87.26
88.62
86.92
80.16
88.92
86.64
80.16
88.26
86.72
76.56
93.24
90.56
78.22
89.26
87.32
78.29
87.26
85.57
84.26
88.36
86.14
78.2
92.21
89.26
77.98
Leaf Area
(Dm/m2)
22.2
20.4
12.6
12.26
11.3
10.36
22.24
21.1
12.96
34.5
33.26
26.34
20.18
19.6
14.2
12.84
11.98
10.26
24.3
23.1
12.26
32.16
30.2
11.96
30.42
28.1
19.04
16.8
14.12
11.21
27.2
25.1
14.3
38.98
37.56
14.68
Yield
(q/ha)
170.25
168.58
96.36
117.25
115.26
67.3
125.2
122.36
50.56
215.54
212.59
70.36
137.57
135.48
51.26
121.39
120.44
56.25
152.45
150.5
67.59
202.25
200.58
105.56
132.25
129.9
68.45
122.42
120.51
63.14
190.25
188.54
72.35
202.48
198.3
76.3
Int.J.Curr.Microbiol.App.Sci (2018) 7(3): 159-168
Table.2 ANOVA table showing the effects of structures and growing media on moisture content
Source
Model
A-Structure
B-Growing Media
Residual
Lack of Fit
Pure Error
Cor Total
Std. Dev.
Mean
C.V. %
R2
Adj R2
Pred R2
Sum of Squares
808.83
714.75
94.08
124.96
32.16
92.80
933.79
2.04
85.88
2.38
0.8662
0.8439
0.8073
Df
5
2
3
30
6
24
35
Mean Square
161.77
357.37
31.36
4.17
5.36
3.87
F Value
38.84
85.80
7.53
p-value Prob> F
< 0.0001
< 0.0001
0.0007
1.39
0.2605
significant
not significant
Table.3 ANOVA table showing the effects structures and growing media on leaf area
Source
Model
A-Structure
B-Growing Media
Residual
Lack of Fit
Pure Error
Cor Total
Std. Dev.
Mean
C.V. %
R2
Adj R2
Pred R2
Sum of Squares
1972.13
745.81
1226.32
540.30
207.19
333.11
2512.42
4.24
20.56
20.64
0.7849
0.7491
0.6903
Df
5
2
3
30
6
24
35
Mean Square
394.43
372.90
408.77
18.01
34.53
13.88
F Value
21.90
20.71
22.70
p-value Prob>F
< 0.0001
< 0.0001
< 0.0001
2.49
0.0515
significant
not significant
Table.4 ANOVA table showing the effects structures and growing media on yield
Source
Model
A-Structure
B-Growing Media
Residual
Lack of Fit
Pure Error
Cor Total
Std. Dev.
Mean
C.V. %
R2
Adj R2
Pred R2
Sum of Squares
78664.82
59046.61
19618.20
12889.87
4490.44
8399.43
91554.68
20.73
127.72
16.23
0.8592
0.8357
0.7973
Df
5
2
3
30
6
24
35
Mean Square
15732.96
29523.31
6539.40
429.66
748.41
349.98
165
F Value
36.62
68.71
15.22
p-value Prob>F
< 0.0001
< 0.0001
< 0.0001
2.14
0.0859
significant
not significant
Int.J.Curr.Microbiol.App.Sci (2018) 7(3): 159-168
Table.5 Optimization criteria for different quality parameters of spinach
Name
Goal
A:Structure
is in range
B:Growing Media
Moisture Content
Leaf Area
Yield
is in range
maximize
maximize
maximize
Lower
Limit
Green
Hydroponic
Structure
cocopeat
75.26
10.26
50.56
Upper
Limit
Open
field
Lower Upper Importance
weight weight
1
1
3
Liquid
95.26
38.98
215.54
1
1
1
1
1
1
1
1
3
3
3
3
Table.6 Solution generated by software for quality parameters of spinach
Growing Moisture
Media
Content
Green Hydroponic Liquid
92.675
Structure
Leaf
Area
32.798
Yield
Desirability
194.609
0.842
Selected
Fig.1 Effect of hydroponic structure and growing media on moisture content
Design-Expert® Software
Factor Coding: Actual
Moisture Content
Design points above predicted value
Design points below predicted value
X1 = A: Structure
X2 = B: Growing Media
100
95
Moisture Content
1
Structure
90
85
80
75
Liquid
Open field
cocopeat+soil rite
White Hydroponic structure
soil rite
B: Growing Media
cocpeat
Structure
Green HydroponiA:
Structure
Fig.2 Effect of hydroponic structure and growing media on leaf area
Design-Expert® Software
Factor Coding: Actual
Leaf Area
Design points above predicted value
Design points below predicted value
X1 = A: Structure
X2 = B: Growing Media
40
30
Leaf Area
No.
20
10
0
Liquid
Open field
cocopeat+soil rite
White Hydroponic structure
soil rite
B: Growing Media
cocpeat
166
Structure
Green HydroponiA:
Structure
Int.J.Curr.Microbiol.App.Sci (2018) 7(3): 159-168
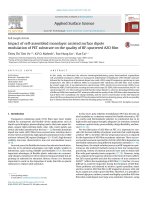
Fig.3 Effect of hydroponic structure and growing media on yield
Design-Expert® Software
Factor Coding: Actual
Yield
Design points above predicted value
Design points below predicted value
X1 = A: Structure
X2 = B: Growing Media
250
200
Yield
150
100
50
0
Liquid
Open field
cocopeat+soil rite
White Hydroponic structure
soil rite
B: Growing Media
cocpeat
The linear positive terms Eqn. (3) indicated
that yield was found more inside the structure
than open field also it shows different results
in different growing medium and inside the
structure.
Structure
Green HydroponiA:
Structure
the STATEASE software (StateaseInc,
Minneapolis, USA, Trial version), used for
simultaneous optimization of the multiple
responses.
Table 6. Shows that the software generated
eleven optimum conditions of independent
variables with the predicted values of
responses. Solution No.1, having the
maximum desirability value (0.842) was
selected as the optimum conditions for better
quality of spinach.
The solution generated optimum conditions of
independent variables with the predicted
values of responses (Table 4).
The graphical representations of the equation
for the optimization of yield are shown as 3-D
dimensional plot in Figure 3.
Maximum Moisture content, yield and leaf
area were found to be 90.877%, 150-210 q/h
and 32.798 dm/sq. m. respectively in the
green colour hydroponic structure. Also in
white colour hydroponic structure Moisture
content, yield and leaf area were found to be
less as compare to green hydroponic structure
but more than open field. Yield inside the
white hydroponic structure was found 120200 q/ha and in the open field it was found
between 50-80 q/ha.
The response surface plot representing the
effect structure and growing medium on the
yield. The results showed that green
hydroponic structure with liquid medium
shows the high yield. White hydroponic
structure followed by green hydroponic
structure and less yield was found on the open
field. For the different solid growing media
showing different result.
Study of optimized chemical characteristics
of spinach
References
Numerical0multiresponse
optimization
technique was carried out for the quality
parameters of spinach. To perform this
operation, Design expert version 9.0.2.0 of
Anonymous
AOAC (1984) Official Methods of Analysis.
14 th Ed. Edited by Sidney Williums.
Published by the Association of Official
167
Int.J.Curr.Microbiol.App.Sci (2018) 7(3): 159-168
Analysis Chemists, Inc. Arlinton,
Virginia, 22209, USA
Dalrymple D.G. (1973). A global review of
greenhouse food production. USDA
Rpt. 89.
Hameed B. H., Tan IAW, and Ahmad A. L.
(2008). Preparation of activated carbon
from coconut husk: Optimization study
on removal of 2, 4, 6-trichlorophenol
using response surface methodology.
Journal of Hazardous Materials, 153.
pp. 709–717.
Kwaghger A., Kucha E. I., and Iortyer H. A.,
(2012). Optimization of conditions for
the preparation of activated carbon from
mango nuts using CaCl2. International
Journal of Environment and Bioenergy,
1(3). pp. 146-161.
Montgomery D.C. (2001). Design and
analysis of experiments, 5th ed. John
Wiley and Sons, New York, USA.
Snedecor G. W. and Cochran W. G., (1967)
Statistical Methods, 6th ed. Iowa State
University Press: Ames.
How to cite this article:
Sanjivani C. Karne, Suchita V. Gupta, Bhagyashree N. Patil and Amrapali A. Aakhre. 2018.
Effect of Different Colour of Shadenet and Growing Media on the Quality Parameters and
Yield of Spinach Cultivated by Hydroponics. Int.J.Curr.Microbiol.App.Sci. 7(03): 159-168.
doi: />
168