Farms, family farms, farmland distribution and farm labour: What do we know today?
Bạn đang xem bản rút gọn của tài liệu. Xem và tải ngay bản đầy đủ của tài liệu tại đây (2.39 MB, 80 trang )
November 2019
ISSN 2521-1838
FAO AGRICULTURAL DEVELOPMENT ECONOMICS
WORKING PAPER 19-08
z
Farms, family farms,
farmland distribution
and farm labour:
What do we know today?
Farms, family farms,
farmland distribution
and farm labour:
What do we know today?
Sarah K. Lowder, Marco V. Sánchez and Raffaele Bertini
Food and Agriculture Organization of the United Nations
Rome, 2019
Required citation:
Lowder, S.K., Sánchez, M.V. & Bertini, R. 2019. Farms, family farms, farmland distribution and farm labour: What do we
know today? FAO Agricultural Development Economics Working Paper 19-08. Rome, FAO.
The designations employed and the presentation of material in this information product do not imply the expression of any
opinion whatsoever on the part of the Food and Agriculture Organization of the United Nations (FAO) concerning the legal or
development status of any country, territory, city or area or of its authorities, or concerning the delimitation of its frontiers or
boundaries. The mention of specific companies or products of manufacturers, whether or not these have been patented, does
not imply that these have been endorsed or recommended by FAO in preference to others of a similar nature that are not
mentioned.
The views expressed in this information product are those of the author(s) and do not necessarily reflect the views or policies
of FAO.
ISBN 978-92-5-131970-3
© FAO, 2019
Some rights reserved. This work is made available under the Creative Commons Attribution-NonCommercial-ShareAlike
3.0 IGO licence (CC BY-NC-SA 3.0 IGO; />Under the terms of this licence, this work may be copied, redistributed and adapted for non-commercial purposes, provided that
the work is appropriately cited. In any use of this work, there should be no suggestion that FAO endorses any specific
organization, products or services. The use of the FAO logo is not permitted. If the work is adapted, then it must be licensed
under the same or equivalent Creative Commons license. If a translation of this work is created, it must include the following
disclaimer along with the required citation: “This translation was not created by the Food and Agriculture Organization of the
United Nations (FAO). FAO is not responsible for the content or accuracy of this translation. The original [Language] edition
shall be the authoritative edition.
Any mediation relating to disputes arising under the licence shall be conducted in accordance with the Arbitration Rules of the
United Nations Commission on International Trade Law (UNCITRAL) as at present in force.
Third-party materials. Users wishing to reuse material from this work that is attributed to a third party, such as tables, figures
or images, are responsible for determining whether permission is needed for that reuse and for obtaining permission from the
copyright holder. The risk of claims resulting from infringement of any third-party-owned component in the work rests solely with
the user.
Sales, rights and licensing. FAO information products are available on the FAO website (www.fao.org/publications)
and can be purchased through Requests for commercial use should be submitted via:
www.fao.org/contact-us/licence-request. Queries regarding rights and licensing should be submitted to:
Contents
Abstract .............................................................................................................................. v
Acknowledgements ........................................................................................................... vi
1
Introduction .................................................................................................................1
2
Data sources and definitions.......................................................................................2
3
Number of farms and their location .............................................................................4
4
Distribution of farms and farmland area by land size class.........................................6
5
Getting concepts and accounting on family vs. small farms right .............................11
6
Farmland distribution and farm size over time: is farmland becoming increasingly
concentrated among large farms? ............................................................................16
7
Snapshot of who works on farms ..............................................................................29
8
Conclusion, policy implications and recommendations.............................................32
References.......................................................................................................................34
Annex ...............................................................................................................................44
iii
Tables
Table 1.
Table 2.
Published literature on the change in average or median farm size and
farmland distribution worldwide, 2010–2014 ..................................................... 17
Additional literature on average or median farm size, 2013–2016 .................... 18
Table 3.
Table 4.
Table 5.
Trends in average farm size by income and regional group, 1960–2010 ......... 24
Average farm size by region, 1960–2010.......................................................... 26
Average farm size by income group, 1960–2010 .............................................. 27
Table 6.
Table 7.
Table 8.
Age of agricultural holder in Botswana .............................................................. 30
Age of agricultural holder in Panama and Peru................................................. 30
Age of agricultural holder in Myanmar and the Philippines ............................... 31
Table A1. Number of farms, by country, most recent census ............................................ 44
Table A2. Number and area of farms by land size class, worldwide, regionally and
by income group ................................................................................................ 49
Table A3. Number and area of farms by land size class, 1990, 2000 or 2010 round ........ 51
Table A4. Share of farms and farmland held by an individual or household and use
of household and hired permanent workers on the farm ................................... 60
Table A5. Average farm size and number of farms 1960–2010 ........................................ 63
Table A6. Use of household and hired (temporary and permanent) labour
on the farm ........................................................................................................ 67
Figures
Figure 1.
Share of farms worldwide, by country group, most recent observation............... 5
Figure 2.
Figure 3.
Worldwide distribution of farms and farmland, by land size class ....................... 7
Average distribution of farms and farmland area by land size class and
income group....................................................................................................... 9
Average distribution of farms and farmland area by land size class and
by region............................................................................................................ 10
Family farms and small farms – share of holdings and share of
agricultural area................................................................................................. 14
Share of value of food production from smallholders, by region and
income grouping ................................................................................................ 14
Figure 4.
Figure 5.
Figure 6.
Figure 7.
Farmland distribution over time in Brazil and the United States of America
from the 1970s .................................................................................................. 20
Figure 8.
Figure 9.
Farmland distribution over time in select European countries, 2005–2013....... 21
Farmland distribution over time in Ethiopia, India and the Philippines from
the 1970s........................................................................................................... 23
Figure 10. Average farm size over time, by region 1960–2010 .......................................... 26
Figure 11. Average farm size over time, by income group 1960–2010 .............................. 27
iv
Farms, family farms, farmland distribution and farm labour:
What do we know today?
Sarah K. Lowder1, Marco V. Sánchez2 and Raffaele Bertini3
1
Independent Agricultural Economist based in Washington DC; previously Economist at the
Agricultural Development Economics Division, FAO, Rome.
2
Deputy Director, Agricultural Development Economics Division, FAO, Rome.
3
Economist, Programme Support and Technical Cooperation Department, FAO, Rome.
Abstract
A better and more complete understanding of family farms is urgently needed to guide policy
makers’ efforts towards achieving a number of Sustainable Development Goals (SDGs).
This paper takes stock of the number of farms worldwide, and their distribution and that of
farmland, on the basis of agricultural censuses and survey data. Thus, it shows that
there are more than 608 million farms in the world. Rough estimates also indicate that more
than 90 percent of these farms are family farms (by our definition) occupying around
70–80 percent of farmland and producing about 80 percent of the world’s food in value terms.
We underscore the importance of not referring to family farms and small farms (i.e., those of
less than 2 hectares) interchangeably: the latter account for 84 percent of all farms worldwide,
but operate only around 12 percent of all agricultural land, and produce roughly 36 percent
of the world’s food. The largest 1 percent of farms in the world operate more than 70 percent
of the world’s farmland. The stark differences between family farms, in terms of size,
their share in farmland distribution, and their patterns across income groups and regions,
make clear the importance of properly defining different types of farms and distinguishing
their differences when engaging in policy discourse and decision making towards the SDGs.
The paper also considers evidence on labour and age provided by the censuses. There is a
need to improve agricultural censuses if we want to deepen our understanding of farms.
Support from countries is needed so that a larger number of them supply FAO with microdata,
not just tabulated results. Moreover, additional surveys or survey modules that cover
non-household farms would be extremely useful. For this to happen additional funding is
necessary and FAO’s uniform methodology must be followed.
Keywords: family farm, small farm, farm size, smallholder, farmland distribution, farm labour
and youth in farming
JEL codes: O13, Q10, Q12, Q15, Q24
v
Acknowledgements
This paper was commissioned by the Food and Agriculture Organization of the United Nations
(FAO)’s Agricultural Development Economics Division together with FAO’s Partnerships
Division for use as background information to support the launch of the International Decade
of the Family Farm in May 2019. The authors are grateful for the provision of agricultural census
reports by the Statistics Division of FAO. The paper benefited from useful feedback provided
at an ESA seminar attended by numerous FAO staff members as well as review and written
comments received from Guilherme Brady, Jairo Castaño, Benjamin Davis, Ana Paula De la
O’Campos, Carlos Mielitz, Adriana Neciu and Nicholas Sitko. The authors are also grateful to
Daniela Verona for her editorial and layout support. Views and opinions expressed are those
of the authors and do not necessarily reflect those of the Food and Agriculture Organization of
the United Nations.
Corresponding author:
vi
1 Introduction
Family farms at all scales are critical actors in achieving the Sustainable Development Goals
(SDGs). In low- and middle-income countries, poverty among small farmers, in particular,
is widespread and in many countries it is much higher than the national poverty headcount rate
(Rapsomanikis, 2015). Hence, getting small-family farms out of poverty and ensuring their
access to basic services, ownership and control over land and other forms of property, can be
key to achieving the goals of ending poverty (SDG 1), hunger (SDG 2), and inequality
(SDG 10). Ensuring conditions for family farms more generally, so they can achieve higher
levels of economic productivity through diversification, technological upgrading and innovation,
including through a focus on high-value added and labour-intensive sectors, will also be critical
not only for the aforementioned SDGs but also, inter alia, to achieve economic growth (SDG 8)
and more sustainable production patterns (SDG 12).
The United Nations General Assembly recognized the importance of family farms by designating
2019–2028 as the UN Decade of Family Farming and entrusted the Food and Agriculture
Organization of the United Nations (FAO) and the International Fund for Agricultural
Development (IFAD) with the implementation of the decade. This paper was developed in
preparation for the global launch of the decade on 27–29 May 2019, at the FAO headquarters
in Rome, Italy, specifically to update estimates of, and inform on the number of family farms in
the world. In addition to taking stock on the number of family farms worldwide as well as the
distribution of farms and farmland throughout the world, which is itself and important
contribution, the paper unveils the stark difference between family farms and small farms, and
also provides policy implications and recommendations.
The paper is organized as follows. Section 2 describes the data sources used and provides key
definitions and concepts followed. Section 3 presents the updated estimates of the number
farms and their location, while section 4 describes farm sizes and farmland distribution
worldwide and by region and income grouping. Section 5 provides information on family farms
and clarifies the difference between family and small farms. Section 6 considers changes in
farmland distribution and average farm size over time. Section 7 briefly considers information
on labour and age to provide a snapshot on who works on farms. Conclusions are presented in
Section 8; they include policy implications and improvements to be made to the World Program
for the Census of Agriculture in order to maximize its usefulness to international organizations,
policymakers and researchers in the SDG era.
1
2 Datasourcesanddefinitions
This paper relies mostly on data from agricultural censuses to update the number of farms in
the world and explore patterns around farms size and farmland distribution. FAO has promoted
the Programme for the World Census of Agriculture (WCA) since 1950, by providing
governments with guidance on standard methodology and contents for their agricultural census.
In order to update the number of farms in the world and explore patterns, we used information
from agricultural census reports from 6 different WCA rounds dating back to 1960 and up to the
most recent, 2010 round. Rather than analysing raw agricultural census data, which are
generally stored at the country level, we rely on the tabulated data as provided to FAO via
agricultural census reports. We recorded the most recent estimate of the number of farms,
farmland distribution, and information on labour and age for each country or territory for which
an agricultural census has been carried out and for which a report was available. By mostly
using agricultural censuses, we ensure the broadest coverage of farms and farmland worldwide
(see Table A1 in the Annex for more details).
Agricultural holdings and agricultural area reported by the censuses generally include crop and
livestock production only; holdings engaged in forestry or fisheries are only included if they are
also engaged in crop and livestock production. Communal lands are generally not included in
the agricultural census. The exclusion of forests and communal lands means that the farm sizes
are smaller than they would be were forests and communal lands included.
We use FAO’s definition of an agricultural holding or farms, namely: “an economic unit of
agricultural production under single management comprising all livestock kept and all land used
fully or partly for agricultural production purposes, without regard to title, legal form, or size.
Single management may be exercised by an individual or household, jointly by two or more
individuals or households, by a clan or tribe, or by a juridical person such as a corporation,
cooperative or government agency” (FAO, 2005).
We use the terms agricultural holding and farm interchangeably – mostly making use of the
latter in this paper. The agricultural holder or farmer is the person who makes strategic decisions
regarding the use of the farm resources and who bears all risks associated with the farm.
The agricultural holder may undertake all management responsibilities or delegate day-to-day
work management responsibilities to a hired manager. The difference between the hired
manager and the agricultural holder (the manager of the holding) is that the former is a hired
employee who implements the decisions of the agricultural holder, whereas the latter makes all
strategic decisions, takes all economic risks and has control over all production resulting from
the agricultural holding or farm (FAO, 2005).
As with any source of information, agricultural census reports and the censuses themselves
present limitations. By relying on agricultural census reports rather than raw agricultural census
data, we are limited to considering only the information that is presented in the report and we
may only consider it as it has been tabulated by the authors of the report. Furthermore,
the censuses themselves present limitations. For instance, FAO recommends that censuses
should consider farms of all types throughout a country and be conducted by using complete
enumeration and/or sampling methods. Despite this recommendation, some agricultural
censuses survey farms that are associated with a household (household farms) rather than all
farms, thus excluding corporate entities and government holdings. This is true, for instance, in
the 2010 round for many African countries, including the Federal Democratic Republic of
2
Ethiopia, the Republic of Malawi and the Republic of Rwanda (Lowder, Skoet and Raney, 2016).
To the extent that this is the case, our estimates of average farm size are biased downward.
A few African countries have not conducted an agricultural census since the 1980 round or
earlier. In these cases, we also used data from Living Standards Measurement Study (LSMS)
surveys and Demographic Household Surveys (DHS) in order to have a more recent estimate
of the number of farms. The limitation in this case is that this estimate includes farms associated
with a household only – such that our estimates of average farm size are, as in the case of the
census-based estimates, also biased downward.
LSMS surveys are the result of a decades-long collaboration between the World Bank and
National Governments. A comprehensive description of LSMS data and survey design is beyond
the scope of this paper.1 For the Federal Republic of Nigeria, LSMS estimates of agricultural
households are used as a proxy for the number of agricultural holdings or farms in those countries.
For Nigeria, we also used LSMS data to estimate agricultural land distribution among households.
The land variable is a self-reported estimate of agricultural land cultivated for crops or livestock
use. Agricultural land is land cultivated and owned, excluding land rented out but including land
rented or sharecropped in. Fallow land is included. For the Republic of Kenya a household survey
is likewise used.
For the Republic of Burundi, the Republic of Ghana and the Republic of Zimbabwe, we use
Demographic and Health Surveys (DHS) administered by the United States Agency for
International Development (USAID) and its partner organizations, in order to obtain the number
of agricultural households as a proxy to estimate the number of farms in those countries.
Since 1984, USAID has implemented the DHS which are nationally representative household
surveys on various health-related concerns in over 70 developing countries throughout the world
(USAID, 2006). In the mid-2000s, questions on ownership of agricultural land were introduced in
some of these surveys to understand if any member of the household owned agricultural land and
by how many hectares.2 Moreover, the DHS data are useful for compiling the share of the
population that is involved in agriculture as well as average household size or the number of
members of the household. By combining this information with population statistics from
FAOSTAT database, we created rough expansion factors that allowed us to estimate the number
of households owning agricultural land as well as the total agricultural land in the three countries.
For more detailed information about LSMS surveys readers are referred to World Bank (2019).
In this case, agricultural land refers to what the DHS interviewer’s manual stipulates: “Agricultural land refers
to land that is used for growing crops (the crops may be food for people, food for animals, or other non-food
crops), raising animals, and grazing animals. In answering this question, common land used to graze animals
but not owned by the household should not be included” (USAID, 2012).
1
2
3
3 Numberoffarmsandtheirlocation
Nagayets (2005) used agricultural census data from FAO to estimate that there are about
525 million farms of all sizes in the world. Hazell et al. (2010) and IFAD (2011) used similar data
to maintain that there are about 500 million small farms (those with less than 2 hectares).
The latest estimate by FAO (2014) points to more than 570 million farms worldwide.3 From a
methodological point of view, our updated estimate can be compared with the 2014 FAO
estimate. It is likely the number of farms has increased, but our updated estimate also reflects
a more comprehensive review and use of information.
3.1 Numberoffarmsintheworld
We estimate that the total number of farms in the world is 608 million, which is above previous
estimates (Table A1 in the Annex). For numerous reasons, we may expect that the actual
number of farms in the world is larger than our 608 million estimate. We report estimates of the
number of farms in 179 countries and territories; about 30 countries or territories were lacking
an agricultural census that reports the number of farms; including estimates from those
countries would, of course, increase the total. Secondly, many of the estimates of number of
farms for low- and middle-income countries are from outdated agricultural census rounds.
For example, the last census for Brunei Darussalam was conducted in the 1960 round and for
the Republic of Angola, the Republic of Cameroon, the Republic of Chad, the Dominican
Republic, the Gabonese Republic, the Republic of Iraq, the Republic of Liberia and the Republic
of Singapore the most recent census was conducted with the 1970 round. Thirdly, as further
explained below, average farm size has shrunk while the number of farms worldwide has moved
in the opposite direction from 1961 to 2010, largely due to increases in the number of farms in
low- and middle-income countries, which represent the vast majority of farms worldwide. Lastly,
as noted, for many countries, the estimated number of holdings is limited to the number of
household farms, with non-household farms being outside of the sample frame; again, this
means that our estimate is biased downward. For these reasons we may conclude that there
are now more than 608 million farms worldwide.
Farm sizes and the total number of farms change greatly over time as a result of population
growth, agricultural development, land policies and other socio-economic and climatic factors.
We might expect that in some countries the number of farms in past decades has little bearing
on the current number of farms in those countries. Regardless, this is the most complete
estimate available, and the vast majority of farms were reported from more recent agricultural
census rounds (1990, 2000 or 2010).
3.2 Wherearethefarms?
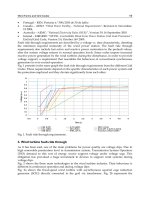
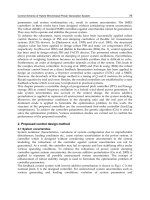
Of the 608 million farms, 43 percent are located in East Asia and the Pacific, including the
People's Republic of China, and 30 percent in South Asia, including the Republic of India
(Figure 1). Many of these farms are in China and India – and this is the reason why they are
presented separately in Figure 1. China alone represents 34 percent and India 24 percent of
the 608 million farms. Twelve percent of the farms are located in sub-Saharan Africa and
3
This same estimate was subsequently reported in Lowder, Skoet and Raney (2016).
4
6 percent in Europe and Central Asia. Only 3 percent of the world’s farms are located in the
Middle East and North Africa.4 Farms in Latin America and the Caribbean represent only
4 percent of farms worldwide.
The majority of farms are located in lower- or upper-middle-income countries, representing,
respectively, 39 and 46 percent of the 608 million figure; this largely results from the
classification of India as belonging to the former group and China to the latter (Figure 1).
Thirteen percent of farms are located in low-income countries. Farms in high-income countries
represent 2 percent of the world’s farms.
Figure 1. Share of farms worldwide, by country group, most recent observation
Share of farms, by region
South Asia (6/7)
6%
SubSaharan
Africa
(44/47)
12%
Share of farms, by income group
Upper-middleincome (48/54)
11%
Lowincome
(32/36)
13%
China
34%
India
24%
Middle East and
North Africa
(13/13)
3%
Latin America and
the Caribbean
(32/33)
4%
China
35%
Highincome
(48/61)
2%
High-income (48/61)
2%
East Asia and
the Pacific
(18/26)
9%
Europe and
Central Asia
(16/23)
6%
Unclassified (6/7)
0%
India
24%
Lower-middleincome (43/52)
15%
Notes: Number of countries included/number of countries in country grouping is shown in parentheses. Country
income groupings are the same as those used by World Bank, 2011. Seven countries are not classified by the
World Bank income groupings.
Sources: Various from the World Programme for the Census of Agriculture. For Nigeria and Kenya, data are taken
from the World Bank LSMS and a government administered household survey, respectively. For Burundi, Ghana
and Zimbabwe estimates are made using data from DHS surveys. For details see Table A1 in the Annex.
4
For comparative purposes with the estimate in FAO (2014), we used the World Bank classification of countries
by region, hence the use of Middle East and North Africa (MENA).
5
4 Distributionoffarmsandfarmlandareabylandsizeclass
Estimates of farms by farm size class are useful because they give us an idea of the average
size of farms operated by most farmers, while the share of agricultural land by farm size class
gives us an idea of the size of farms upon which the majority of farmland is found. Estimates of
the number of farms by farm size class are fairly widespread, since many countries provide that
information in their agricultural census. It is more difficult to estimate how farmland is distributed
among farms of different sizes, since fewer countries report information on agricultural area by
land size class.
4.1 Distributionworldwide
Here we present the most comprehensive estimate possible of the distribution of farms and
farmland by land size class. We have data on the number of farms by land size class for
129 countries and territories. For all but 15 of these, we also have information on total
agricultural area and agricultural area by land size class. For the 15 countries with missing
information, FAOSTAT estimates of arable land and permanent crops were used to fill the gap
on agricultural area. For those countries, we estimated agricultural area by land size class cohort
by computing the product of the midpoint of that land size class cohort (i.e., 0.5 hectare for the
0 to 1 hectare cohort) and the number of farms in that cohort – ensuring that the resulting total
agricultural area did not exceed total agricultural area in the country.5
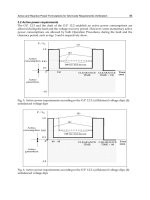
The results show that, worldwide, farms of less than 1 hectare account for 70 percent of all
farms, but operate only 7 percent of all agricultural land (Figure 2). Slightly larger farms between
1 and 2 hectares account for 14 percent of all farms and control 4 percent of the land. Together,
farms of less than 2 hectares account for 84 percent of all farms, but operate only around
12 percent of all agricultural land. Farms in the range of 2 to 5 hectares account for 10 percent
of all farms and control 6 percent of the land. Interestingly, the largest 1 percent of farms in the
world (those larger than 50 hectares) operate more than 70 percent of the world’s farmland.
5
In some cases, the total agricultural area resulting from such estimates exceeded the total agricultural area
in the country. To eliminate such discrepancy, we uniformly reduced the amount of agricultural land in each
land size class cohort until the amount in the largest cohort divided by the number of farms in that cohort was
roughly equal to the midpoint of the largest cohort.
6
Figure 2. Worldwide distribution of farms and farmland, by land size class
Note: Estimates for 129 countries and territories in the world. For details see Tables A2 and A3 in the Annex.
Sources: Authors’ compilation using FAO, 2001; FAO, 2013 and agricultural census reports from the 2010 round
(see "Agricultural census reports and information consulted" in the References section).
Much work by international organizations focuses on increasing the productivity of smallholders,
often defined as those agricultural holders operating areas smaller than 2 hectares. Indeed,
to reduce poverty it is important to improve the productivity of smallholders – or to increase their
income earning, whether on or off-farm. However, to the extent that international organizations
focus on what is happening at the lower end of the distribution, their attention is diverted away
from the state of medium and large scale farms which represent the vast majority of agricultural
land. It would be difficult, if not impossible, to have an unbiased picture of the state of large
scale and corporate agriculture if international organizations continue to focus only on
smallholders and small farms. This would hide important information on all types of farms, which
will also be critical to achieve zero hunger (SDG 2), expose different inequalities to tackle them
(SDG 10), and inform interventions to create a better enabling environment to achieve higher
levels of economic productivity to achieve economic growth (SDG 8) and more sustainable
production patterns (SDG 12).
4.2 Distributionbyincomelevelandregion
To draw the big picture, we look at farmland distribution based on the income level of
123 countries (Figure 3). For nearly all income levels, on average, a large share of farms
(between 40 and 85 percent) are smaller than 2 hectares; they control anywhere from a few
percent to nearly 40 percent of farmland. The farmland share represented by the larger cohorts
would seem to increase with each income category. For example, farms greater than 5 hectares
in size cover 28 percent of the farmland in low-income countries, nearly 40 percent in the
lower-middle-income countries, 85 percent in the upper-middle-income countries and nearly
99 percent in the high-income countries. In short, it would appear that the share of farmland
controlled by larger farms is higher in countries with larger average incomes.
7
We also see that smaller farms operate a far greater share of farmland in lower-income countries
and regions than in higher income countries and regions. In the low- and lower-middle income
countries (which are located primarily in East Asia and the Pacific, South Asia and sub-Saharan
Africa), about 80 percent of farms on average are smaller than 2 hectares, similar to the global
average, and they operate about 30 to 40 percent of land, a much larger share of land than in
other regions. In upper-middle-income countries, which are primarily located in Latin America
and the Caribbean and the Middle East and North Africa, and in high-income countries, only
about 40 to 50 percent of farms are smaller than 2 hectares in size, and they operate less than
5 percent of farmland. This pattern suggests that the share of farmland managed by small farms
decreases as average income levels rise.
The finding that the share of farmland operated by larger farms is larger and that of smaller
farms smaller where average incomes are higher suggests that farmland becomes more
concentrated among larger farms as economies develop.
We now examine regional patterns for all countries other than those classified as high income.
This leaves 84 countries for which we perform regional analysis (Figure 4). In all regions, except
Latin America and the Caribbean, the majority of farms are smaller than 2 hectares.
The distribution of farms and farmland according to farm size seen for the 23 countries located
in sub-Saharan Africa is similar to that of South Asia and East Asia and the Pacific, where about
85 to 95 percent of farms are smaller than 2 hectares and operate 45 to 60 percent of the
farmland; in those regions, few farms reach a size larger than 50 hectares and, the few that do,
comprise only a small share of total farmland. In Latin America and the Caribbean, the pattern
is radically different. Farms smaller than 2 hectares represent only about 35 percent of holdings
and much of the land (about 90 percent) is operated by the 8 percent of farms that are larger
than 50 hectares. In the Middle East and North Africa as well as in Europe and Central Asia,
60 to 70 percent of all farms are smaller than 2 hectares, but more than 50 percent of the land
is farmed by holdings larger than 10 hectares in size. This suggests that farmland seems to be
more unequally distributed in favour of the larger farms in regions of higher per capita income
such as Latin America and the Caribbean, but also Middle East and North Africa, compared with
other regions of low- and middle-income countries. The share of agricultural area farmed by a
clear minority of large farms is increasing over time in some countries, as shall be seen below.
8
Figure 3. Average distribution of farms and farmland area by land size class and
income group
Note: For details see Tables A2 and A3 in the Annex.
Sources: Authors’ compilation using FAO, 2001; FAO, 2013 and agricultural census reports from the 2010 round
(see "Agricultural census reports and information consulted" in the References section).
9
Figure 4. Average distribution of farms and farmland area by land size class and
by region
Note: For details see Tables A2 and A3 in the Annex.
Sources: Authors’ compilation using FAO, 2001; FAO, 2013 and agricultural census reports from the 2010 round
(see "Agricultural census reports and information consulted" in the References section).
10
5 Gettingconceptsandaccountingonfamilyvs.smallfarmsright
Family farms are an important part of the farms analysed above. They figure prominently in the
discourse about agricultural development, and the international community has paid more
attention to them both through the SDGs and the UN Decade of Family Farming. However,
definitions of family farms are still often unclear. At the same time, we often see the mistaken
substitution of the term small farm for family farm which generally leads to the incorrect
suggestion that the majority of the world’s food is produced by small farms. This section intends
to shed light on these concepts and having done that, it provides estimates of farms in their
different dimensions.
5.1 Numberoffamilyfarmsandthelandtheyoperate
While definitions of what a farm is are well established (see, e.g. FAO, 2015), there is no
universally agreed definition of family farms, given the enormous diversity of this group and
depending on the country context. Indeed, every country may have its own definition of what a
family farm is. Various stakeholders have established definitions either for purely analytical
purposes or for the implementation of government programmes, though. The United Nations
Decade of Family Farming 2019-2028. Global Action Plan, developed by FAO and IFAD, applies
the ‘notion of family farming’ referring to all types of family-based production models in
agriculture, fishery forestry, pastoral and aquaculture, and include peasants, indigenous
peoples, traditional communities, fisher folks, mountain farmers, forest users and pastoralists
(FAO and IFAD, 2019).
Despite wide variation among definitions of family farms, there are some commonalities.
A survey of 36 definitions of family farms found that the most common aspect of such definitions
is the use of family labour and that many of the definitions also specify that the farm is managed
by the family (Garner and de la O Campos, 2014). Some definitions limit the size of the farm
explicitly by establishing a maximum land area for the farm, beyond which the farm is no longer
considered a family farm. Finally, a definition may require that the share of household income
from non-farm activities not exceed a certain level.
This paper uses evidence from the 2010 round of agricultural censuses to update estimates
made by FAO (2014) – subsequently reported in Lowder, Skoet and Raney (2016) – of the
number of family farms as well as the share of agricultural land they operate, with the resulting
implications for their contribution to total food and agricultural production. The need to take stock
of the number of family farms at global level by means of a cross country analysis calls for a
single definition. We first consider whether the farm is owned or operated by a family and next
whether the labour is supplied by the family or by hired workers. Some censuses report on the
legal status of the holder of the farm, but the censuses generally do not report on ownership of
the farm. In most of the 49 countries6 for which we have information (FAO, 2013), more than
90 percent of farms (and often close to 100 percent) are held by a single individual, a group of
individuals or a household, either with or without a formal contract; only a very small share of
farms are held by a corporation, cooperative, governmental institution, religious institution, or
an unknown arrangement (Table A4 in the Annex).
6
These countries represent all regions as well as high-income countries; India is included, but China is not and
countries in sub-Saharan Africa are under-represented. Details can be found in Table A4 in the Annex.
11
Several definitions of family farms also require the family to supply the majority of the labour
used on the farm. Data on the use of family and hired labour are quite limited in the censuses.
Sixty countries7 report data on the number of permanent hired workers; for nearly all of these,
the average is very small, far less than 1 hired worker per farm (Table A6 in the Annex). Fourty
five countries8 report data on both family and permanent hired labour; for which the total number
of family members engaged in agriculture exceeded the total number of permanent hired
workers by a median ratio of 10 to 1. In many contexts, seasonal hired workers provide an
important source of labour for farms, but data on seasonal hired workers are available only from
very few agricultural censuses.
Therefore, in the absence of more information for such a type of cross country analysis,
we conclude that family labour exceeds hired labour on the vast majority of farms (Table A4 in
the Annex). We use this information (that most labour is provided by the family in most
countries), together with our estimate of the total number of farms worldwide, to provide a rough
estimate of the total number of family farms worldwide. We assume that, as was the case for
our 49 country sample (for which there is report on ownership of the farm), at least 90 percent
of the world’s more than 608 million farms are held by an individual, small group of individuals,
or a household. This leads us to estimate that, considering our sample of 45 countries (whose
reports include data on both family and permanent hired labour), there are more than 550 million
family farms worldwide. Due to data limitations, the estimate of more than 550 million family
farms worldwide should be considered a rough approximation.
Information on how farmland is distributed among family and non-family farms is limited. However,
for a subset of 53 countries for which data are available, the unweighted average share of total
agricultural land operated by farms which we have classified as family farms is 73 percent.
Calculating a weighted average (using the amount of agricultural land in each of the 53 countries
as a weight), we find that 78 percent of the land is actually operated by family farms.
5.2 Familyfarmsvssmallfarms:adistinctionthatmustnotbeignored
One of the key contributions of this paper is the distinction we are able to make between family
farms and small farms, and the clarity this lends to our understanding of how much each may
contribute to the world’s food production. Most small farms are family farms, but not all family
farms are small.
We have already defined family farms. Following a convention used by many researchers
(see, for example, Hazell et al., 2010; HLPE, 2013; IFAD, 2011; Wiggins, Kirsten and Lambi,
2010), we define small farms as those agricultural holdings that encompass fewer than
2 hectares of farmland.
FAO (2014) showed that family farms (not small farms) produce more than 80 percent of food
in the world. Graeub et al. (2016) provide an estimate that 53 percent of the world’s food is
produced by family farms, with family farms being defined on a country-specific basis, with
country-specific size limitations imposed. Herrero et al. (2017) combined farmland distribution
data from Lowder, Skoet and Raney (2016) with crowd sourcing and satellite imagery to show
7
These countries include many high-income countries as well as most of East Asia; they are underrepresentative of South Asia and sub-Saharan Africa. Details can be found in Table A6 in the Annex.
8
Countries from all regions are represented, with the exception of South Asia and only two countries in
sub-Saharan Africa are represented. See Table A6 in the Annex for details.
12
that farms smaller than 2 hectares produce about 30 percent of most food commodities in subSaharan Africa, Southeast Asia and South Asia. At the global level, between 10 and 35 percent
of food categories (these include vegetables, sugar crops, roots and tubers, pulses, oil crops,
livestock, fruit, fibre and cereals) are produced by farms smaller than 2 hectares.
As has been noted, we estimate that more than 90 percent of farms are run by an individual or
a family and rely primarily on family labour, and they are regarded as family farms (Figure 5).
Such family farms occupy around 70–80 percent of farmland. Here we estimate the share of
food produced by family farms using the approach taken in FAO (2014). In order to approximate
the share of food produced by family farms irrespective of their size, we use the share of land
they operate as a rough proxy for their share of the value of food production. Land is, of course,
not the only determinant of agricultural production, but it is an important one of many others,
including capital, labour, and research and development. In Latin America, for instance,
agricultural research and development has been a big determinant of productivity gains and
therefore gains in agricultural production (OECD and FAO, 2019).
Using the value of food production in 2015 at the country level, and multiplying this by the share
of land operated by family farms, we find that the weighted average across countries is
77 percent (out of a sample of 53 countries). Based on this, we conclude that family farms
produce about 80 percent of the world’s food in value terms (Figure 5). This would imply that
family farms, as defined here, are likely to be responsible for the majority of the world’s
agricultural and food production. However, family farms, as defined in this paper, are a diverse
group which includes farms of all sizes. In designing policies for agricultural development, it is
necessary to distinguish among different types of family farms.
We also saw that worldwide, farms of less than 2 hectares account for approximately 84 percent
of all farms and operate about 12 percent of all agricultural land (Figure 2). To make a rough
estimate of the share of food produced by farms smaller than 2 hectares, or small farms,
for each country (out of a sample of 112 countries), we multiplied the share of land operated by
these farms by the value of food production in 2015. We then looked at the sum across countries
to obtain the worldwide average (weighted by the value of food production), which points to
roughly 36 percent of the world’s food being produced by small farms. Considering this estimate
and that suggesting that small farms use only 12 percent of the world’s agricultural land may be
indication of how very productive they are – but generating more concrete evidence on this goes
beyond the scope of this paper. We also see that the share of food produced by small farms
varies widely across and within income and regional groupings (Figure 6); it is larger in
developing regions than in high-income countries. It is the largest in East Asia and the Pacific,
South Asia and sub-Saharan Africa without Nigeria.
13
Figure 5. Family farms and small farms – share of holdings and share of
agricultural area
Family farms vs. small farms
100
80
60
40
20
0
Family farms
Share of farms
Small farms (less than 2 ha)
Share of agricultural area
Share of food production
Sources: Authors’ compilation using FAO, 2001; FAO, 2013 and agricultural census reports from the 2010 round
(see "Agricultural census reports and information consulted" in the References section). Value of food production is
from FAO, 2019a.
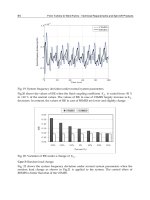
Figure 6. Share of value of food production from smallholders, by region and
income grouping
Share of value of food production from smallholders
All income groups and regions (112)
36%
Low-income (18)
44%
Lower-middle-income (includes India & Nigeria) (25)
41%
Upper-middle-income (includes Brazil & China) (29)
High-income (40)
51%
3%
East Asia and the Pacific without China (9)
44%
China
80%
Europe and Central Asia (11)
8%
Latin America and the Caribbean without Brazil (15)
Brazil
4%
1%
Middle East and North Africa (10)
20%
South Asia without India (6)
40%
India
47%
Sub-Saharan Africa without Nigeria (18)
35%
Nigeria
5%
0% 10% 20% 30% 40% 50% 60% 70% 80% 90%
Sources: Authors’ compilation using FAO, 2001; FAO, 2013 and agricultural census reports from the 2010 round
(see "Agricultural census reports and information consulted" in the References section). Value of food production is
from FAO, 2019a.
14
It is worth acknowledging that these estimates of about 84 percent and 36 percent of the world’s
food being produced by family and small farms, respectively, rely on the oversimplification that
the share of land farmed by a type of farmer in a country determines the share of the food
produced by that farmer type. Regardless of the actual share of food produced by smallholders
and that produced by family farms, we can be relatively confident that smallholders are
responsible for a small share of the world’s food production and family farms are responsible for
much of the world’s food production. This is due to the fact that the majority of land is operated by
family farms of all sizes and a minority of agricultural land is operated by small farms.
This stark contrast makes clear the importance of how we are defining terms and our
distinguishing among the different types of farms when engaging in policy discourse. The
policies needed for the largest farms in the world are most certainly different from those needed
for resource poor and land scarce farms in the developing world. It is imperative that we avoid
the use of the terms family farms and small farms interchangeably. It would be helpful to
distinguish among family farms by farm size.
15
6 Farmlanddistributionandfarmsizeovertime:isfarmland
becomingincreasinglyconcentratedamonglargefarms?
By considering farmland distribution, we learn about the welfare of farmers as well as the
makeup of our food system. In a country where a large share of GDP comes from agriculture
(as opposed to industry or services), and where a large number of very small farms are in
operation, we might imagine that there is a large share of the population engaged in subsistence
agriculture. In such an agricultural economy, an increase in the number of small farms over time
may raise concerns regarding the well-being of smallholder farmers. In countries where large
shares of farmland are found on large farms (on the order of 50 hectares and larger), we might
expect to see more industrial agriculture. An increase in the share of land farmed on large farms
might raise concerns that the food system is becoming increasingly industrial. Numerous factors
underlie such changes and are beyond the scope of this paper. These include land tenure policy,
population density and population growth, the availability of arable land and off farm
employment opportunities, among others (see, for example, Tan et al., 2013; Jayne, Chamberlin
and Headey, 2014; Sitko and Jayne, 2014; Dawe, 2015 and Van Vliet et al., 2015). Changes in
methodology and definitions used from one agricultural census to the next also affect the trends
observed over time. However, our analysis of farmland distribution and farm size over time,
based on the census data, sheds lights on possible transformations of agriculture and food
systems in the world.
6.1 Whattheliteraturetellsus
Lowder, Skoet and Raney (2016) review recent literature (2010–2014) on changes in average
farm size over time (see Table 1) as well as farmland distribution. They summarize the findings
as average farm sizes having increased in the developed world and decreased in the developing
world. Exceptions to this include findings by Jayne, Chamberlin and Headey (2014) that in some
land abundant countries in Africa average farm sizes have increased in recent years, while in
land constrained contexts average farm sizes have decreased. Masters et al. (2013) point to
recent increases in average farm sizes for parts of Asia.
Through their own examination of agricultural census reports, Lowder, Skoet and Raney (2016)
likewise stress the need to nuance the finding of decreasing average farm size in the developing
world. Using data on average farm size for 107 countries, they show that from 1960 to 2000,
average farm size decreased in most low- and lower-middle-income countries and in South Asia
as a whole. Average farm sizes increased from 1960 to 2000 in some upper-middle-income
countries and in nearly all high-income countries considered. They also acknowledge that
although trends in average farm size are unknown for China, recent land policies suggest that
average farm sizes may increase in that country which would certainly affect the regional
average for East Asia and the Pacific.
16
Table 1.
Published literature on the change in average or median farm size and
farmland distribution worldwide, 2010–2014
Author, year
of publication
Data used
Geographical
coverage
Sample
size
Time period
Findings
Eastwood,
Lipton and
Newell, 2010
Agricultural
censuses
Global
—
1930 to
1990 rounds
The log of average farm size increased from 1950
to 1990 in North America and Europe. It decreased
from 1950 to 1990 in Asia and from 1970 to 1990
in Africa. There was no clear long-run trend for
South America.
Hazell et al.,
2010
Agricultural
censuses
Africa,
Asia and
Latin America
16
countries
1970 to
2000 rounds
Median farm size decreased in most countries
considered.
Deininger and
Byerlee, 2012
Literature
review
Selected land
abundant
countries in
Latin America,
Eastern
Europe and
Central Asia,
Southeast
Asia and
sub-Saharan
Africa
—
1970s to
2000s
Farmland distribution: In land abundant countries
of Latin America and Eastern Europe and Central
Asia there has been an increase in large scale
farming. In Southeast Asia the palm oil industry has
seen an increase in the number of larger
plantations or large firms contracting with
outgrowers, but rubber production has shifted from
being cultivated mainly by large plantations to
production by smallholders. In countries of
sub-Saharan Africa efforts to move toward large
scale agriculture in the 1970s and '80s largely failed
and small farming operations have persisted, with
an increase in large scale investments in more
recent years.
FAO, 2013
Agricultural
censuses
Global
114
countries
1930 to
2000 rounds
Average farm size: At the global level (106 country
sample, with the number of countries varying from
year to year) the pooled average of mean farm size
and the median of mean farm sizes decreased from
1930 to 2000. This reflects a decrease in average
farm size for most regions except Europe. For the
African region a decrease in average farm size was
registered from 1960 to 1980 followed by a slight
increase from 1980 onwards. Countries where an
increase rather than decrease was observed
included Australia, New Zealand, the United States
of America, Canada, Argentina and Uruguay.
HLPE, 2013
Agricultural
censuses
Global
81
countries
1930 to
2000 rounds
Average farm size has decreased for the African
region as a whole and it has also decreased in
China.
Masters et al.,
2013
Rural and
urban
population
data
Africa
and Asia
—
1950 to
2050
Since 1950 average farm sizes have been
decreasing for Africa and Asia as a whole, but in
recent years they have begun increasing for Asia
as a whole, while they will continue to decrease in
Africa for quite some time.
Adamopoulos
and
Restuccia,
2014
Agricultural
censuses
Global
63
countries
1990 round
Average farm size is larger in countries with higher
average per capita GDP. Farmland distribution:
In countries with high average incomes farms larger
than 20 ha operate 70 percent of land, while in the
poorest countries 70 percent of land is operated by
farms smaller than 5 hectares.
Jayne,
Chamberlin
and Headey,
2014
Agricultural
censuses/
surveys
Africa
12
countries
1980–2010
round
Africa is typically characterized as land abundant,
but the majority of the region's uncultivated arable
land is concentrated in a few countries. In all landconstrained countries for which data are available,
average farm size has decreased. Most but not all
land abundant African countries have shown an
increase in average farm size.
Notes: "—" indicates data not available.
Source: Adapted from Lowder, Skoet and Raney, 2016.
17