Heritability and genetic advance analysis in rice (Oryza sativa L.) genotypes under aerobic condition
Bạn đang xem bản rút gọn của tài liệu. Xem và tải ngay bản đầy đủ của tài liệu tại đây (273.02 KB, 9 trang )
Int.J.Curr.Microbiol.App.Sci (2020) 9(3): 1196-1204
International Journal of Current Microbiology and Applied Sciences
ISSN: 2319-7706 Volume 9 Number 3 (2020)
Journal homepage:
Original Research Article
/>
Heritability and Genetic Advance Analysis in Rice (Oryza sativa L.)
Genotypes under Aerobic Condition
Nikki Kumari* and M. B. Parmar
Main Rice Research Station, Anand Agricultural University,
Nawagam - 387540, Gujarat, India
*Corresponding author
ABSTRACT
Keywords
1,000-grain weight,
Variability,
Genotypic
Coefficient of
variation,
Heritability
Article Info
Accepted:
05 February 2020
Available Online:
10 March 2020
The experiment was conducted in experimental Farm, Regional Research
Station, Anand Agricultural University from July to November
2018toestimate the extent of variability present in rice genotypes with
respect to yield and its component traits. The estimates of genotypic and
phenotypic variances for the characters like plant height, effective tillers
per plant, number of grains per panicle, grain yield per plant, straw yield
per plant, harvest index and 1000 grain weight, genotypic variance
contributed larger in phenotypic variance. The highest genotypic coefficient
of variation (GCV) and phenotypic coefficient of variation (PCV) were
observed for straw yield per plant (37.84%, 40.21%), followed by harvest
index (24.20%, 29.02%) and grain yield per plant (22.45%, 26.34%). High
heritability coupled with high genetic advance were observed for plant
height, number of grains per panicle and straw yield per plant.
Introduction
Rice (Oryza sativa L.) is the most valuable
crop in the world and the prime staple food of
Asia, for more than 2/3rd of its population.
Rice is the oldest domesticated grain (~10,000
years) and most important primary source of
food for more than three billion people. Rice
cultivated primarily in low land condition
which required almost half of the water
utilized for agricultural production. The
depleting water resource demands others
alternative approaches without compromising
the productivity. Aerobic cultivation of rice is
one of the most promising options among
others such approaches. There are no specific
genotypes available for aerobic cultivation of
rice so breeder should pay attention in this
direction. Genetic variability for agronomic
traits is the main component of any breeding
programs for widening the gene pool. The
efficient use of genetic resources in all plant-
1196
Int.J.Curr.Microbiol.App.Sci (2020) 9(3): 1196-1204
breeding programs requires knowledge about
genetic diversity.
Assessment of genetic variability present in
the population and the extent to which it is
heritable are important factors, to have
effective selection in any breeding program.
Genetic variability is an efficient tool for an
effective choice of parents for hybridization
program. Information about nature and degree
of genetic divergence would help the plant
breeder in choosing the right parents for the
breeding program (Vivekanandan and
Subramanian, 1993).
To boost the yield potential of aerobic rice, it
is necessary to identify cultivars with
improved yield and other desirable agronomic
characters. Burton (1952) and Johnson et al.,
(1955) reported that to arrive at a reliable
conclusion, genetic variability and heritability
should jointly be considered in totality so as
to bring an effective improvement in yield
and in other yield related characters.
Materials and Methods
The experimental material comprised of fifty
selected genetically diverse true breeding
genotypes of rice (Oryza sativa L.) obtained
from different geographical regions. All the
genotypes were grown in randomized block
design with 3 replications under aerobic
conditions in the Kharif season of year 2018.
Each genotype was grown in 2.0 m x 0.9 m
plot with 30 x 10 cm spacing at the Regional
Research Station, Anand Agricultural
University Anand, India. Standard agronomic
practices and plant protection measures were
followed.
Replication-wise data on the basis of five
randomly taken competitive plants were
recorded on following traits: Days to 50 per
cent flowering (DFF), Plant height, Number
of grains per panicle, Spikelet fertility per
cent, Effective tillers per plant, Grain yield
per plant, Straw yield per plant, Harvest
index, 1000-grain weight, Grain length, Grain
breadth and Grain L/B ratio.
The data recorded for all the characters were
subjected to analysis of variance with the
formula suggested by Panse and Sukhatme
(1978). Further, Different components of
variance viz., phenotypic, genotypic and
environmental variance were estimated and
genetic parameters like genotypic coefficient
of variation (GCV), phenotypic coefficient of
variation (PCV) and heritability in broad
sense and genetic advance as percent of mean
were worked out following appropriate
statistical procedure.
Results and Discussion
Analysis of variance revealed significant
differences among the different genotypes for
all the 12 characters like days to 50 per cent
flowering (DFF), plant height, effective tillers
per plant, number of grains per panicle,
spikelet fertility per cent, grain yield per
plant, straw yield per plant, harvest index,
1000-grain weight, grain length, grain breadth
and grain L/B ratio (Table 2), which clearly
suggested the existence of sufficient amount
of variability in the experimental material.
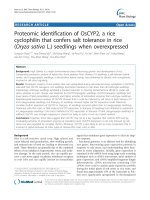
The estimates of genotypic and phenotypic
variances revealed that for the characters like
plant height, effective tillers per plant,
number of grains per panicle, grain yield per
plant, straw yield per plant, harvest index and
1000 grain weight, genotypic variance
contributed larger in phenotypic variance,
which
indicated
less
influence
of
environmental factors on the expression of
these characters.
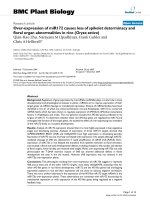
The phenotypic (Vp) and genotypic(Vg)
coefficient of variation were obtained for
different characters (Table 3). The highest
genotypic coefficient of variation (GCV) and
1197
Int.J.Curr.Microbiol.App.Sci (2020) 9(3): 1196-1204
phenotypic coefficient of variation (PCV)
were observed for straw yield per plant
(37.84%, 40.21%), followed by harvest index
(24.20%, 29.02%) and grain yield per plant
(22.45%, 26.34%).High GCV values with
marginally high PCV values indicated that
inter-accession variations were high and that
the expression of these characters was less
influenced by the environment factor and low
differences between GCV and PCV value
revealed sufficient variability in the
population under investigations. These results
are akin to the findings of Khan et al., (2009),
Akinwale et al., (2011) and Ketan and Sarkar
(2015).
Knowledge on the heritability is very much
important to a plant breeder since it indicates
the possibility and extent to which
improvement is possible through selection.
Burton (1952) suggested that genotypic coefficient of variation along with heritability
estimates would provide a better picture of
genetic gain expected through phenotypic
selection. The relative amount of heritable
portion was assessed in the present study with
the help of estimates of broad sense
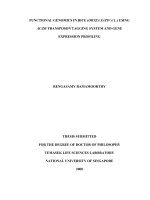
heritability. The heritability estimates were
very high for 1000 grain weight (90.20%) the
results were in correspondence to the findings
of Karim et al., (2007) and Osman et al.,
(2012); moderately high for plant height
(84.90%), effective tillers per plant (85.20%),
number of grains per panicle (85.90%), grain
yield per plant (72.70%), straw yield per plant
(88.60%) and harvest index (69.50%), Similar
results were also reported by Khan et al.,
(2009), Pandey et al., (2009) and Akinwale et
al., (2011) and moderate heritability estimates
were found for days to 50 per cent flowering
(39.50%) and spikelet fertility (41.40). The
heritability estimates were very low for grain
L/B ratio (27.27%), grain breadth (20%) and
grain length (14.70), similar results were
reported by Patel et al., (2018) while Ketan
and Sarkar (2014) reported only low genetic
advance as per cent of mean for grain length.
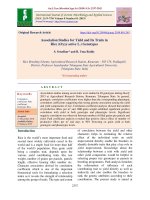
The heritability estimates along with genetic
advance are more useful than the former alone
in predicting the best performing individuals.
Genetic gain gives an indication of expected
genetic progress for a particular trait under
suitable selection procedure. High heritability
coupled with high genetic advance as per cent
of mean were observed for effective tillers per
plant (35.94%), plant height (28.39%),
number of grains per panicle (37.11%), grain
yield per plant (39.31%), 1000 grain weight
(33.66%), harvest index (41.56%) and straw
yield per plant (74.77%), Similar results had
also been reported by Akinwale et al., (2011)
and Ketan and Sarkar (2014), which indicated
better scope of their improvement through
selection, as these characters were
predominantly governed by additive genetic
variance. Low genetic advance as per cent of
mean coupled withlow estimates of
heritability were observed for days to 50 per
cent flowering, grain L/B ratio, grain breadth
and grain length, the results indicated
involvement of non-additive gene effect for
expression of these trait and hence, population
improvement approach would be most
effective for improvement of these characters.
These findings are in conformity with Patel et
al., (2018), while Ketan and Sarkar (2014)
reported only low genetic advance as per cent
of mean for grain length.
On the basis of all the above findings, it can
be concluded that, while imposing selection
for genetic improvement of grain yield in rice
under aerobic condition, due weightage
should be given to effective tillers per plant,
plant height, number of grains per panicle,
grain yield per plant, 1000 grain weight,
harvest index and straw yield per plant.
Presence of sufficient variability in the
characters studied offer possibilities to
explore the material for further genetic
improvement program to widen the genetic
background of various rice genotypes.
1198
Int.J.Curr.Microbiol.App.Sci (2020) 9(3): 1196-1204
Table.1 Analysis of variance for different characters in rice
Sr.
No.
Character
Degree of freedom
Mean sum of square
Replication
Genotype
Error
02
49
98
4.120
31.010*
10.474
348.930
651.469*
36.481
1.320
7.596*
0.414
1
Day to 50 per cent flowering
2
Plant height
3
Effective tillers per plant
4
Number of grains per panicle
201.500
1320.143*
68.459
5
Spikelet fertility (%)
15.370
73.798*
23.639
6
Grain yield per plant
14.460
31.612*
3.522
7
Straw yield per plant
340.950
932.050*
38.504
8
Harvest index (%)
22.070
119.594*
15.246
9
1000 grain weight
0.810
44.981*
1.570
10
Grain length
0.004
0.424*
0.279
11
Grain breadth
0.033
0.084*
0.048
12
Grain L/B ratio
0.078
0.256*
0.119
Note: * indicate significant at 5% level
1199
Int.J.Curr.Microbiol.App.Sci (2020) 9(3): 1196-1204
Table.2 The estimate of genotypic and phenotypic variances and other genetic parameters for different characters in rice
Sr.
No.
Character
1
Days to 50 per cent flowering
2
Plant height
3
Effective tillers per plant
4
No. of grains per panicle
5
2
g
2
GCV
(%)
PCV
(%)
17.32
3.65
204.99 241.47
σ
σ
p
GA
(%)
5.81
(%)
39.50
4.73
14.96
16.23
84.90
28.39
18.89
20.46
85.20
35.94
417.23 485.68
19.44
20.97
85.90
37.11
Spikelet fertility (%)
16.72
40.35
4.41
6.86
41.40
5.84
6
Grain yield per plant
9.36
12.88
22.45
26.34
72.70
39.31
7
Straw yield per plant
297.85 336.35
37.84
40.21
88.60
74.77
8
Harvest index
34.78
50.02
24.20
29.02
69.50
41.56
9
1000 grain weight
14.47
16.04
17.21
18.12
90.20
33.66
10
Grain length
0.048
0.327
2.39
6.21
14.70
1.84
11
Grain breadth
0.012
0.060
4.17
9.41
20.00
3.81
12
Grain L/B ratio
0.045
0.165
6.01
11.48
27.27
6.44
6.85
2.39
1200
2.80
Int.J.Curr.Microbiol.App.Sci (2020) 9(3): 1196-1204
Fig.2.1 Graphical representation of genotypic and phenotypic variance
1201
Int.J.Curr.Microbiol.App.Sci (2020) 9(3): 1196-1204
Fig.3.1 Graphical representation of genotypic and phenotypic coefficient variation
1202
Int.J.Curr.Microbiol.App.Sci (2020) 9(3): 1196-1204
Fig.3.2 Graphical representation of broad sense heritability and genetic advance as per cent mean
1203
Int.J.Curr.Microbiol.App.Sci (2020) 9(3): 1196-1204
References
Akinwale, M. G., Gregorio, G., Nwilene, F.,
Akinyele, B. O., Ogunbayo, S. A. and
Odiyi, A. C. (2011). Heritability and
correlation coefficient analysis for yield
and its components in rice (Oryza sativa
L.). Afric. J. Plant Science, 5 (3), 207212.
Allard, R. W. (1960). Principles of Plant
Breeding. Published by John Willey and
sons, Inc., New York.
Burton, G. W. (1952). Quantitative
inheritance in grasses. In Proceedings of
the 6thInt. Grass. Cong., (1), 277-283.
Chang, T. T. and Luh, B. S. (1980). Overview
and prospects of rice production. In.
Rice Springer, Boston, MA., 1-11.
Jayasudha, S and Deepak, S. (2010). Genetic
parameters of variability, correlation
and path-coefficient for grain yield and
physiological traits in rice (Oryza sativa
L.) under shallow lowland situation.
Elect. J. Pt. Breeding, 1 (5), 1332-1338.
Johnson, H. W. Robinson, H. F. and
Comstock, R. I. (1955). Estimates of
genetics and environmental variability
in soybean. Agron. J., 47, 314-318.
Karim, D., Sarkar, U., Siddique, M. N. A.,
Miah, M. K. and Hasnat, M. Z. (2007).
Variability and genetic parameter
analysis in aromatic rice. Int. J. Sustain.
Crop Prod., 2 (5), 15-18.
Ketan, R. and Sarkar, G. (2014). Studies on
variability, heritability, genetic advance
and path analysis in some indigenous
aman rice (Oryza sativa L.). J. Crop
and Weed., 10 (2), 308-315.
Khan, A. S., Muhammad, I. and Muhammad,
A. (2009). Estimation of genetic
variability and correlation for grain
yield components in rice (Oryza sativa
L.). American-Eurasian J. Agri. and
Env. Sci., 6 (5), 585-590.
Kumar, S., Singh, D., Satyendra, A. S., Kant,
S., Kumar, A., Pal, K. and Kumar, M.
(2012). Variability, heritability and
genetic advance in rice (Oiyza sativa L.)
under aerobic condition. Env. and Eco.,
30 (4), 1374-1377.
Osman, K. A., Mustafa, A. M., Ali, F.,
Yonglain, Z. and Fazhan, Q. (2012).
Genetic variability for yield and related
attributes of upland rice genotypes in
semi arid zone (Sudan). Afri. J. Agri.
Res., 7 (33), 4613-4619.
Pandey, P., Anurag, P. J., Tiwari, D. K.,
Yadav, S. K. and Kumar, B. (2009).
Genetic variability, diversity and
association of quantitative traits with
grain yield in rice (Oryza sativa L.). J.
Bio-Science, 17 (1), 77-82.
Panse, V. G. and Sukhatme, P. V. (1967).
Statistical methods for agricultural
workers, published by Indian Council of
Agricultural Research, New Delhi.
Patel, H. R., Patel, V. P., Patel, P. B., Rathod,
A. J. and Pampaniya, A. G. (2018).
Genetic variability, correlation and path
analysis for grain yield and component
traits in f3 segregating population of
rice (Oryza sativa L.). Int. J. Chem.
Stu., 6 (2), 2327-2331.
Vivekanandan, P. and Subramanian, S.
(1993). Genetic divergence in rainfed
rice. Oryza, 30 (1), 60-62.
How to cite this article:
Nikki Kumari and Parmar, M. B. 2020. Heritability and Genetic Advance Analysis in Rice
(Oryza sativa L.) Genotypes under Aerobic Condition. Int.J.Curr.Microbiol.App.Sci. 9(03):
1196-1204. doi: />
1204