Evaluation of resource spatial-temporal variation, dataset validity, infrastructures and zones for Vietnam offshore wind energy
Bạn đang xem bản rút gọn của tài liệu. Xem và tải ngay bản đầy đủ của tài liệu tại đây (3.43 MB, 14 trang )
Doi: 10.31276/VJSTE.62(1).03-16
Mathematics and Computer Science | Computational Science, Physical sciences | Engineering
Evaluation of resource spatial-temporal variation,
dataset validity, infrastructures and zones
for Vietnam offshore wind energy
Vu Dinh Quang1, 2, Van Quang Doan3, Van Nguyen Dinh4, Nguyen Dinh Duc1, 2*
Vietnam Japan University, Vietnam National University, Hanoi, Vietnam
University of Engineering and Technology, Vietnam National University, Hanoi, Vietnam
3
Center for Computational Sciences, University of Tsukuba, Japan
4
MaREI Centre for Marine and Renewable Energy, ERI, University College Cork, Ireland
1
2
Received 15 November 2019; accepted 20 January 2020
Abstract:
Introduction
The shortage of reliable datasets and resource
assessments, resource variations, and lack of marine
planning are the technical challenges facing offshore
wind energy development in Vietnam. This pioneering
paper comprehensively addresses these challenges
by first screening available datasets to select crosscalibrated multi-platform (CCMP) data and validating
them with measurements. The resource is divided into
four zones of 100 NM-width from the coastline. The
wind energy density (WED) and capacity factor (CF)
are calculated using an 8 MW reference turbine. The
assessment of the zoned resource and infrastructures
is based on the location of synchronous power sources
and ports, along with the variation of WED and CF.
Zone 3, comprising of the Binh Thuan and Ninh Thuan
seas, the southern part of Zone 2 (Phu Yen and Khanh
Hoa), and the northern part of Zone 4 (Ba Ria and
Vung Tau) are found to have the highest wind energy
potential, where the annual accumulated WED is 80
GWh/km2. The five year CF and average wind speed in
Phu Quy island were 54.5% and 11 m/s, respectively.
These zones, with moderate resource variation and
excellent ports are the most suitable for offshore wind
energy development. Zones 1 and 4 are recommended
for far-offshore wind farms. This work is useful to
various environmental groups and is a crucial input to
marine and power planning.
Countries around the world are facing the problems of
environmental pollution and energy security and renewable
energy emerges as an optimal method to solve those problems
[1]. The use of wind energy has had positive impacts on society
and the environment, including the reduction of greenhouse gas
emissions, job opportunities, and the promotion of sustainable
development [2]. Offshore wind power productivity can be 1.5
times that of onshore plants because offshore wind speeds are
greater and more stable [3]. In addition to providing electricity
to the grid, offshore wind power plants can help improve the
quality of life in island areas far from the shore [4] and potentially
supply power to gas for renewable fuels [2].
Keywords: CCMP data, marine and power planning,
offshore wind energy, ports, spatial and temporal
variation, Vietnam sea.
Classification numbers: 1.3, 2.3
Resulting from rapid economic development, the energy
demands made by the industrial, transportation, commercial,
and residential sectors of Vietnam have significantly increased
and most of the country’s electricity is generated by hydropower
and fossil fuel power until now [5]. However, recently there
has been an exhaustion of sites for hydropower plants and a
revelation of negative impacts caused by hydropower to the
local environment and ecology [6]. From the latest national
Power Development Plan (PDP) in Vietnam [7, 8], so-called the
“Adjusted PDP VII” that projects into 2030, coal-fired power is
expected to grow strongly from a share of 33% (12.9 GW) in
2015 to 43% (55.1 GW) in 2030, which is abnormally high. The
share of renewable energy (excluding large hydropower plants)
installed capacity will be 9.9% in 2020 (1% from wind) and 21%
(5% from wind) in 2030, which is very low in comparison with
the country’s potential.
The exploitation of renewable energy sources seems to be
the only way to reduce the large share of coal-fired power in
Vietnam. The country is likely to have a huge opportunity for
developing offshore wind energy [9] because of its more than
3,000 km of coastline and 1 million km2 sea area. Vietnam
offshore wind is seated in the top ten of global potential markets,
*Corresponding author: Email:
March 2020 • Vol.62 Number 1
Vietnam Journal of Science,
Technology and Engineering
3
Mathematics and Computer Science | Computational Science, Physical sciences | Engineering
as reported by the Global Wind Energy Council [10]. However,
besides political impetus [11], there are a number of major
domestic technical obstacles to offshore wind policymakers
and developers in Vietnam. The first two obstacles are (i) the
shortage of reliable offshore wind, metocean, and seabed data
sets and (ii) the severe lack of a comprehensive assessment of
offshore wind resources and infrastructures.
Doan, et al. [12] made the first attempt to simulate the
offshore wind over an area limited to southern Vietnam using a
numerical simulation model, however, it was without validation
of the simulated wind data. A second and more complete attempt
was made with the recent use of numerical simulations validated
by two sets of wind data obtained from (i) six ground-based
weather stations on islands off the coast of Vietnam and (ii)
QuikSCAT (Quick Scatterometer), an Earth observation satellite
with a coarse spatial resolution of 25 km [13]. The absence of upto-date marine planning, where the offshore wind development
zones and foreshore grid connections have never been studied
and designated, is the third major obstacle to offshore wind
policymakers and developers in Vietnam. In a first initiative,
maps of potential offshore wind zones in Vietnam with 30 m and
60 m water-depth contours were proposed [14].
There are many studies that assess wind energy potential
around the world by using data obtained from satellites and wind
observation stations [15]. Such datasets were used in Kirklareli,
Turkey [16], in Turkey [17], and in Tehran, Iran with data from
a period between 1995 and 2005 [18]. Measured data were
utilised to assess the wind energy potential in Malaysia from ten
meteorological stations over ten years [19], in Egypt [20, 21],
and in Oman based on a five-year hourly wind dataset obtained
from weather stations [22]. Statistical methods were used in
Morocco [23, 24] and in Jordan [25] via Weibull distributions.
Not only wind characteristics, but also wind power generation,
was investigated in Jordan [25], Nigeria [26], and Ireland [27].
Offshore wind resources have been accessed by many countries.
Wind speed and rose, energy rose and density, and air density
of a south-western sea area in South Korea were analysed from
meteorological mast data [28]. The potential application of the
hyper-temporal satellite Advanced Scatterometer data for offshore
wind farm site selection in Irish waters was investigated and the
data was validated by in situ measurements from five weather
buoys [29]. Thus, the use of data from satellite observations and
from measurements to assess wind energy potential is widely
accepted. In this work, cross-calibrated multi-platform [30] data
are used after validation with measurement data.
The great challenge behind wind energy is its high
dependence on wind speed that fluctuates greatly at all time
scales, that is, minutes, hours, days, months, seasons, and years
[31]. Understanding the temporal variations of the wind is of
key importance to the integration and optimal utilization of
wind in a power system [32]. Wind power assessment, therefore,
plays a key role in dealing with the stochastic and intermittent
nature of wind and the challenges involved with the planning
4
Vietnam Journal of Science,
Technology and Engineering
and balancing of supply and demand in any electricity system
[32, 33]. Such spatiality in power sources and transmission is
apparent in Vietnam, where renewable generation capacities are
mostly installed in the south and the major demand centres are
in the southern and northern regions [34].
A large geographic spread of installed capacity can reduce
wind power variability and smooth its production. It is essential
to understand the wind power spatiality in order to address power
system constraints in systems with large and growing wind
power penetrations [35]. The spatial and temporal correlation of
wind power across ten European Union countries was examined
from three years of hourly wind power generation data [35]. A
spatial analysis of offshore wind resources in Africa revealed
that more than 90% of the resources are concentrated in coastal
zones associated with three African power pools and suggested
that a joint and integrated development within these power pools
could offer a promising approach to utilising offshore wind
energy in Africa [36].
The major challenges to government and national marine
authorities are how to manage the planning, consent, installation,
and operation of offshore wind projects and how to integrate
those activities effectively into other activities and strategies
such as natural/cultural heritage site designations, military/
aviation, shipping, fishing, and ports or harbour restrictions [2].
In this context, marine spatial planning (MSP) is a new way of
looking at how the marine area is used and preparation of how
best to use it in the future [37]. The increasing number of uses
and users of the ocean leads to more conflicts, whereas zoning the
ocean in space and time has been shown to reduce these conflicts
[38]. Additionally, planned use of the marine environment can
minimise losses and maximise gains for conflicting sectors
[39]. Such lessons can be learned from the Great Barrier Reef
Marine Park (GBRMP) [40] and the ongoing MSP development
in Europe.
In an objective summary, this paper aims at addressing the
number of technical challenges to the development of offshore
wind in Vietnam. The CCMP data validated with measurement
data from seven meteorological stations were the input to
contend with the shortage of reliable wind data. The severe
lack of resource assessment is initially addressed by evaluating
the temporal and spatial variation of offshore wind speed and
directions over seasonal, annual, and inter-annual periods.
Based on the approach of time and space zoning [38], the lessons
learned, expert consultations, temporal variation of temperature,
and the offshore wind resource, the ocean area 100 NM off
the coastline of Vietnam is classified into four zones. Prior to
evaluating the offshore wind resource and infrastructures in this
work, a set of criteria and data including temporal variation in
temperature, synchronous power sources and transmission,
seaport facility, offshore wind power, and density and capacity
factors are discussed. Such validated wind data, infrastructure
data, and the evaluation of resource potential, density, temporal,
and spatial variations will be input for further work by
March 2020 • Vol.62 Number 1
Mathematics and Computer Science | Computational Science, Physical sciences | Engineering
policymakers, energy and marine planners, industry developers,
and researchers. Such initial zoning and zone evaluation will be
crucial, in combination with other sectors, to the development of
MSP and power plan in the country.
deviation of data. The cross-calibrated satellite wind data from
the CCMP dataset contains data from a number of microwave
satellite instruments. These microwave radiometers, such as
the special sensor microwave imager sounder (SSMIS) and
data including temporal variation in temperature, synchronous power sources
and [43], were used to gather information about wind speed.
WindSat
transmission,Methodology
sea port facility, and offshore wind power, density and capacity factors
are
Microwave
scatterometers, such as QuikScat and SeaWinds,
discussed. Such validated wind data, infrastructure data, and the evaluation of resource
were
also
applied
to obtain wind speed and directions by the
The
this variations
paper is depicted
in Fig.
1. The
potential, density
andmethodology
temporal and of
spatial
will be input
further
work by policy
development
of
a
geophysical
model function. Wind velocity is
firstand
step,
afterplanners,
selecting
a dataset,
is to validate
the dataset
makers, energy
marine
industry
developers,
and researchers.
Suchby
initial zoning
observed
and
analysed
at
10
meters
above sea level. The spatial
comparing
surface
wind speed probability
distribution
and zone evaluation
willtheir
be input,
in combination
with other sectors,
to thewith
development of
resolution
of
the
dataset
was
0.25
degrees
in latitude and 0.25
MSP and power
plan
the country. data from seven meteorological stations.
that of
theinmeasurement
degrees
in
longitude.
Especially
important,
the dataset has a
If the comparison shows that the dataset is usable, the next step
Methodology
high
temporal
resolution
of
6
h
and
a
timespan
of 25 years,
is to extrapolate the wind speed at different heights and evaluate
The methodology
of
this
paper
is
depicted
in
Fig.
1.
The
first
step,
after
selecting
a
from
02
July
1987
to
31
December
2011,
as
listed
in Table 1.
the temporal and spatial variations of wind speed and direction.
dataset, is to validate the dataset by comparing their surface wind speed probability
Because
the
entire
CCMP
data
over
the
course
of
25
years is
Using that evaluation and zoning criteria, the potential offshore
If the
distribution with that of the measurement data at seven meteorological stations.very
large,
this
study
used
wind
data
from
the
last
five
years
of
is dataset
dividedis into
four
forismarine
and energy
comparison wind
shows area
that the
usable,
thezones
next step
to extrapolate
the wind speed at
the
dataset
(from
2007
to
2011).
The
CCMP
dataset
was
then
planning
management.
The last
steps variations
are to calculate
the speed and
different heights
andand
evaluate
the temporal
andtwo
spatial
of wind
wind that
energy
potential,
distributions,
andwind validated
direction. Using
evaluation
andcapacity
zoning factor,
criteria,power
the potential
offshore
area is by comparison with the observed data from several
meteorological
stations located in Vietnam. The temporal
evaluate
their
andenergy
spatial
variations
each zone.The last two
divided intotoseveral
zones
for temporal
marine and
planning
and for
management.
resolution
of
measured
data for comparison with CCMP is 6
steps are to Prior
calculate
wind steps,
energyinformation
potential, capacity
factor
powerwould
distributions,
and to
to these
on how
windandpower
be
hours;
similar
to
that
of
the CCMP data. The measurement
evaluate their
temporal
and
spatial
variations
for
each
zones.
Prior
to
these
steps,
converted is required, which can be input by power curves of
information the
on reference
how windwind
powerturbines.
would be
converted
is
required,
which
can
be
input
by
stations
are
also
placed
at
a height of 10 m above sea level.
In this study, a LEANWIND 8 MW
power curves of reference wind turbines. In this study, LEANWIND 8 MW turbineThus,
[41] isthe two datasets have a similar temporal resolution
turbine [41] is selected as the reference.
and height. In this study, the surface wind speed probability
Measurement
data
at
7
meteorological
distribution between the CCMP data and the measurement
CCMP data
stations (Co To, Bach Long Vi, Hon Ngu,
(ocen surface wind
data from seven meteorological stations along the coast and on
Ly Son, Phu Quy, Trung Tra, Phu Quoc)
data)
several islands for five years (from 2007 to 2011) is compared.
Table 1. Information of the CCMP dataset [30].
Validation (comparing
surface wind speed
probality distribution)
Extrapolate wind speed to 100 m height, Eq. (1)
Initially evaluate temporal & spatial variation
(based on wind speed & managemement)
Zon the offshore wind resources (for
marine/energy planning & management)
Calcutate wind energy - Eq. (5), capacity factor Eq. (6) & power distribution for zones
Criteria for zoning &
assessment (100 nm;
temperature variation; SPS
& infrastructures; major
ports; wind spatiality)
Region
Global
Northernmost latitude (degree)
78
Southernmost latitude (degree)
-78
Westernmost longitude (degree)
0
Easternmost longitude (degree)
360
Time span
1987-Jul-02 to 2011-Dec-31
Spatial resolution (Latitude × Longitude)
0.250× 0.250
Temporal resolution (hour)
6
Estimation of wind energy potential
In order to assess the relevant wind energy potential to the
In order to assess
energy
relevant
to the
windisturbines,
windwind
turbines,
the potential
wind speed
at various
heights
required.the informatio
the
wind
at
different
heights
is
required.
The
CCMP
dataset
used
this research cont
The CCMP dataset used in this research contains windinspeed
Fig. 1. Methodology
of thesynchronous
study. SPS:power
synchronous
Fig. 1. Methodology
flowchart of flowchart
the study (SPS:
source).
wind speed at 10 at
meters
in height.
Theabove
wind sea
power
law
that
haspower
been used
10 meters
in height
level.
The
wind
law, for extrapola
power source.
commonly
used toforspecific
extrapolating
the sea as follows:
wind speed from the
sea surface
heightswind
[24, speed
44, 45]from
is adopted
Dataset selection and validation
surface to specific heights [24, 44, 45], is adopted as follows:
The surface wind dataset is used in research obtained from
(1)
( )
the CCMP project published by the U.S. National Aeronautics
and Space Administration (NASA) [30, 42]. This project aimed
to obtain multi-instrument ocean surface wind velocity, which where the parameter α is the power law exponent, v1 is wind
where the parameter is the power law exponent, is wind speed at height
and
is used to analysis meteorology and oceanography. This dataset speed at height z1, and v2 is wind speed at hub height z2.
Davenport
andthe
Hsu
[47], the magnitude o
wind
speed
at hubAccording
height .toAccording
Davenportto[46]
and Hsu[46]
[47],
magnitude
is built from combining cross-calibrated satellite
winds
from
power
law
exponent
was
found
to
be
approximately
0.1
with
the
natural
conditions in the
remote sensing systems by using variational analysis (VA) of the power law exponent was found to be approximately
It
is
noted
that
this
theoretical
extrapolation
approach
is
for
preliminary
assessm
[42]. This method creates a gridded surface wind analysis with 0.1 under natural conditions of the sea. It is noted that this
particularly
at
larger
scale
and
the
spatial
variation.
Future
projects
to
obtain
measurem
high spatial resolution (0.25 degrees) that can minimize the theoretical extrapolation approach is for a preliminary
and higher resolution data for wind profiles at turbine hub height are recommended be
planning the offshore wind development zones and marine spaces.
Evaluate & recommend zones for
offshore wind (based on criteria & data)
Wind turbines converse the kinetic energy of wind into electrical energy. By opera
Vietnamturbines:
Journal of vertical
Science,
classification,
there2020
are •two
basic
types 1of wind
March
Vol.62
Number
5 and horizontal
Technology
and Engineering axis
where the horizontal axis wind turbines are more popular than the vertical axis one.
power output of a horizontal axis wind turbine is calculated by using following equa
In order to assess wind energy potential relevant to the wind turbines, the information on
In order to assess wind energy potential relevant to the wind turbines, the information on
e wind at different heights is required. The CCMP dataset used in this research contains
he wind at different heights is required. The CCMP dataset used in this research contains
ind speed at 10 meters in height. The wind power law that has been used for extrapolating
wind speed at 10 meters in height. The wind power law that has been used for extrapolating
ind speed from the sea surface to specific heights [24, 44, 45] is adopted as follows:
wind speed from the sea surface to specific heights [24, 44, 45] is adopted as follows:
( ) and Computer Science | Computational Science, Physical sciences | Engineering
Mathematics
( )
(1)
(1)
here the parameter is the power law exponent, is wind speed at height
and
is
where the parameter is the power law exponent, is wind speed at height
and
is
. According
to Davenport
[46] and
Hsuand
[47],spatial
the magnitude
of the
ind speed at hub height
assessment,
particularly
at
a
larger
scale
variation.
wind speed at hub height . According to Davenport [46] and Hsu [47], the magnitude of the Zoning and assessment criteria of offshore wind resource
ower law exponent was found to be approximately 0.1 with the natural conditions in the sea.
power law exponent
was found
to be
0.1 with the
the sea.zones
Future
research
toapproximately
obtain measurements
andnatural
higherconditions
resolutionindata
is noted that this theoretical extrapolation approach is for preliminary assessment,
It is noted that for
this wind
theoretical
extrapolation
approach
isareforrecommended
preliminary assessment,
profiles
at
turbine
hub
height
before
rticularly at larger scale and the spatial variation. Future projects to obtain measurement
particularly at larger scale and the spatial variation. Future projects to obtain measurement Based on the beneficial approach of time and space zoning
d higher resolution
data forthe
wind
profiles
at turbine
hub height
areand
recommended
before
planning
offshore
wind
zones
marine spaces.
and higher resolution
data for wind
profiles
atdevelopment
turbine hub height
are recommended
beforediscussed in [38], the lessons learned from the GBRMP [40], and
anning the offshore wind development zones and marine spaces.
planning the offshore Wind
wind development
zones
and
marine
spaces.
turbines convert the kinetic energy of wind into from the ongoing MSP development in Europe and other countries
Wind turbines converse the kinetic energy of wind into electrical energy. By operation
Wind turbineselectrical
converse energy.
the kinetic
of wind
into electrical
energy.
By basic
operation[38], the following set of criteria is proposed to initially zone the
Byofenergy
operation
classification,
there
arehorizontal
two
assification, there are two basic types
wind turbines:
vertical axis
and
axis
classification, there
are
two
basic
types
of
wind
turbines:
vertical
axis
and
horizontal
axis
types
windturbines
turbines:
axis andthan
horizontal
axis,axis
where
here the horizontal
axisofwind
arevertical
more popular
the vertical
one.theThe offshore wind resources in Vietnam and to assess the zones:
where the horizontal axis wind turbines are more popular than the vertical axis one. The
ower output of a horizontal
horizontal axis wind
turbine is are
calculated
by usingthan
following
equation
more popular
the vertical
power output of a horizontalaxis
axiswind
wind turbines
turbine is calculated
by using following
equation (a) Sea area of 100 nautical miles (185.2 km) from the coastline:
8, 49]:
axis
ones.
The
power
output
of
a
horizontal
axis
wind
turbine
is this distance is adopted as it is the maximum distance that offshore
[48, 49]:
calculated by using following equation [48, 49]:
( ) {
( ) {
( )
( )
wind farm can be deployed in the near future at economical costs.
(2)
(2)
(2)
(b) Temporal variation in temperature over the year: this
affects the characteristics of coastal and marine biology and human
activities at sea, including fishing and tourism.
(c) Synchronous power sources and main electricity
where
, vrated
, vr, and
vo cut-in
are thewind
rated
power,
here the parameters
P , vthe
, v ,parameters
v and A arePthe
power,
speed,
ratedcutwind
where the parameters rPr, i vi, rvr, ovo and A arer thei rated
power,
cut-in wind speed, rated windtransmission lines: synchronous power sources are hydropower,
eed, cut-out wind
speed,
and rated
rotorwind
swept
areaandofcut-out
a reference
wind ofturbine,
in
wind
speed,
speed
wind
speed
the
speed, cut-out wind speed, and rotor swept area of a reference wind turbine,
gas, and oil-fired power plants. Main electricity transmission lines
wind relationship
turbine, respectively,
andspeed
pf (v)
the nonlinear
spectively, ( )reference
is the nonlinear
between wind
andiselectric
power,
respectively, ( ) is the nonlinear relationship between wind speed
and electric power, include 500 and 220 kV lines. These power infrastructures are
relationship between wind speed and electric power:
essential to the spatial distribution and intermittency of renewable
(3) energy sources in criterion (e) and the delay in expansion/
(3)
.
(3)
upgrading the electricity grid required [34].
In
Eq.
(3),
A
is
rotor
swept
area
of
the
reference
wind
turbine,
In Eq. (3),
is the air density and
is the overall efficiency coefficient, valued
In Eq. (3),
coefficient, valued (d) Existing or potential major seaports and container
ρ isisthe
theairairdensity
densityand
and Cpis isthetheoverall
overallefficiency
efficiency
coefficient,
tween 0.3 and 0.5, and varying with both wind speed and rotational speed of the turbine. terminals: these are the key elements of the supply chain required
between 0.3 and 0.5,
and
varying
with
both
wind
speed
and
rotational
speed
of thespeed
turbine.
valued between 0.3 and 0.5, which varies with both wind
for the assembly, transportation, and installation of offshore wind
he energy conversion output of a wind turbine over a time period can be determined as:
The energy conversion
output of speed
a windof
turbine
over a time period can be determined as: turbines components including the blades, towers, substructure,
and rotational
the turbine.
.
( )
( )
The energy conversion output of a wind turbine over a time
period can be determined from:
∑
( )
∑
(4)
,
∑( ) ( ) ,
,
(4)
( )
∑
,
where T is the
(h) and N is the number (4)
of
( ) resolution
∑ temporal
,
is the temporal resolutiont (hour) and N is the number of spans in the time period. (4)
spans in the time period.
and foundations [2]. In order to accommodate installation vessels,
offshore developers require a port draft of up to 10 m, quayside of
up to 300 m, and water way of up to 200 m [50]. The transportation
of monopiles using heavy lift cargo vessels and their installation
by jack-up vessels require drafts of about 9.5 m and 5.8 m to Chart
(4) (4)
Datum
of water, respectively [51]. The overall lengths for heavy
lift cargo vessels approach 170 m [51].
roduction
from
wind
farm
inresolution
the time
period
isand
calculated
as
follows
wherewhere
is thethe
resolution
(hour)
and N
is
the
of spans
in theintime
istemporal
the
temporal
N isnumber
thespans
number
of time
spans
the period.
time period.
is the temporal
resolution
(hour)
and N(hour)
is the number
of
in the
period.
(e) Temporal and spatial variation of wind resources:
Energy production
wind farm
overin
the
is the temporal resolution
(hour) and Nfrom
is thethe
number
of spans
the time
time period
period. is
Energy
production
from from
the wind
farm in
theintime
period
is calculated
as follows
Energy
production
theinwind
farm
the is
time
period
isascalculated
as follows parameters characterising the quality of wind resources directly
production
from
the
wind
farm
the
time
period
calculated
follows
as follows:
∑
(5)
production from calculated
the wind farm
in the time, period is calculated as follows
obtained from wind data are wind speed and wind direction.
(5) (5)
Temporal
variation means the change of wind speed over months,
(5)
seasons, and years. Both wind speed and its temporal variation
wherewhere
is the
number
turbines
in wind
theinwind
farm.electrical
apacity
factor
(CF)
represents
thenumber
ratioturbines
between
the
actual
energy
the
number
of
wind
the
wind
farm.
Nof
iswind
the
of
turbines
in the wind
farm.output
govern the energy output of a wind turbine as in Eq. (4), and
t turbines in the wind farm.
is the numberiswhere
of
wind
maximum
possibleof
electrical
energy
during
the
time
period,
and
depends
on both
isThe
the capacity
number
wind
turbines
in
the
wind
farm.
factor
(CF)
represents
the
ratio
between
the
actual
electrical
energy
output
control the capacity factor, as defined in Eq. (6).
The
capacity
factor
(CF)the
represents
the ratio
the
actual
electrical
energyconsequently
output
capacity
represents
the
between
the output
actual
eines
capacity
factor
(CF)The
represents
ratio between
the between
actual
electrical
energy
and the
site characteristics.
Thefactor
annual
CF is defined
asratio
follows:
eand
capacity
factor
(CF)
represents
the
ratio
between
the
actual
electrical
energy
output
the
maximum
possible
electrical
energy
during
the
time
period,
and
depends
on both
and
the
maximum
possible
electrical
energy
during
the
time
period,
and
depends
on
both
Both
wind
speed
and its spatial and temporal variation influence
e maximum possible
electrical
energy
during
thethe
timemaximum
period, andpossible
dependselectrical
on both
energy
output
maximum
possible
electrical
energy
during
the
time
and
depends
on both
wind
turbines
andelectrical
the
site
Theand
annual
CFperiod,
is defined
as
follows:
and
thecharacteristics.
site
characteristics.
Theis
annual
defined
as follows:
the energy production of wind farms as shown in Eq. (5), and the
urbineswind
and turbines
the site characteristics.
The annual CF
definedCF
as isfollows:
rbines and the site
characteristics.
annual
CFand
is defined
as on
follows:
energy
during theThe
time
period
depends
both wind turbines
,
energy storage and the integration of the wind farms into the grid.
(6)
and site characteristics. The annual CF is defined as follows:
larger scales, spatial and temporal variation affect the stability
(6)At(6)
,
,
,
(6)
and operation of the national/regional power system [32, 35].
,
(6) (6)
∑ ∑ ,
∑
,
is the number of wind turbines in∑the wind farm.
,
,
annual maximum possible electrical energy is defined as follows :
(5)
(5)
The theoretical potential of wind energy is however limited
by a number of constraints including ecology, supply chains,
other sectors, and political and natural reasons. In identifying the
(7)
(7)unsuitable
(7)
areas for onshore wind in Vietnam, exclusion criteria
(7)
where
the annual
maximum
possible
electrical
is
wherewhere
the annual
maximum
possible
electrical
energy
is defined
as energy
follows
: defined
the annual
maximum
possible
electrical
energy
defined
the annual
maximum
possible
electrical
energy
is defined
asisfollows
: as follows :
as( follows:
he annual maximum
possible electrical
energy
is
defined
as
follows
:
) (
).
(7)
(
)
. ).
( ) ( ) () ) (
(
.
(
) (
).
ng and assessment criteria of offshore wind resource zones
(7)
d on Zoning
the beneficial
approach
of time
space
zoning
discussed
inzones
[38] and the
and assessment
criteria
ofand
offshore
wind
resource
zones
and
assessment
criteria
of
offshore
wind
resource
ning and Zoning
assessment
criteria
of offshore
wind
resource
zones
arnedand
from
the GBRMP
[40]ofand
from the
ongoing
MSP
development in Europe
ning
assessment
criteria
offshore
wind
resource
zones
Vietnam
Journal
ofofScience,
Based on theonbeneficial
approach
of time
and
space
zoning
discussed
in [38]
and the the
beneficial
approach
timezoning
andMarch
space
zoning
in
2020
•discussed
Vol.62
1
sed
on theBased
beneficial
approach
and
space
discussed
inthe
[38]
and Number
the[38] and
countries
[38],
the
following
set of
of time
criteria
is from
proposed
to initially
zone
offshore
6theapproach
Technology
andand
Engineering
lessons
learned
from
the GBRMP
[40]
the
ongoing
MSP
development
in Europe
sed
onlessons
the
beneficial
of time
space
zoning
discussed
in [38]
and the
learned
from
the
GBRMP
[40]
and
from
the
ongoing
MSP
development
learned
from the and
GBRMP
[40]the
and
from the ongoing MSP development in Europe in Europe
urces
in
Vietnam
to
assess
zones.
and
other
countries
[38], [38],
the[40]
following
set of
criteria
is proposed
to initially
zone
the offshore
learned
the
GBRMP
and from
the
ongoing
MSP
development
in
Europe
andfrom
other
countries
the
set
of criteria
is initially
proposed
to initially
zone
the offshore
her
countries
[38],
the following
setfollowing
of criteria
proposed
to
zone
the offshore
ea area
of 100
nautical
miles (185.2
km) faris from
the coastline:
this
distance
is
er
countries
[38],
following
of to
criteria
isthe
proposed
to initially zone the offshore
wind
resources
inthe
Vietnam
and set
toand
assess
the zones.
wind
resources
in
Vietnam
assess
zones.
esources
Vietnam
and to assess
thethat
zones.
dopted
as in
it is
the maximum
distance
offshore wind farm can be deployed in the
Mathematics and Computer Science | Computational Science, Physical sciences | Engineering
including high altitude, political areas (cities, urban centres, road,
railway, airport, etc.), water areas, protected areas, and living
areas, were used [11]. When studying offshore wind potential, a
number of exclusion criteria for onshore wind are not applicable
or need to be updated, and new criteria should be defined for finer
zoning and practical assessment in future studies.
Results and discussion
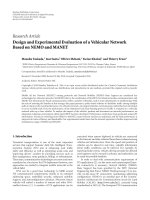
Data validation
The CCMP dataset was compared with the observed data
from seven meteorological stations. The locations of the seven
meteorological stations are shown in Table 2 and Fig. 2. Fig.
3 shows the wind speed probability distribution of both the
CCMP data and measurement data. The shape of the probability
distribution of the CCMP data is very close to the measured
data. Notably, the shape of the distributions of the two data
sources are almost identical at the Co To, Hon Ngu, and Ly Son
stations. From Fig. 3, it can also be seen that the area around
Phu Quy island has the largest wind speed. Phu Quy is a part
of the Ninh Thuan province. In the North Sea, Bach Long Vi
island also has strong wind in that area.
Table 2. Location of meteorological stations of Vietnam.
No.
Station
Latitude
Longitude
1
Co To
20.98
107.77
2
Bach Long Vi
20.13
107.72
3
Hon Ngu
18.8
105.77
4
Ly Son
15.38
109.15
5
Phu Quy
10.52
108.93
6
Truong Sa
8.65
111.92
7
Phu Quoc
10.22
103.97
Fig. 2. Location of meteorological stations on the map.
Fig. 3. Surface wind speed probability distribution of the CCMP data and observed data from the seven meteorological stations
over the five-year period 2007-2011.
March 2020 • Vol.62 Number 1
Vietnam Journal of Science,
Technology and Engineering
7
Mathematics and Computer Science | Computational Science, Physical sciences | Engineering
Evaluation of spatial and temporal variation of offshore wind
resources
The seasonal variation of wind speed and direction over the
period 2007 to 2011 can be evaluated from Fig. 4, where the
study considers four seasons: winter being December - January
- February (DJF), spring including March - April - May (MAM),
summer including June - July - August (JJA), and autumn including
September - October - November (SON). In the winter months, the
north-eastern monsoon is stronger than the winds during the other
seasons in Vietnam. The south-western monsoon is quite strong in
the summer months June - July - August (JJA).
Figure 5 shows the wind speed at a turbine hub elevation of
100 m averaged from 2007 to 2011, however this data was not
verified due to the shortage of measured data. In the offshore areas
around Phu Quy island, the wind speed is largest with an average
of about 11 m/s. It is approximately 9 m/s at Tonkin Gulf in the
northern sea. The inter-annual wind speed of the four islands: Bach
Long Vi, Ly Son, Phu Quy, and Phu Quoc, from 2007 to 2011,
are shown in Fig. 6, which is obtained by plotting the monthly
averaged wind speed over five years. The largest wind speed is
about 12 m/s in Phu Quy island in January. The lowest wind speed
range is from 2.765 to 7.347 m/s during this period in Phu Quoc.
The mean wind speed ranges from 3.578 to 9.682 m/s and from
2.91 to 9.275 m/s in Bach Long Vi and Ly Son, respectively.
Fig. 6. Inter-annual wind speed at the four islands over the period
2007-2011.
Zoning and assessment of zone infrastructures for
offshore wind energy
Based on the consultation with marine and island
management experts along with the criteria discussed in the
above section, the offshore wind resource in Vietnam was
first classified into four zones with their boundaries shown in
Fig. 7. Zone 1 is the region with the coldest winter of the four
zones and consists of eight provincial sea areas extending from
Quang Ninh province to Ha Tinh province. Zone 2, where the
winter is moderately cold, has a sea area comprising of seven
coastal provinces starting from Quang Binh to Binh Dinh.
Zone 3 is less affected by the winter monsoon and is made up
of five provincial seas from Phu Yen to Ba Ria - Vung Tau.
Zone 4 is the sea region from Ho Chi Minh city to the Kien
Giang province, is the least affected by the winter, and has the
highest average temperature over the year.
Fig. 4. Seasonal average surface wind speed within five years
from 2007 to 2011.
Fig. 5. Wind speed average at 100 m above sea level from 2007
to 2011.
8
Vietnam Journal of Science,
Technology and Engineering
Fig. 7. Proposed four zones of Vietnam’s offshore wind resources.
March 2020 • Vol.62 Number 1
Mathematics and Computer Science | Computational Science, Physical sciences | Engineering
Second, the offshore wind resource zones classified above
were assessed by using criteria (c) - (e) listed above. Fig. 8
reveals the existing synchronous power sources and major
transmission lines in Vietnam [52] as required by criterion
(c). The region in the north of the country is a large area
containing diverse sources of electricity. The provinces along
the northern border import some of their electricity from
China. Additionally, there are major coal-fired power plants
in the north eastern provinces. The major hydropower plants
are located the north western provinces: Son La, Tuyen Quang,
and Hoa Binh.
The continental shape of the northern central region is long
and narrow. The electricity supply in this area comes from two
main sources, hydropower and imported electricity from Lao,
and is carried by 500 kV lines along this area. The source of
electricity for the mainland along southern central region is
mainly supplied by hydropower plants. In order to enhance
the transmission of electricity to this area, 220 kV and 500 kV
lines have been installed. Gas/oil-fired power plants are the
main supply of electricity in the southern region where some
of the electricity is exported to Cambodia. The spatiality of the
power sources and transmission systems are displayed in Fig.
8 as required by criterion (c) as previously discussed [34]. It is
worth noting that the country’s major demand centres are the
southern and northern regions [34].
Fig. 8. Major synchronous power sources and power transmission
lines in Vietnam [52].
The major seaports and container terminals are mapped in
Fig. 9 and listed in Table 3 as required by criterion (d). Major
ports with channel depths greater than 10 m and maximum
acceptable vessel size of 30,000 dead weight tonnage (DWT)
can be found in Zone 1, the southern part of Zone 2, Zone 3,
and Zone 4. The following three container ports in Vietnam:
Hai Phong and Dinh Vu in Zone 1 and Tan Cang Sai Gon in
Zone 4, are among the top 20 container of Southeast Asia [53].
Especially, the Van Phong International Transhipment Terminal
under development in Van Phong Bay, Khanh Hoa province of
Zone 3, which has a depth range of 15-20 m, a large area, and
anticipates a maximum vessel size of 9,000 TEUs (twenty-foot
equivalent units) or approximately 120,000 DWT. Considering
the important characteristics of a seaport, including draft/
channel depth, size of vessels accepted, and the available area,
the port facilities in Zone 3 are the most favourable for offshore
wind farm development. Those in Zone 1 and 4 are also of
good capacity.
Fig. 9. Location of major ports, container terminals, and in-land
river ports accessible to large vessels (data source: [54, 55]).
March 2020 • Vol.62 Number 1
Vietnam Journal of Science,
Technology and Engineering
9
Mathematics and Computer Science | Computational Science, Physical sciences | Engineering
8.5
20,000
11.0
Vestas V164-8.0 is in use by several offshore wind farms such as
Burbo Bank Offshore, the United Kingdom, and Norther N.V.,
Belgium [60]. However, it would be more difficult to design a
support structure for the Vestas V164 [41]. Additionally, the
rated wind speed of the Vestas V164-8.0 is 13.0 m/s and higher
than that of the LW turbines (12.5 m/s) as shown in Table 4.
The LW turbine is therefore cost-saving, able to meet the short
to medium-term requirements of the offshore wind industry
[41], and more suitable for the wind conditions in Vietnam.
Accordingly, the LW 8 MW is chosen for the estimation of
wind energy potential in this paper. Fig. 10 presents the power
curve of the LW turbine used to estimate the energy production
from wind speed. The reasonable distance of wind turbines
chosen to minimise the wake effects in the prevailing wind
direction is 10Dr, and in the crosswind direction is 4Dr [61].
However, the wake effects due to adjacent turbines in the wind
farms are not considered in this study [61].
11.0
30,000
8.2
Table 4. Information of Vestas V164-8.0 and LW 8 MW reference
turbines.
10 -17
45,000
30
Table 3. Characteristics of major ports in Vietnam.
No.
Berth Length
Berth draft zero tide
(m)
(m)
Channel
draft
zero tide
(m)
Vessel
accepted
Area
(DWT)
(ha)
13 - 20
50,000
15 [55]
10.0
50,000
18.1
5.5
40,000
29 [55]
7.3
40,000
24 [55]
Zone 1
3×680
13.0
Quang Ninh [55]
3×594
13.0
Cai Lan International [55]
5×848
8.5
Hai Phong - Chua Ve [55]
2×427
8.9
Dinh Vu - Hai Phong [55]
5×956
9.1
Hai Phong - Tan Vu [55]
1
2
3
4
5
9.4
51
Zone 2
8.5
Nghi Son, Thanh Hoa [55]
12.0
Chan May, Hue [55]
12.0
Da Nang [55]
12.0
Quy Nhon, Binh Dinh [55]
1
2
3
4
10.5
30,000
36
Zone 3
11.8
Nha Trang, Khanh Hoa [55]
9.7
Cam Ranh, Khanh Hoa [55]
12,000 (total)
15~20
Van Phong [57] (Potential)
14
Phu My, Baria - Vung Tau [55]
1
2
3
4
11.1
20,000
8.0
10.2
30,000
89
9.3
120,000 [56]
740
60,000
13.0
Parameter
Vestas V164-8.0 [58]
Rating power, Pr (kW)
8000
8000
Cut-in wind speed, vi (m/s)
4
4
LEANWIND 8 MW [41]
Rated wind speed, vr (m/s)
13.0
12.5
Cut-out wind speed, vo (m/s)
25
25
Rotor diameter, Dr (m)
164
164
Rotor speed range (rpm)
4.8-12.1 [59]
6.3-10.5
Rotor swept area, Ar (m2)
21,124
21,113.36
Hub height, Hhub (m)
105
110
LEANWIND 8MW
8000
Zone 4
2
3
11.5
8.5
30,000
38 [55]
10.5
8.5
50,000 [55]
30.0
11.0
8.5
36,000 [55]
28.0
Ben Nghe [57]
6000
Power (kW)
5×706
Tan Cang [57]
2,667 (total)
Sai Gon [57]
816 (total)
1
4000
2000
Evaluation of wind energy potential and variation for
each zone
In order to evaluate the wind energy potential and its
variation, information regarding how the varying wind speed
would be converted by the wind turbines to wind power
is necessary. Such information is often revealed from the
power curves of wind turbines. Given that offshore wind
could enable the deployment of larger turbines and that threebladed horizontal axis wind turbines (HAWTs) are mature and
commercial, two large HAWTs with a power rating of 8 MW
and with publicly available power curves, Vestas V164-8.0 [58,
59] and LEANWIND (LW) [41], are considered in this study.
The parameters of the two turbines are listed in Table 4. The
10
Vietnam Journal of Science,
Technology and Engineering
0
0
5
10
15
20
25
30
Wind speed (m/s)
Fig. 10. Power curve of LEANWIND 8 MW turbine. plotted from
data in [41].
The seasonal accumulated wind energy density of the four
zones from 2007 to 2011 is illustrated in Fig. 11, where the
highest density of energy among the four zones is seen to occur
during the winter months. Meanwhile, the second largest wind
energy density occurs during autumn. On the other hand, the
lowest power density occurs during the spring and the summer.
It is apparent from Fig. 11 that Zone 3 contains the highest
wind energy potential during the four seasons in Vietnam.
March 2020 • Vol.62 Number 1
Mathematics and Computer Science | Computational Science, Physical sciences | Engineering
Table 5 summarises the maximum seasonal accumulated
wind power in the four zones. The highest value is that of Zone
3, during winter, with a value of 28.95 GWh/km2. The season
with the least wind energy potential occurred during spring
and had the smallest value of 11.87 GWh/km2 in Zone 4. Fig.
12 compares the annual accumulated wind density of the four
zones between 2007 and 2011. It can be clearly seen that the
annual accumulated wind energy density is about 80 GWh/km2
at Zone 3, which is larger than in the other areas. The areas in
Zone 2 and Zone 4 had wind energy densities similar to Zone
3. In Zone 1, the area around the latitude and longitude of 19.8
and 108, respectively, had the largest offshore wind energy
potential. Bach Long Vi island is closest to that location.
Zone 1
Table 5. Maximum of seasonal wind energy in offshore wind
zones (GWh/km2).
Zone 2
Season
Zone 1
Zone 2
Zone 3
Zone 4
Winter
19.28
22.17
28.95
26.69
Spring
14.79
12.97
13.63
11.87
Summer
14.63
14.22
19.73
14.63
Autumn
18.33
18.49
20.15
17.34
Zone 3
Fig. 12. Annual accumulated wind energy in four zones.
Capacity factor
Zone 4
Fig. 11. Seasonal accumulated wind energy in four offshore
zones in Vietnam.
The seasonal and annual CFs of the four zones using the
LW 8 MW turbine power curves are shown in Figs. 13 and 14,
respectively, where only the areas with a capacity factor greater or
equal to 25% are shown. The north eastern monsoon enables CFs
to reach their highest value. As a result, the transformation of wind
energy into electricity by turbines is at its highest. Particularly,
the area far from Phan Thiet city, about 120 km to the northwest,
has a maximum capacity greater than 80%. Moreover, the annual
average capacity factor in this area also had the highest value (about
60%) compared with the other zones. In contrast, the offshore area
from Quang Binh to Quang Nam in Zone 2 is not effective for the
operation of wind turbines in the summer.
March 2020 • Vol.62 Number 1
Vietnam Journal of Science,
Technology and Engineering
11
Mathematics and Computer Science | Computational Science, Physical sciences | Engineering
Figure 15 showed the inter-annual CFs at four islands during
the period 2007-2011. The authors selected four islands (Bach
Long Vi, Ly Son, Phu Quy, and Phu Quoc) from four different
zones (Zone 1, Zone 2, Zone 3 and Zone 4, respectively) to
investigate. One particularly interesting fact highlighted by Fig.
15 is the offshore wind potential is very high around Phu Quy
island. The CF in this area during the year 2011 reached 68%
and the average over the 2007-2011 was 54.4%. There was a
considerably high CF around Bach Long Vi island where the
average figure during 2007-2011 reached 40.4%. In contrast,
the CF was the lowest at Phu Quoc island, where the maximum
figure was only 24.4% in the year 2011 and the five-year average
was 17.7%. The inter-annual temporal variations in CF was also
observed for the four islands, where the figure for Bach Long
Vi in 2009 was 34.3%, compared to its highest value of 44.1%
in 2010. The CF for Phu Quy island had the highest potential
area in 2010 with 42.8% and only 67.7% in 2011. Such interannual temporal variations are important input to planning and
designing energy storage systems, grid and synchronous power
sources, as well as for energy demand management.
Zone 1
Zone 2
Zone 3
Fig. 14. Annual average capacity factor in four offshore wind
zones using LW 8 MW turbines.
Zone 4
Fig. 13. Seasonal average capacity factor in four offshore wind
zones using LW 8 MW turbines, only areas with CF≥25%.
12
Vietnam Journal of Science,
Technology and Engineering
Fig. 15. Inter-annual capacity factor in four islands in the period
2007-2011. (A) Bach Long Vi (Zone 1), (B) Ly Son (Zone 2), (C) Phu
Quy (Zone 3), and (D) Phu Quoc (Zone 4).
March 2020 • Vol.62 Number 1
Mathematics and Computer Science | Computational Science, Physical sciences | Engineering
Wind power density distribution
Information about wind power distribution is shown in
Figs. 16 and 17 and is important to assessing project feasibility,
designing energy storage systems, and power transmission
networks [33]. Based on the recommended layout of offshore
wind farms [61], up to two LW turbines (8 MW) per one square
kilometre can be installed. Therefore, the maximum power
distribution for one square kilometre is 16 MW. In the Tonkin
Gulf (Zone 1), the power distribution increased gradually to
100 NM (about 185 km) from the coastline of Vietnam. As
similarly observed in the two previous sections, Zone 3 had
the highest potential for offshore wind energy in relation to
the other three zones. The maximum annual average power
distribution in Zone 3 was about 9.3 MW/km2. The area around
Phu Quoc island had the lowest potential for wind energy in
Zone 4. Fig. 18 provides the time histories of the inter-annual
wind power density at the four islands between 2007 and 2011.
Clearly, Phu Quy island had a higher wind power density than
any other island. The maximum value of wind power density
was 15.42 MW/km2, which was higher than other regions. In
Bach Long Vi, Ly Son, and Phu Quy, wind power density did
not change much over the years. Meanwhile, there was a large
changed over the years in Phu Quoc. There was a big gap in
the maximum value of wind power density between 2008 and
2011 with 4.081 MW/km2 and 8.001 MW/km2, respectively.
From Fig. 18 it can also be seen that the wind power density
rose during the winter at all islands.
Based on the above sections, the evaluation of each zone
using criteria (b) - (e) is summarised in Table 6. Zone 3, the
southern part of Zone 2, and Ba Ria-Vung Tau in Zone 4
were found to be the most suitable for offshore wind energy
development, especially considering their high capacity factors
and moderate variation of power density, the fact that the
resource is not far from shore, and its excellent port facility.
Given the high demand in energy and good port capacity, but
the potential resource is further offshore, Zone 1 and Zone 4 are
recommended for future development when far offshore wind
farms become more cost-effective.
This study, however, focused on natural aspects such as wind
speed and direction, and physical aspects including reference
turbines, synchronous power sources, transmission lines,
and ports. Environmental, biological, governance, political,
and management factors that can influence the evaluation of
offshore wind zones were not considered.
Zone 1
Zone 2
Zone 3
Zone 4
Fig. 16. Seasonal average power distribution in four zones.
March 2020 • Vol.62 Number 1
Vietnam Journal of Science,
Technology and Engineering
13
Mathematics and Computer Science | Computational Science, Physical sciences | Engineering
Fig. 17. Annual average power distribution in four zones.
Table 6. Summary of zone evaluation for offshore wind energy.
Criteria
Zone 1
Zone 2
Zone 3
Zone 4
Temperature
variation
Very strong,
4 seasons,
coldest winter
Strong, 4 seasons,
moderate cold
winter
Moderate, 2
seasons, less
affected by
monsoon
Weak, 2
seasons, least
affected by
winter
Synchronous
power
sources &
transmissions
Hydropower,
coal-fired
No major SPS.
Main transmission
lines available
Hydropower,
Main
transmission
lines available
Gas/oil-fired
Ports
Very good
(Cai Lan,
Dinh Vu),
larger areas
needed
Poor in northern.
Good in southern
end close to Zone
3 (Chan May, Quy
Nhon)
Excellent, large
area available
(Cam Ranh,
Van Phong, Phu
My)
Good (Tan
Cang, Sai
Gon), larger
area needed
Wind energy
potential
(energy &
power density,
5-year CF)
14-19 GWh/
km2; CF
30-45%
(Bach Long
Vi 40%); 4-7
MW/km2
12-22 GWh/km2;
(large in southern);
CF 25-40% (Ly
Son 25.2%); 5-6.5
MW/km2
14-29 GWh/
km2; CF 4065% (Phu Quy
54.5%); 8-10
MW/km2
12-27 GWh/
km2; strong
near zone 3;
CF 25-50%
(Phu Quoc
17.8%), 4-8
MW/km2
Wind
temporal
variation
Moderate,
peak in winter
Moderate, peak in
winter
Moderate
Strong, peak
in winter
Wind spatial
variation
Strong,
centred zone
far offshore
Strong, long zone
very far offshore
Moderate, large
zone closer to
shore
Centred zone
to northeast
(Zone 3)
Conclusions
The shortage of reliable datasets, lack of comprehensive
assessment of offshore wind resources and infrastructures,
wind temporal and spatial variations, and integration of
offshore wind development and operation into other marine
strategies and activities have been highlighted as the major
14
Vietnam Journal of Science,
Technology and Engineering
Fig. 18. Inter-annual wind power density in four islands period
2007-2011. (A) Bach Long Vi (Zone 1), (B) Ly Son (Zone 2), (C) Phu
Quy (Zone 3), and (D) Phu Quoc (Zone 4).
domestic challenges to offshore wind policymakers and
developers in Vietnam. Addressing these challenges has been
strategically presented, in which the CCMP data over the five
year span 2007-2011, were validated with measurement data
from seven meteorological stations. The offshore wind power
resource was initially assessed by using temporal and spatial
variations of offshore wind speed and directions. Based on
expert consultations, temporal variation of temperature, the
offshore wind resource in Vietnam was classified into four sea
zones extending up to 100 NM from the coastline: (1) Quang
Ninh to Ha Tinh, (2) Quang Binh to Binh Dinh, (3) Phu Yen to
Ba Ria - Vung Tau, and (4) Ho Chi Minh city to Kien Giang.
The LEANWIND 8 MW was chosen as the reference turbine
for estimating wind energy potential. An assessment of offshore
wind power resource and infrastructures was presented based on
the following set of criteria: temporal variation in temperature,
synchronous power sources and power transmission, major sea
ports, and the spatial and temporal variation of offshore wind
power and density. The following conclusions were drawn:
- The CCMP dataset is reliable as their wind speed
probability distribution was in good agreement with that of the
measurement data.
- The largest and average wind speeds were about 12 and 11
m/s at Phu Quy island (Zone 3) in January. The ranges of wind
speed in Bach Long Vi (Zone 1) and Ly Son (Zone 2) were
from 3.578- 9.682 m/s and 2.91-9.275 m/s, respectively. The
wind speed/during this period in Phu Quoc (Zone 4) was the
lowest, ranging from 2.765 to 7.347 m/s.
- The major ports with channel depths greater than 10 m
and capable of accepting vessels up to 30,000 DWT are located
in Zone 1, the southern part of Zone 2, Zone 3, and Zone 4.
Especially, the Van Phong port in Zone 3 has a depth range of
March 2020 • Vol.62 Number 1
Mathematics and Computer Science | Computational Science, Physical sciences | Engineering
15-20 m and expects to accept a vessel of up to 120,000 DWT.
[5] Danish Energy Agency (2017), Vietnam Energy Outlook Report.
- The highest density of energy occurred during the winter
months and autumn was the second largest. Zone 3 contained
the highest wind energy potential during the four seasons,
where the annual accumulated wind energy density was about
80 GWh/km2.
[6] P.H. Ty (2015), Dilemmas of Hydropower Development in Vietnam:
Between Dam-induced Displacement and Sustainable Development, Delft:
PhD Thesis, Utrecht University, The Netherlands.
- The CFs over the five-year span 2007-2011 at Phu Quy,
Bach Long Vi, Ly Son, and Phu Quoc were 54.5, 40.4, 25.2,
and 17.8%, respectively. The considerable temporal variations
inter-annually are important input to designing energy storage
systems, grids, and synchronous power sources, as well as for
energy demand management.
- Zone 3 (particularly Binh Thuan and Ninh Thuan sea), the
southern part of Zone 2, and Ba Ria - Vung Tau in Zone 4 were
the most suitable to offshore wind energy development, owing
to high capacity factors and a power density with moderate
variation, the fact that the resource was not far from shore, and
their excellent port facilities.
- Given the high demand for energy and good port capacity,
but the potential resource is further offshore, Zone 1 and Zone
4 are recommended for future development when far offshore
wind farms become more cost-effective.
- Future studies to obtain measurement data for wind profiles
at turbine hub heights, and to consider biology, metocean, and
seabed topography and geology, are recommended before
planning such marine spaces.
ACKNOWLEDGEMENTS
The first author (Vu Dinh Quang) and the fourth author
(Nguyen Dinh Duc) have been supported by Vietnam National
University, Hanoi; Vietnam Japan University and University
of Engineering and Technology. The author Van Nguyen Dinh
has been funded by Science Foundation Ireland (SFI) Research
Centre: MaREI - 266 Centre for Marine and Renewable Energy
(12/RC/2302). The authors are grateful to the support.
The authors declare that there is no conflict of interest
regarding the publication of this article.
REFERENCES
[1] I. Dincer (2000), “Renewable energy and sustainable development:
a crucial review”, Renewable and Sustainable Energy Reviews, 4(2), pp.157175.
[2] V.N. Dinh and E. McKeogh (2018), “Offshore wind energy:
technology opportunities and challenges”, Lecture Notes in Civil Engineering,
Proceedings of the Vietnam Symposium on Advances in Offshore Engineering,
18, pp.3-22.
[3] V.N. Dinh and B. Basu (2013), “On the modeling of spar-type floating
offshore wind turbines”, Key Engineering Materials, 569-570, pp.636-643.
[4] C.-W. Zheng, Z.-N. Xiao, Y.-H. Peng, C.-Y. Li, Z.-B. Du (2018),
“Rezoning global offshore wind energy resources”, Renewable Energy, 129,
pp.1-11.
[7] GIZ (2016), Vietnam Power Development Plan for the Period 20112020: Highlights of the PDP 7 Revised, GIZ Energy Support Programme in
Viet Nam, available from: , Hanoi.
[8] M. Ha-Duong and H.A. Nguyen-Trinh (2018), “Two scenarios for
carbon capture and storage in Vietnam”, Energy Policy, 110, pp.559-569.
[9] N.D. Luong (2015), “A critical review on potential and current status
of wind energy in Vietnam”, Renewable and Sustainable Energy Reviews, 43,
pp.440-448.
[10] GWEC (2018), Global Wind Statistics 2017, Global Wind Energy
Council, available from: www.gwec.net.
[11] K.Q. Nguyen (2007), “Wind energy in Vietnam: resource assessment,
development status and future implications”, Energy Policy, 35(2), pp.14051413.
[12] V.Q. Doan, H. Kusaka, T.V. Du, N.D. Duc, T. Cong (2018),
“Numerical approach for studying offshore wind power potential along the
southern coast of Vietnam”, Lecture Notes in Civil Engineering, Proceedings
of the Vietnam Symposium on Advances in Offshore Engineering, 18, pp.245249.
[13] V.Q. Doan, V.N. Dinh, H. Kusaka, T. Cong, A. Khan, T.V. Du, N.D.
Duc (2019), “Usability and challenges of offshore wind energy in Vietnam 1
revealed by the regional climate model simulation”, Scientific Online Letters
on the Atmosphere, Doi: 10.2151/sola. 2019-021.
[14] V.Q Doan and P.L.D. Anh (2018), “The zoning of offshore wind
energy resources in the Vietnam sea”, Vietnam Symposium on Advances in
Offshore Engineering, pp.250-256.
[15] G. Gualtieri (2019), “A comprehensive review on wind resource
extrapolation models applied in wind energy”, Renewable and Sustainable
Energy Reviews, 102, pp.215-233.
[16] M. Gökçek, A. Bayülken, Ş. Bekdemir (2007), “Investigation
of wind characteristics and wind energy potential in Kirklareli, Turkey”,
Renewable Energy, 32(10), pp.1739-1752.
[17] C. İlkiliç (2012), “Wind energy and assessment of wind energy
potential in Turkey”, Renewable and Sustainable Energy Reviews, 16(2),
pp.1165-1173.
[18] A. Keyhani, M. Ghasemi-Varnamkhasti, M. Khanali, R. Abbaszadeh
(2010), “An assessment of wind energy potential as a power generation source
in the capital of Iran, Tehran”, Energy, 35(1), pp.188-201.
[19] K. Sopian, M.Y.H. Othman, A. Wirsat (1995), “The wind energy
potential of Malaysia”, Renewable Energy, 6(8), pp.1005-1016.
[20] A.B. Mayhoub and A. Azzam (1997), “A survey on the assessment
of wind energy potential in Egypt”, Renewable Energy, 11(2), pp.235-247.
[21] A.S. Ahmed (2010), “Wind energy as a potential generation source
at Ras Benas, Egypt”, Renewable and Sustainable Energy Reviews, 14(8),
pp.2167-2173.
[22] A.-Y. Sultan, Y. Charabi, A. Gastli, S. Al-Alawi (2010), “Assessment
of wind energy potential locations in Oman using data from existing weather
stations”, Renewable and Sustainable Energy Reviews, 14(5), pp.1428-1436.
[23] H. Nfaoui, J. Buret, A.A.M. Sayigh (1998), “Wind characteristics
and wind energy potential in Morocco”, Solar Energy, 63(1), pp.51-60.
March 2020 • Vol.62 Number 1
Vietnam Journal of Science,
Technology and Engineering
15
Mathematics and Computer Science | Computational Science, Physical sciences | Engineering
[24] A. Allouhi, O. Zamzoum, M.R. Islam, R. Saidur, T. Kousksou, A.
Jamil, A. Derouich (2017), “Evaluation of wind energy potential in Morocco’s
coastal regions”, Renewable and Sustainable Energy Reviews, 72, pp.311-324.
[25] K.M. Bataineh, and D. Dalalah (2013), “Assessment of wind energy
potential for selected areas in Jordan”, Renewable Energy, 59, pp.75-81.
[26] R.O. Fagbenle, J. Katende, O.O. Ajayi, J.O. Okeniyi (2011),
“Assessment of wind energy potential of two sites in North-East, Nigeria”,
Renewable Energy, 36(4), pp.1277-1283.
753, Doi:10.1088/1742-6596/753/9/092013.
[42] R. Atlas, R.N. Hoffman, J. Ardizzone, S.M. Leidner, J.C. Jusem, D.K.
Smith, D. Gombos (2011), “A cross-calibrated, multiplatform ocean surface
wind velocity product for meteorological and oceanographic applications”,
Bulletin of the American Meteorological Society, 92, pp.157-174.
[27] S.J. Lang and E.J. McKeogh (2009), “Forecasting wind generation,
uncertainty and reserve requirement on the Irish power system using an
ensemble prediction system”, Wind Engineering, 33(5), pp.433-448.
[43] P.W. Gaiser, K.M.S. Germain, E.M. Twarog, G.A. Poe, W. Purdy, D.
Richardson, W. Grossman, W.L. Jones, D. Spencer, G. Golba, J. Cleveland,
L. Choy, R.M. Bevilacqua, P.S. Chang (2004), “The windsat spaceborne
polarimetric microwave radiometer: sensor description and early orbit
performance”, IEEE Transactions on Geoscience and Remote Sensing,
42(11), pp.2347-2361.
[28] K.-Y. Oh, J.-Y. Kim, J.-K. Lee, M.-S. Ryu, J.-S. Lee (2012), “An
assessment of wind energy potential at the demonstration offshore wind farm
in Korea”, Energy, 46(1), pp.555-563.
[44] A. Dabbaghiyan, F. Fazelpour, M.D. Abnavi, M.A. Rosen (2016),
“Evaluation of wind energy potential in province of Bushehr, Iran”, Renewable
and Sustainable Energy Reviews, 55, pp.455-466.
[29] T. Remmers, F. Cawkwell, C. Desmond, J. Murphy, E. Politi
(2019), “The potential of advanced scatterometer (ASCAT) 12.5 km coastal
observations for offshore wind farm site selection in Irish waters”, Energies,
12(2), Doi:10.3390/en12020206.
[45] M.H. Soulouknga, S.Y. Doka, N. Revanna, N. Djongyang, T.C.
Kofane (2018), “Analysis of wind speed data and wind energy potential in
Faya-Largeau, Chad, using Weibull distribution”, Renewable Energy, 121,
pp.1-8.
[30] PO.DAAC (2018), Cross-calibrated Multi-platform Ocean Surface
Wind Vector L3.5A Monthly First-look Analyses, Doi:10.5067/CCF3501AM1.
[46] A.F. Davenport (1965), “The relationship of wind structure to wind
loading”, Proc. Conf. on Wind Effects on Buildings & Structures, HMSO.
[31] V.Q. Doan, H. Kusaka, M. Matsueda, R. Ikeda (2019), “Application
of mesoscale ensemble forecast method for prediction of wind speed ramps”,
Wind Energy, 22(4), pp.499-508.
[32] A.M. Foley, P.G. Leahy, A. Marvuglia, E.J. McKeogh (2012),
“Current methods and advances in forecasting of wind power generation”,
Renewable Energy, 37(1), pp.1-8.
[33] P.G. Leahy and E.J. McKeogh (2013), “Persistence of low wind
speed conditions and implications for wind power variability”, Wind Energy,
16(4), pp.575-586.
[47] S.A. Hsu (1992), “An overwater stability criterion for the offshore
and coastal dispersion model”, Boundary-Layer Meteorology, 60(4), pp.397402.
[48] A.A. Teyabeen, F.R. Akkari, A.E. Jwaid (2017), “Power curve
modelling for wind turbines”, 2017 UKSim-AMSS 19th International
Conference on Computer Modelling & Simulation (UKSim).
[49] C. Carrillo, A.F.O. Montaño, J. Cidrás, E. Díaz-Dorado (2013),
“Review of power curve modelling for wind turbines”, Renewable and
Sustainable Energy Reviews, 21, pp.572-581.
[50] />
[34] AlexanderKies, B. Schysk, T.V. Dinh, L. Bremen, D. Heinemann, S.
Schramm (2017), “Large-scale integration of renewable power sources into
the Vietnamese power system”, Energy Procedia, 125, pp.207-213.
[51] C. Elkinton, A. Blatiak, H. Ameen (2014), Assessment of Ports for
Offshore Wind Development in the United States, GL Garrad Hassan, America.
[35] A. Malvaldi, S. Weiss, D. Infield, J. Browell, P. Leahy, A.M. Foley
(2017), “A spatial and temporal correlation analysis of aggregate wind power
in an ideally interconnected Europe”, Wind Energy, 20(8), pp.1315-1329.
[52] EREA (2019), “Wind power development in Vietnam, presentation at
the meeting on offshore wind development - Dutch experience and implication
to Vietnam”, Electricity and Renewable Energy Authority of Vietnam, Hanoi.
[36] P. Elsner (2019), “Continental-scale assessment of the African
offshore wind energy potential: spatial analysis of an under-appreciated
renewable energy resource”, Renewable and Sustainable Energy Reviews,
104, pp.394-407.
[53] V.L. Dang and G.T. Yeo (2017), “A competitive strategic position
analysis of major container ports in Southeast Asia”, The Asian Journal of
Shipping and Logistics, 33(1), pp.19-25.
[37] D. Kitsiou, M. Karydis, A.M. O’Hagan, E.P.J.O.A.S.K. Paterson,
M.L. Tissier (2017), Marine Spatial Planning: Methodologies, Environmental
Issues and Current Trends, New York: Nova Science.
[38] C. Ehler, J. Zaucha, K. Gee (2019), “Maritime/marine spatial
planning at the interface of research and practice”, Maritime Spatial Planning,
pp.1-21, Doi:10.1007/978-3-319-98696-8_1.
[39] C. White, B.S. Halpern, C.V. Kappel (2012), “Ecosystem service
tradeoff analysis reveals the value of marine spatial planning for multiple
ocean uses”, Proceedings of the National Academy of Sciences, 109(12),
pp.4696-4701.
[40] J.C. Day (2002), “Zoning - lessons from the Great Barrier Reef
Marine Park”, Ocean & Coastal Management, 45, pp.139-156.
[41] C. Desmond, J. Murphy, L. Blonk, W. Haans (2016), “Description
of an 8 MW reference wind turbine”, Journal of Physics: Conference Series,
16
Vietnam Journal of Science,
Technology and Engineering
[54] [accessed 02 05
2019].
[55] [accessed 10 05 2019].
[56] http://open_jicareport.jica.go.jp/pdf/11999976_02.pdf.
[57] [accessed 10
05 2019].
[58] />[59]b [accessed 08 05 2019].
[60] />[61] V.N. Dinh and H.X. Nguyen (2018), “Design of an offshore wind
farm layout”, Lecture Notes in Civil Engineering, Proceedings of the Vietnam
Symposium on Advances in Offshore Engineering, 18, pp.233-238.
March 2020 • Vol.62 Number 1