Nutrient index values and soil fertility ratings for available sulphur and micronutrients of Tiruchirappalli district of Tamil Nadu, India
Bạn đang xem bản rút gọn của tài liệu. Xem và tải ngay bản đầy đủ của tài liệu tại đây (518.25 KB, 11 trang )
Int.J.Curr.Microbiol.App.Sci (2020) 9(3): 337-347
International Journal of Current Microbiology and Applied Sciences
ISSN: 2319-7706 Volume 9 Number 3 (2020)
Journal homepage:
Original Research Article
/>
Nutrient Index Values and Soil Fertility Ratings for Available Sulphur and
Micronutrients of Tiruchirappalli District of Tamil Nadu, India
Abhishek Amar* and R. Shanmugasundaram
Department of Soil Science and Agricultural Chemistry Tamil Nadu Agricultural University
Coimbatore – 641 003, India
*Corresponding author
ABSTRACT
Keywords
Nutrients index
values, Soil fertility
rating, Available
sulphur, Micro
nutrients
Article Info
Accepted:
05 February 2020
Available Online:
10 March 2020
The nutrient index (NI) value for each of the nutrients is computed for the fourteen
blocks of Tiruchirappalli district from the percentage of samples that falls under
the category of high, medium and low. The NI value (2.17- 2.87) for available S,
in the most of blocks of Tiruchirappalli district was recorded the high nutrient
index value. The nutrient index value (1.43-2.50) for DTPA-Cu was very low in
Thirupparankundram, Melur, Chellampatty and Alanganallur, in case of
Manikandam block was falls in high category. The NI value (1.33-2.34) of
available Zn was found very low in the most of blocks, marungapuri block showed
high NI value. The NI values (2.54 to 3.00) for manganese was found in
Thiruverumbur and Marungapuri block with high nutrient index value. The NI
values (2.35-289) for DTPA-Fe was found that high in Thiruverumbur block, all
the remaining blocks fall under very high category. The NI value for boron was
recorded as (1.67 -2.56). Regarding fertility rating class in Tiruchirappalli district,
the available zinc and copper were very low. The available manganese, iron,
sulphur and boron were found to be under high category.
security of the country. However continuous
cropping of high yielding varieties without
proper substitution of inorganic fertilizers,
non-addition of micronutrients, and less or no
application of organic manures have caused
excessive removal of essential nutrients from
the soil reserves that eventually led to the
deficiencies of micronutrients in soils. The
deficiency may either be primarily due to
their low contents or secondarily by soil
factor that reduce the availability (Sharma and
Introduction
Agriculture is a very important sector for
sustained growth of Indian economy. About
70 percent of rural households and eight
percent of urban household are still dependent
on agriculture for employment. Soil is the
basic natural resource for crop production and
it supplies essential nutrients for plant growth,
the food security and necessary components
of human and animal food and the nutritional
337
Int.J.Curr.Microbiol.App.Sci (2020) 9(3): 337-347
Chaudhary, 2007). Global Positioning System
(GPS) and Geographical Information System
(GIS) helps in collecting a systematic set of
geo-referenced samples and generating spatial
data about the distribution of nutrients
(Sharma, 2004). The GPS can be effectively
used in conducting survey for updating the
existing base maps and mapping the extent of
spread of disease in crops and its monitoring
(Sood et al., 2004). Hence, the estimation,
characterization and comparison of spatial
variation of micronutrients are important
issues in the site-specific crop management,
precision farming and sustainable agriculture
(Nayak et al., 2006).
Description of study area
The present study area comprises the
Tiruchirappalli district consisting of 14
blocks. Major portion of the district is
covered by plain topography. Gneissic group
of rocks of Archean period consisting of
granitoid mica gneiss, granitic gneiss
leptinites, mixed and composite gneiss are
found at different places. The dominant
minerals found in the district are limestone,
gypsum, garnet sand and limonite. The
crystalline lime stones of Precambrian age are
mainly distributed in parts of Tiruchirappalli.
Deep black is the predominant soil in the
district accounting for 32.2 percent followed
by the deep red soil with 25.12 percent.
Soil nutrient maps covering large areas
improve understanding of the nature and
extent of nutrient problems, and aid in
determining their relationships with climate,
soil properties, and soil genetic characteristics
determined at similar scales. Intermediate
scale maps can be useful in delineating
specific areas where deficiencies or toxicities
are likely for agriculture, and in determining
localized soil characteristics that may be
associated with such problems. The thematic
maps for individual nutrient (Zn, Fe, Cu and
Mn) is prepared by using GIS software
(Minakshi et al., 2005 and Nayak et al., 2006)
and multi micronutrient maps are generated
by integrating individual maps of Fe, Mn, Zn
and Cu in the GIS (Sood et al., 2004). This
will also help in monitoring changes in
micronutrient status over a period of time. It
can be revisited with help of GPS, which is
otherwise not possible in the random
sampling.
Collection and processing
referenced surface soil samples
of
geo-
Totally 1584 geo-referenced surface soil
samples covering all the villages in fourteen
blocks of Tiruchirappalli district were
collected randomly at 0 - 15 cm depth by
adopting the standard procedures of soil
sample collection. The Global Positioning
System (GPS) data (Eastern Longitude and
Northern Latitude) were collected from each
sampling sites distributed over the entire
Tiruchirappalli district by using GPS.
The collected soil samples were air dried,
gently bound, sieved (2 mm sieve) and
preserved in serially labeled polythene bags
for further analysis. Locations of soil
sampling sites of Tiruchirappalli district were
marked on base map 1: 50,000 scale prepared
from State Revenue Maps and digitized using
Arc-GIS.
Materials and Methods
Nutrient index values and fertility rating
The geo-referenced surface soil samples were
collected from the villages of Tiruchirappalli
district to assess the available sulphur and
micronutrient status.
Nutrient Index Value was calculated from the
proportion of soils under low, medium and
high available nutrient categories, as
represented by
338
Int.J.Curr.Microbiol.App.Sci (2020) 9(3): 337-347
NIV=
[(PH*3)+ (PM*2)+ (PL*1)]
100
Available sulphur
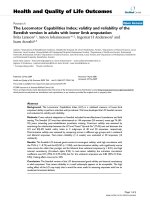
The NI value for available S ranged from 2.17
to 2.87 and rated as high. Most of the blocks
of Tiruchirappalli district recorded the high
nutrient index values with respect to available
S considering the critical limit of Sulphur as
10 mg kg-1.
Where,
NIV = the Nutrient Index Value
PL, PM and PH are the percentage of soil
samples falling in the category of low,
medium and high nutrient status and given
weightage of one, two and three respectively
(Ramamoorthy and Bajaj, 1969)
Available copper
1.67 - 2.0= Marginal 2.0 - 2.33= Adequate
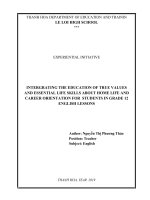
The NI values for Cu ranged from 1.43 to
2.50. The nutrient index values for DTPA-Cu
were very low in Thirupparankundram,
Melur, Chellampatty and Alanganallur. While
it was low in Andanallur, Uppliliapuram
blocks. The other blocks viz., Lalgudi,
Pullambadi,
Manachanallur,
Musiri,
Thathayangarpettai
and
Thiruverumbur
blocks were in marginal. Others remaining
were categorized under adequate scale.
Manikandam block falls in high category.
2.33 - 2.66= High
Available Zinc
The index values are rated into various
categories viz., very high (> 2.66), high (2.332.66), adequate (2.00-2.33), marginal (1.662.00), low (1.33-1.66) and very low (< 1.33)
for the nutrient supply.
Classification of nutrient index value
< 1.33 = Very low
1.33 - 1.66= Low
> 2.66 = Vey high
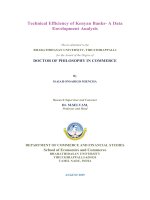
The NI value of Zn ranged from 1.13-2.34.
The nutrient index values of available zinc
were found to be very low in most of the
blocks of the district. Marungapuri block
showed high nutrient index value.
Results and Discussion
The present study was conducted with the
major objectives of assessment of nutrients
Index value and fertility rating each block in
Tiruchirappalli district for available Sulphur
and micronutrient.
Available manganese
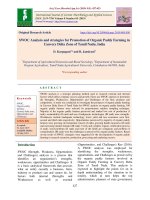
The NI values for manganese ranged from
2.54 to 3.00. Thiruverumbur and Marungapuri
block was found to be with high nutrient
index value. All the remaining blocks showed
very high nutrient index values.
Nutrient Index value and fertility rating at
district level
The nutrient index (NI) value for each of the
nutrients is computed for the fourteen blocks
of Tiruchirappalli district from the percentage
of samples that falls under the category of
high, medium and low. Based on the NI
values, the fertility rating of district is
classified as very low (<1.33), low (1.33 1.66), marginal (1.66 - 2.0), adequate (2.00 2.33), high (2.33 - 2.66) and very high
(>2.67).
Available iron
The NI value for DTPA-Fe ranged from 2.35
to 2.89. The nutrient index values of DTPAFe were found to be high in Thiruverumbur
block. All the remaining blocks fall under
very high category.
339
Int.J.Curr.Microbiol.App.Sci (2020) 9(3): 337-347
Fig.1 Nutrient index rating for available Sulphur in the soils of Tiruchirappalli District
Nutrient index rating classes for available Sulphur
340
Int.J.Curr.Microbiol.App.Sci (2020) 9(3): 337-347
Fig.2 Nutrient index rating for available Copper in the soils of Tiruchirappalli District
Nutrient index rating classes for available Copper
341
Int.J.Curr.Microbiol.App.Sci (2020) 9(3): 337-347
Fig.3 Nutrient index rating for available Zinc in the soils of Tiruchirappalli District
Nutrient index rating classes for available Zinc
342
Int.J.Curr.Microbiol.App.Sci (2020) 9(3): 337-347
Fig.4 Nutrient index rating for available Manganese in the soils of Tiruchirappalli District
Nutrient index rating classes for available Manganese
343
Int.J.Curr.Microbiol.App.Sci (2020) 9(3): 337-347
Fig.5 Nutrient index rating for available Iron in the soils of Tiruchirappalli District
Nutrient index rating classes for available Iron
344
Int.J.Curr.Microbiol.App.Sci (2020) 9(3): 337-347
Fig.6 Nutrient index rating for available boron in the soils of Tiruchirappalli District
Nutrient index rating classes for available Boron
345
Int.J.Curr.Microbiol.App.Sci (2020) 9(3): 337-347
The fertility status of HWS-B is found to be
adequate, as soils around neutral pH. Berger
and Troug (1944) reported that availability of
boron was comparatively more between pH
6.0 to 8.0 and it decrease below and above
this range.
Hot water soluble boron
The NI value for boron ranged from 1.67 to
2.56. The fertility status of available boron
was found to be high in Pullambad,
Marungapuri,
Manikandam
and
Thiruverumburi. All the remaining blocks fall
under adequate category.
Conclusions of the study are as follows
Nutrient index values refers to the rating of
nutrients based on their critical values and
based on the NI values, the soil fertility is
rated as low, medium and high.
Almost 64 per cent of the soils was deficient
in available Zn (63.82%) followed by
available Cu (40.11%), HWSB (16.18%) and
available sulphur (11.59%). Nearly 90 percent
of the soils of Tiruchirapalli district were
sufficient in DTPA-Fe and DTPA-Mn.
The critical limits of different nutrients are 10
- 15 mg kg-1 for S, 1.2 –1.8 mg kg-1 for
DTPA-Cu and DTPA-Zn, 2 – 4 mg kg-1 for
Mn, 3.7 – 8.0 mg kg-1 for DTPA-Fe and 0.46
– 1 mg kg-1 for HWS-B (Anon, 2003).
Ramamoorthy et al., (1969) gave the NI
ratings based on percentage of samples under
low,
medium
and
high
category.
By considering these ratings the data for
Tiruchirappalli district were grouped as very
low, low, marginal, adequate, high and very
high.
By comparing the thematic maps of available
nutrient status and fertility rating map based
on nutrient values, the more number of
classes were obtained in nutrient map. It will
be useful for delineating the blocks which are
deficient or the areas amenable for deficient
in ensuring period. This also help in site
specific
crop
oriented
micronutrient
application for ensuring crop growth.
Thus, from the above investigation it is very
clear that the soils of Tiruchirapalli district are
deficient in DTPA-Cu and Zn. Therefore to
overcome these deficiencies of these nutrients
it is necessary to supply these nutrients either
organically or inorganically. The availability
of B is sufficient in general and required to be
applied in specific situations as per need.
Available S was found to be very high in
Tiruchirappalli district which may be due to
presence of free gypsum in soil profile
(Sahrwat et al., 2007).
The fertility rating was high for DTPA-Mn
and it was high and very high for DTPA-Fe in
the entire district. It might be due to the fact
that all these areas are rice growing belts;
where under submerged conditions, Fe3+ is
converted into ferrous form which is more
available and easily soluble in water. In case
of Mn, increase of Mn (II) indicating that Mn
oxides in the soil phase serves as an electron
acceptor (Lu et al., 2004) by some fungi and
certain organic compounds synthesized by
some microbes or plants, as root exudates
having oxidising and reduction powers. These
results corroborate with the findings of Meena
et al., (2006).
References
Anon. 2003. Annual report of the All-India
Coordinated Scheme of Micro and
Secondary nutrients and polluted
elements in the soils and plants, Tamil
Nadu
Agricultural
University,
Coimbatore.
Berger, K.C. and H. Troug. 1944. Boron
availability in relation to soil reaction
and organic matter content. Soil Sci.
Sco. Am. Proc., 10: 113-116.
346
Int.J.Curr.Microbiol.App.Sci (2020) 9(3): 337-347
Lu, Shihua, Xuejun, Long Li, Fusuo Zhang,
Xiangzhong Zeng and Caixian Tang.
2004. Effect of manganese spatial
distribution in the soil profile on wheat
growth in rice wheat rotation. Plant and
Soil, 261: 39-46.
Meena, H.B., R.P Sharma and U.S. Rawat.
2006.
Status
of
macro
and
micronutrients in some soils of Tonk
district of Rajasthan. J. Indian Soc. Soil
Sci., 54: 508-512.
Minakshi, N.S., V.K. Tur Nayyar, P.K.
Sharma and A.K. Sood. 2005. Spatial
distribution of micronutrients in soils of
Patiala district - A GIS approach. J.
Indian Soc. Soil Sci., 53(3): 324-329.
Nayak, A.K., A.R. Chyinchamalatpure, G.
Gururaja Rao, M.K. Khandelwal and
N.K. Tyagi. 2006. Spatial variability of
DTPA extractable micronutrients in
soils of Bara tract of Sardar Sarovar
canal command in Gujarat state India. J.
Indian Soc. Soil Sci., 42: 137-145.
Ramamoorthy, B and J.C. Bajaj. 1969.
Available N, P and K status of Indian
soils. Fertilizer News, 14: 24-26.
Sahrawat, K.L., S.P. Wani, T.J. Rego, G.
Pardhasaradhi and K.V.S. Murthy.
2007. Widespread deficiencies of
sulphur, boron and zinc in dryland soils
of the Indian semi arid tropics. Curr.
Sci., 93(10): 1428-1432.
Sharma, J.C. and K. Chaudhary. 2007.
Vertical Distribution of Micronutrient
cations in relation to soil characteristics
in lower Shiwaliks of Solan district in
North-West Himalayas. J. Indian Soc.
Soil Sci., 55: 40-44.
Sharma, P.K. 2004. Emerging technologies of
remote sensing and GIS for the
development of spatial data structure. J.
Indian Soc. Soil Sci., 52 (4): 384-406.
Sood, A., R.K. Setia, R.L. Bansal, P.K.
Sharma and V.K. Nayyar. 2004. Spatial
distribution of micronutrients in soils of
Amritsar
district
using
frontier
technologies. In: Proceedings of 7th
Punjab Sci., Congress. February 7-9
held at Guru Nanak Dev. University,
Amritsar.
How to cite this article:
Abhishek Amar and Shanmugasundaram, R. 2020. Nutrient Index Values and Soil Fertility
Ratings for Available Sulphur and Micronutrients of Tiruchirappalli District of Tamil Nadu,
India. Int.J.Curr.Microbiol.App.Sci. 9(03): 337-347.
doi: />
347