Effect of potassium levels, sources and time of application on storage life of onion (Allium cepa L.)
Bạn đang xem bản rút gọn của tài liệu. Xem và tải ngay bản đầy đủ của tài liệu tại đây (417.22 KB, 12 trang )
Int.J.Curr.Microbiol.App.Sci (2018) 7(7): 4226-4237
International Journal of Current Microbiology and Applied Sciences
ISSN: 2319-7706 Volume 7 Number 07 (2018)
Journal homepage:
Original Research Article
/>
Effect of Potassium Levels, Sources and Time of Application
on Storage Life of Onion (Allium cepa L.)
B. R. Kumara1*, C. P. Mansur1, S. L. Jagadeesh1, R. K. Mesta1, D. Satish1,
Shankar Meti1, Girish Chander2, S. P. Wani2, T. B. Allolli1 and Sanjeev Reddy1
1
Department of Horticulture, College of Horticulture, UHS, Bagalkot, Karnataka, India
2
ICRISAT- International Crops Research Institute for Semi-Arid Tropics, Patancheru,
Telangana, India
*Corresponding author
ABSTRACT
Keywords
Onion, Bulbs,
Storage, MOP, SOP
Article Info
Accepted:
28 December 2017
Available Online:
10 July 2018
The present investigation on “Effect of potassium levels, sources and time of application
on storage life of onion var. ArkaKalyan” was carried out at the College of Horticulture,
Bagalkot, Karnataka during Kharif season crop of 2015 and 2016.The physiological loss in
weight and rotting and sprouting of onion bulbs was minimum in 200 per cent RDK (19.25
and 13.91%, respectively) and maximum was recorded in 100 per cent RDK (23.40 and
18.13%, respectively). The marketable bulbs of onion was recorded highest in 200 per cent
RDK (77.51%) and lowest marketable bulbs was recorded in 100 per cent RDK (71.96%)
followed by 175 per cent RDK. The physiological loss in weight and rotting and sprouting
of onion bulbs was minimum in potassium sources as SOP (21.12 and 15.09%) over MOP
(22.60 and 16.50 per cent respectively). The marketable bulbs of onion was highest in
potassium sources as SOP (76.01%, respectively) over MOP (74.43%). The increased
marketable bulb yield and reduced the physiological loss in weight and rotting and
sprouting onion bulb with the application 50 per cent potassium at transplanting and 50 per
cent K at 30 DAT over 100 per cent potassium at transplanting.
Introduction
Onion (Allium cepa L.) is one of the important
commercial
bulbous
crops
cultivated
extensively in India and it belongs to the
family Alliaceae. It is a most widely grown
and popular crop among the Alliums. The
primary centre of origin of onion lies in
Central Asia (Vavilov, 1951) and the near East
and the Mediterranean regions are the
secondary centres of origin. It is an ancient
crop utilized in medicine, rituals and as a food
in Egypt and in India since 600 BC.
References of onion as food were also found
in Bible and Quran. Onion bulb is strongly
contracted subterranean shoot with thickened,
fleshy leaves as food organ. The bulb is
composed of carbohydrates (11.0 g), proteins
(1.2 g), fibre (0.6 g), moisture (86.8 g) and
energy (38 cal.), vitamins like ascorbic acid
(11 mg), thiamine (0.08 mg), riboflavin (0.01
mg) and niacin (0.2 mg) and minerals like
phosphorus (39 mg), calcium (27 mg), sodium
(1.0 mg), iron (0.7 mg) and potassium (1.57
4226
Int.J.Curr.Microbiol.App.Sci (2018) 7(7): 4226-4237
mg) per 100 g edible portion (Rahman et al.,
2013). Onion is mainly used for its flavour
and pungency. The component which is
responsible for pungency in onion is an
alkaloid "Allyl propyl disulphide".
India is the second largest producer of onion
in the world next to china, accounting 22.60
per cent of the world production. In India,
onion is being grown in an area of 12.03 lakh
ha with the annual production of 194.01 lakh
MT and the productivity is 16.10 MT ha-1.
Among onion growing states Maharashtra
stands first followed by Karnataka, Gujarat,
Bihar, Madhya Pradesh, Andhra Pradesh,
Rajasthan, Haryana, Uttar Pradesh and Tamil
Nadu. In Karnataka, onion is cultivated in an
area of 1.36 lakh hectare with production of
20.65 lakh tones and the average productivity
is 15.10 MT ha-1 (Anon., 2015), which is low
compared to world average. This illustrates
the poor productivity and shelf life of onions
produced during kharif. Several factors viz.,
lack of suitable varieties, poor nutrient
management practices and improper storage
techniques have been identified as major
causes for poor productivity, quality and
storability of kharifonion. Onion being semiperishable crop gets deteriorated during
storage, transportation and marketing. Due to
storage losses, it cannot be guaranteed that
whole amount of the total production is
consumed by the people.
The onion produce is available in market
during October-November (20%) as kharif
crop, January-February (20%) as late kharif
crop and April-May (60%) as rabi crop. The
rabicrop harvested in April-May is stored all
over the country and slowly made available
for domestic supply as well as for export up to
October-November. There is a critical gap in
supply in the country from OctoberDecember and as a result the prices shoot up.
The good harvest in kharif season tries to
bridge the gap. If there is failure of kharif crop
due to vagaries of monsoon further rise the
prices. The kharif crop therefore is more
sensitive and vulnerable, yet essential. This is
the critical period in the whole country, where
there isno fresh harvest of onions and hence,
storage assumes paramount importance for
steady supply. Nearly two million tonnes need
to be stored during this period (Tripathi and
Lawande, 2003).Being high in water content,
onion is a delicate commodity to store. Serious
losses occur due to rotting, sprouting,
physiological loss in weight and moisture
evaporation. Therefore, the crop requires
special procedure and parameters for storage.
But, due to non-availability of appropriate
post-harvest storage facilities, 25-30% of the
total onions produced are wasted and it
amounts to crores of rupees (Chopra, 2010). In
general, the losses due to reduction in weight,
sprouting and rotting were found to be 20 to
25 per cent, 4 to 8 per cent and 8 to 12 per
cent respectively (Sharma, et al., 2012).
Stage of harvesting plays a major role in
determining the shelf life of onions as it is
linked with physiological maturity of bulbs.
The onion bulbs are cured either in field or in
open shade or by artificial means before
storage. During kharif season, bulbs are cured
for 2-3 weeks along with top. In rabi, bulbs
are cured in field for 3-5 days, tops are cut
leaving 2-2.5 cm above bulb and again cured
for 7-10 days in shade to remove field heat
(Gopalakrishnan, 2010).
The present investigation is alarmed with the
objectives. To study the effect of different
methods of application, sources, potassium
levels on storage life of onion.
Materials and Methods
The present investigation on “Effect of
potassium levels, sources and time of
application on storage life of onion var.
ArkaKalyan” was carried out at the College of
4227
Int.J.Curr.Microbiol.App.Sci (2018) 7(7): 4226-4237
Horticulture, Bagalkot, Karnataka during
Kharif season of 2015 and 2016. The details
of the materials used and the techniques
adopted during the investigation are outlined
in this chapter. Bagalkot is situated in the
Northern Dry Zone (Zone-3) of Karnataka.
The centre is located at 75° 42' East longitude
and 16° 10' North latitude with an altitude of
542.00 m above Mean Sea Level (MSL). The
district is grouped under arid and semi-arid
region with mean annual rainfall of 517.3 mm
and mean temperature of 32.6°C.The soil of
the experimental site was red sandysoil.
Experimental details
Treatments: 20 (5 × 2 × 2)
Design: Factorial R.B.D
Replications: Three
Season: Kharif
Variety: ArkaKalyan
Spacing: 15 cm × 10 cm
Plot size: 2.1 m × 2.0 m
Fertilizer dose: 125: 75: 125 kg NPK ha-1
Location: Haveli farm, COH, Bagalkot
Storage period: Three months under ambient
condition
Note: Recommended dose of NP @ 125:75 kg
and FYM @ 30 t ha-1 was applied commonly
to all the treatments and nitrogen was applied
50 % at transplanting and 50 % at 30 days
after transplanting.
The cured onion bulbs were sorted out and
five kg healthy bulbs from each treatment
were packed in thin gunny bag of size 45 x 60
cm and kept in laboratory for storage studies.
The shelf life studies were conducted in the
laboratory of Horticulture, University of
Horticultural Sciences, Bagalkot. The onions
after harvest was kept for curing along with
the top under shade (in well ventilated room)
for 8-10 days. Therefore the shelf life
assessment of bulbs were selected randomly
from three replications in the experiment.
Then, from each treatment three replications
were made consisting of five kg bulbs in each
treatment. The observations were recorded
from 15 days after storage to 90 days of
storage at the interval of 30 days.
The details of the methodology adopted for
recording
these
observations
during
experimentation are described below.
Treatment details
Physiological loss in weight (PLW %)
Factor I: Levels of potassium
The loss in weight was obtained by taking
difference between the weight of bulbs prior
to storage and weight after storage taken every
30 days intervals for three months. The per
cent reduction in the initial weight was
computed by using following formula.
100% RDK + RDNP&FYM (K1)
125% RDK + RDNP&FYM (K2)
150% RDK + RDNP&FYM (K3)
175% RDK + RDNP&FYM (K4)
200% RDK + RDNP&FYM (K5)
Factor II: Sources of potassium: 1. MOP (S1),
2. SOP (S2)
Initial weight of bulbs – Final weight of bulbs
PLW (%) = ---------------------------------- x 100
Initial weight of bulbs
Factor III: Time of application;
Sprouting (%)
100% K at transplanting (T1)
50% K at transplanting and 50% K at 30 DAT
(T2)
For determining the sprouting percentage on
stipulated days after storage, the bulbs
showing a sprout were separated from the lot
4228
Int.J.Curr.Microbiol.App.Sci (2018) 7(7): 4226-4237
and weighed on an electronic balance. The
sprouting percentage, which indicated the
weight of the bulbs sprouted at 30, 60 and 90
DAS was calculated by using the formula
given below.
Weight of the sprouted bulbs
Sprouting (%) = ---------------------------- x 100
Initial weight of the bulbs
Rotting (%)
For determining the rotting percentage on
stipulated days after storage, the bulbs
showing a rot were separated from the lot and
weighed on an electronic balance. The rotting
percentage, which indicated the weight of the
bulbs rotten at 30, 60 and 90 DAS was
calculated by using the formula given below.
Weight of the rotten bulbs
Rotting (%) = ------------------------------- x 100
Initial weight of the bulbs
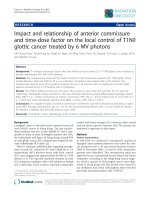
Physiological loss in weight of onion bulbs at
all the storage days differed significantly by
potassium levels during both the years as well
as in pooled data. At 30 DAS, the pooled data
recorded the physiological loss in weight of
onion bulbs was significantly minimum in
200% RDK (6.77 %) over 100%, 125% and
150% RDK (9.82, 8.68 and 8.23 %,
respectively) but was on par with 175% RDK
(7.31%) and maximum physiological loss in
weight was recorded in 100% RDK. At 60
DAS, the minimum physiological loss in
weight was recorded significantly in 200%
RDK (15.47%) over 100%, 125%, 150 and
175% RDK (19.77, 18.99, 18.87 and 17.90,
respectively) and maximum physiological loss
in weight was observed in 100% RDK. At 90
DAS, the pooled data showed that the
physiological loss in weight of onion bulbs
was significantly minimum in 200% RDK
(19.25%) over 100%, 125%, 150% and 175%
RDK (23.40, 22.62, 22.50 and 21.53%,
respectively) and maximum physiological loss
in weight was recorded in 100% RDK.
Marketable bulbs (%)
At the end of each storage period at 30, 60 and
90 days after storage (DAS), the rotten and
sprouted bulbs were separated and the weight
of healthy bulbs was recorded. The recovery
of marketable bulbs was calculated by using
the following formula.
Weight of the healthy bulbs obtained
Marketable bulbs (%) = ------------------- x 100
Initial weight of the bulbs stored
Results and Discussion
Physiological loss in weight (%)
The data pertaining to physiological loss in
weight (%) of onion bulbs recorded at 30, 60
and 90 days after storage (DAS) under
ambient conditions during 2015, 2016 and
pooled data are presented in Table 1.
Physiological loss in weight of onion bulbs
varied significantly by potassium sources
during both the years as well as in pooled data
of onion storage. At 30 DAS, pooled data
indicated that the physiological loss in weight
of onion bulbs was significantly minimum in
potassium sources as SOP (7.78%) over MOP
(8.54%). At 60 and 90 DAS, in pooled data
significantly minimum in potassium sources
as SOP (17.43 and 21.12%, respectively) over
MOP (18.97 and 22.60%, respectively).
Time of potassium application influenced the
physiological loss in weight of onion bulbs
during both the years and in pooled data. In
pooled data, at 30 DAS, the minimum
physiological loss in weight was recorded
significantly with application of 50%
potassium at transplanting and 50% at 30
DAT (7.87%) over 100 % potassium
application at transplanting (8.45%). At 60
4229
Int.J.Curr.Microbiol.App.Sci (2018) 7(7): 4226-4237
and 90 DAS, the minimum physiological loss
in weight was recorded significantly by
application of 50% potassium at transplanting
and 50% at 30 DAT (17.72 and 21.38,
respectively) over 100% potassium at
transplanting
(18.66
and
22.32%,
respectively).
Interaction effects of potassium levels, sources
and time of application on physiological loss
in weight of onion bulbs differed significantly
during both the years as well as in pooled data
during 60 and 90 days after storage under
ambient condition except 30 DAS. In pooled
data at 60 DAS, the treatment combination of
K5S2T2 (200% RDK, SOP with application of
50% potassium at transplanting and 50% at 30
DAT) was recorded significantly minimum
physiological loss in weight of onion bulbs
(12.91%) over rest of the treatment
combinations and maximum physiological
loss in weight of onion bulbs was recorded in
K1S1T1 (21.79%). At 90 DAS, in pooled data,
the treatment combination of K5S2T2 (200%
RDK, SOP with application of 50% potassium
at transplanting and 50% at 30 DAT) was
recorded significantly minimum physiological
loss in weight of onion bulbs (16.84%) over
rest of the treatment combinations and
maximum physiological loss in weight of
onion bulbs was recorded in K1S1T1 (25.42%)
but was on par with K5S2T1 (17.64%).
Rotting and sprouting (%)
The data pertaining to rotting and sprouting
(%) of onion bulbs recorded at 30, 60 and 90
days after storage (DAS) under ambient
conditions during 2015, 2016 and pooled data
are presented in Table 2.
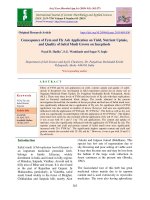
Rotting and sprouting of onion bulbs at all the
storage days differed significantly by
potassium levels during both the years as well
as in pooled data. At 30 DAS, in pooled data
observed the rotting and sprouting of onion
bulbs was significantly minimum in 200%
RDK (2.01 %) over 100%, 125% 150% and
175% RDK (3.88, 3.31, 2.83 and 2.81%,
respectively) and maximum rotting and
sprouting was recorded in 100% RDK. At 60
DAS, the 200% RDK recorded significantly
minimum rotting and sprouting (6.89%) over
100%, 125%, 150 and 175% RDK (9.42, 8.30,
8.00 and 7.63%, respectively) and maximum
rotting and sprouting was observed in 100%
RDK. At 90 DAS, the pooled data showed that
the rotting and sprouting of onion bulbs was
significantly minimum in 200% RDK
(13.91%) over 100%, 125%, 150% and 175%
RDK (18.13, 15.81, 15.47 and 15.64%,
respectively) and maximum rotting and
sprouting was recorded in 100% RDK.
Rotting and sprouting of onion bulbs varied
significantly by potassium sources during both
the years as well as in pooled data of onion
storage. At 30, 60 and 90 DAS, in pooled data
indicated that the rotting and sprouting of
onion bulbs was significantly minimum in
potassium sources as SOP (2.40, 7.86 and
15.09%, respectively) over MOP (3.54, 8.24
and 16.50%, respectively).
Time of potassium application influenced the
rotting and sprouting of onion bulbs during
both the years as well as in pooled data. In
pooled data, at 30, 60 and 90 DAS, the
minimum rotting and sprouting was recorded
significantly with application of 50%
potassium at transplanting and 50% at 30
DAT (2.58, 7.75 and 15.23%, respectively)
over 100 % potassium application at
transplanting (3.35, 8.33 and 16.35%,
respectively).
Interaction effects of potassium levels, sources
and time of application on rotting and
sprouting of onion bulbs differed significantly
at 60 days after storage except at 30 and 90
DAS. In pooled data at 60 DAS, the treatment
combination of K5S2T2 (200% RDK, SOP
4230
Int.J.Curr.Microbiol.App.Sci (2018) 7(7): 4226-4237
with application of 50% potassium at
transplanting and 50% at 30 DAT) was
recorded significantly minimum rotting and
sprouting of onion bulbs (5.75%) over rest of
the treatment combinations and maximum
rotting and sprouting of onion bulbs was
recorded in K1S1T1 (10.81%). At 90 DAS, in
pooled data, the treatment combination of
K5S2T2 (200% RDK, SOP with application of
50% potassium at transplanting and 50% at 30
DAT) was recorded minimum rotting and
sprouting of onion bulbs (12.69%) over rest of
the treatment combinations and maximum
rotting and sprouting of onion bulbs was
recorded in K1S1T1 (19.58%).
Marketable bulbs (%)
The data pertaining to marketable bulbs (%) of
onion recorded at 30, 60 and 90 days after
storage (DAS) under ambient conditions
during 2015, 2016 and pooled data are
presented in Table 3.
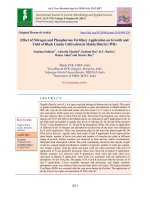
Marketable bulbs of onion at all the storage
days differed significantly by potassium levels
during both the years as well as in pooled data.
At 30 DAS, in pooled data recorded the
marketable bulbs of onion was significantly
highest in 200% RDK (89.74 %) over 100%,
125%, 150% and 175% RDK (85.52, 87.67,
88.03 and 88.31%, respectively) and
significantly lowest marketable bulbs was
recorded in 100% RDK.
At 60 DAS, 200% RDK recorded significantly
highest marketable bulbs (84.35%) over
100%, 125% and 150% RDK (78.80, 81.22
and 82.83%, respectively) but was on par with
175% RDK (83.10%) and significantly lowest
marketable bulbs was observed in 100% RDK.
At 90 DAS, the pooled data showed that the
marketable bulbs of onion was significantly
highest in 200% RDK (77.51%) over 100%,
125% and 150% RDK (71.96, 74.39 and
76.00%, respectively) but was on par with
175% RDK (76.26%) andthe lowest
marketable bulbs was recorded in 100% RDK.
Marketable bulbs of onion varied significantly
by potassium sources during both the years as
well as in pooled data of onion storage. At 30,
60 and 90 DAS, in pooled data indicated that
the marketable bulbs of onion was
significantly highest in potassium sources as
SOP (88.67, 82.85 and 76.01%, respectively)
over MOP (87.16, 81.27 and 74.43%,
respectively).
Time of potassium application influenced the
marketable bulb of onion during both the
years as well as in pooled data. In pooled data
at 30, 60 and 90 DAS, the highest marketable
bulbs of onion was recorded significantly with
application of 50% potassium at transplanting
and 50% at 30 DAT (88.37, 82.39 and
75.55%, respectively) over 100 % potassium
application at transplanting (87.46, 81.61 and
74.88%, respectively).
Interaction effects of potassium levels, sources
and time of application on marketable bulbs of
onion did not differ significantly during both
the years and in pooled at 30, 60 and 90 days
after storage. At 90 DAS, in pooled data, the
treatment combination of K5S2T2 (200% RDK,
SOP with application of 50% potassium at
transplanting and 50% at 30 DAT) was
recorded minimum marketable bulbs of onion
bulbs (79.09%) over rest of the treatment
combinations and maximum marketable bulbs
of onion was recorded in K1S1T1 (70.36%).
Physiological loss in weight of onion bulbs at
all the storage days differed significantly by
potassium levels. At 30, 60 and 90 DAS, the
physiological loss in weight of onion bulbs
(pooled data) was significantly minimum in
200 per cent RDK (6.77, 15.47 and 19.25%,
respectively) and maximum physiological loss
in weight was recorded in 100 per cent RDK
(9.82, 19.77 and 23.40%, respectively).
4231
Int.J.Curr.Microbiol.App.Sci (2018) 7(7): 4226-4237
Table.1 Effect of potassium levels, sources and time of application on physiological loss in
weight (PLW %) of onion var. ArkaKalyan stored under ambient condition
Treatment
2015
Potassium levels (k)
K1-100 % RDK
K2-125 % RDK
K3-150 % RDK
K4-175 % RDK
K5-200 % RDK
S.Em±
C.D. (p= 0.05)
Potassium sources (S)
S1- Muriate of potash
(MOP)
S2- Sulphate of potash
(SOP)
S.Em±
C.D. (p= 0.05)
Time of application (T)
T1- 100 % K at
transplanting
T2- 50 % K at transplanting
& 50 % K at 30 DAT
S.Em±
C.D. (p= 0.05)
Interactions
K1S1T1
K1S1T2
K1S2T1
K1S2T2
K2S1T1
K2S1T2
K2S2T1
K2S2T2
K3S1T1
K3S1T2
K3S2T1
K3S2T2
K4S1T1
K4S1T2
K4S2T1
K4S2T2
K5S1T1
K5S1T2
K5S2T1
K5S2T2
S.Em±
C.D. (p= 0.05)
Physiological loss in weight (%)
Day after storage (DAS)
30 DAS
60 DAS
2016
Poole
2015
2016
Poole
2015
d
d
90 DAS
2016
Poole
d
9.69
8.83
8.42
7.71
6.93
0.22
0.64
9.94
8.53
8.05
6.92
6.60
0.38
1.10
9.82
8.68
8.23
7.31
6.77
0.21
0.59
19.72
19.57
19.47
18.14
15.77
0.25
0.73
19.82
18.41
18.27
17.65
15.16
0.19
0.55
19.77
18.99
18.87
17.90
15.47
0.17
0.49
23.51
22.10
21.96
21.34
18.85
0.19
0.55
23.29
23.14
23.04
21.71
19.66
0.25
0.72
23.40
22.62
22.50
21.53
19.25
0.16
0.46
8.58
8.50
8.54
19.47
18.46
18.97
22.15
23.04
22.60
8.06
7.51
7.78
17.59
17.26
17.43
20.95
21.29
21.12
0.14
0.40
0.24
0.69
0.13
0.37
0.16
0.46
0.12
0.35
0.11
0.31
0.12
0.35
0.16
0.45
0.10
0.29
8.52
8.37
8.45
19.12
18.20
18.66
21.89
22.76
22.32
8.10
7.64
7.87
17.93
17.51
17.72
21.20
21.56
21.38
0.14
0.40
0.24
0.69
0.13
0.37
0.16
0.46
0.12
0.35
0.11
0.31
0.12
0.35
0.16
0.45
0.10
0.29
10.17
9.83
9.82
8.97
9.14
8.83
8.76
8.59
9.02
8.28
8.50
7.87
8.06
7.89
7.46
7.42
7.53
7.02
6.80
6.37
0.45
NS
11.89
10.98
9.63
7.27
9.00
8.73
8.67
7.72
8.28
8.08
8.38
7.45
7.33
6.90
7.10
6.33
7.02
6.83
6.43
6.13
0.77
NS
11.03
10.41
9.73
8.12
9.07
8.78
8.72
8.16
8.65
8.18
8.44
7.66
7.70
7.40
7.28
6.88
7.28
6.93
6.62
6.25
0.41
NS
21.89
19.44
18.83
18.74
20.35
18.65
19.92
19.36
20.33
19.98
19.73
17.82
18.99
18.09
19.04
16.44
19.10
17.93
13.11
12.97
0.51
1.46
21.69
19.39
19.13
19.07
18.46
18.28
18.22
18.67
19.37
17.97
17.98
17.78
18.12
17.82
17.82
16.86
17.04
16.49
14.25
12.84
0.39
1.11
21.79
19.42
18.98
18.91
19.41
18.47
19.07
19.02
19.85
18.98
18.86
17.80
18.56
17.96
18.43
16.65
18.07
17.21
13.68
12.91
0.34
0.98
25.38
23.08
22.82
22.76
22.15
21.97
21.91
22.36
23.06
21.66
21.67
21.47
21.81
21.51
21.51
20.55
20.73
20.18
17.94
16.53
0.39
1.11
25.46
23.01
22.40
22.31
23.92
22.22
23.49
22.93
23.90
23.55
23.30
21.39
22.56
21.66
22.61
20.01
22.67
21.50
17.34
17.14
0.50
NS
25.42
23.05
22.61
22.54
23.04
22.10
22.70
22.65
23.48
22.61
22.49
21.43
22.19
21.59
22.06
20.28
21.70
20.84
17.64
16.84
0.32
0.92
DAT – Days after transplanting, DAS – Days after storage, NS-Non significant.
Note: Recommended dose of N:P at 125:75 kg and farmyard manure 30 t ha -1 was applied commonly to all the
treatments and nitrogen was applied 50 % at transplanting and 50 % at 30 DAT.
4232
Int.J.Curr.Microbiol.App.Sci (2018) 7(7): 4226-4237
Table.2 Effect of potassium levels, sources and time of application on rotting and sprouting (%)
of onion var. ArkaKalyan stored under ambient condition
Treatment
2015
Potassium levels (k)
K1-100 % RDK
K2-125 % RDK
K3-150 % RDK
K4-175 % RDK
K5-200 % RDK
S.Em±
C.D. (p= 0.05)
Potassium sources (S)
S1- Muriate of potash
(MOP)
S2- Sulphate of potash
(SOP)
S.Em±
C.D. (p= 0.05)
Time of application (T)
T1- 100 % K at
transplanting
T2- 50 % K at transplanting
& 50 % K at 30 DAT
S.Em±
C.D. (p= 0.05)
Interactions
K1S1T1
K1S1T2
K1S2T1
K1S2T2
K2S1T1
K2S1T2
K2S2T1
K2S2T2
K3S1T1
K3S1T2
K3S2T1
K3S2T2
K4S1T1
K4S1T2
K4S2T1
K4S2T2
K5S1T1
K5S1T2
K5S2T1
K5S2T2
S.Em±
C.D. (p= 0.05)
Rotting and sprouting (%)
Day after storage (DAS)
30 DAS
60 DAS
2016
Poole
2015
2016
Poole
2015
d
d
90 DAS
2016
Poole
d
3.33
3.37
3.06
3.10
2.04
0.32
0.93
4.43
3.25
2.60
2.51
1.99
0.36
1.03
3.88
3.31
2.83
2.81
2.01
0.24
0.67
9.57
8.60
8.20
8.06
6.91
0.21
0.60
9.27
8.00
7.80
7.19
6.87
0.14
0.41
9.42
8.30
8.00
7.63
6.89
0.12
0.35
17.02
14.54
14.48
14.81
12.81
0.73
2.10
19.25
17.09
16.47
16.47
15.00
0.67
1.92
18.13
15.81
15.47
15.64
13.91
0.68
1.94
3.66
3.42
3.54
8.50
7.97
8.24
15.48
17.52
16.50
2.30
2.50
2.40
8.03
7.68
7.86
13.98
16.19
15.09
0.21
0.59
0.23
0.65
0.15
0.43
0.13
0.38
0.09
0.26
0.08
0.22
0.46
1.33
0.42
1.22
0.43
1.23
3.39
3.30
3.35
8.62
8.04
8.33
15.31
17.39
16.35
2.56
2.60
2.58
7.91
7.59
7.75
14.14
16.31
15.23
0.21
0.59
0.23
0.65
0.15
0.43
0.13
0.38
0.09
0.26
0.08
0.22
0.46
NS
0.42
NS
0.43
NS
4.51
3.93
2.93
1.97
4.88
3.01
3.07
2.51
4.07
4.04
2.11
2.05
4.72
2.71
2.67
2.31
2.97
1.80
2.05
1.36
0.65
NS
5.55
4.46
4.10
3.61
4.05
2.95
3.33
2.67
3.07
2.61
2.72
2.02
3.67
2.50
2.14
1.74
3.00
2.33
1.41
1.20
0.72
NS
5.03
4.20
3.52
2.79
4.47
2.98
3.20
2.59
3.57
3.33
2.42
2.04
4.20
2.61
2.41
2.03
2.99
2.07
1.73
1.28
0.47
NS
11.32
10.12
8.38
8.46
10.36
6.98
8.62
8.46
7.50
7.42
9.08
8.80
8.54
8.14
8.88
6.67
6.80
7.84
6.81
6.18
0.42
1.20
10.30
9.78
8.52
8.46
7.66
7.42
8.74
8.18
8.57
5.87
8.28
8.46
6.80
7.84
7.19
6.93
7.75
7.70
6.71
5.32
0.29
0.82
10.81
9.95
8.45
8.46
9.01
7.20
8.68
8.32
8.04
6.65
8.68
8.63
7.67
7.99
8.04
6.80
7.28
7.77
6.76
5.75
0.25
0.71
18.34
17.31
17.03
15.38
15.79
14.24
14.25
13.87
14.91
15.65
14.98
12.38
15.89
15.51
14.95
12.91
14.31
12.85
12.72
11.37
1.47
NS
20.82
19.80
18.50
17.87
17.80
16.72
17.47
16.35
17.39
17.04
16.57
14.86
17.82
16.43
16.74
14.88
16.14
15.18
14.67
14.00
1.34
NS
19.58
18.56
17.77
16.63
16.80
15.48
15.86
15.11
16.15
16.35
15.78
13.62
16.86
15.97
15.85
13.90
15.23
14.02
13.70
12.69
1.36
NS
DAT – Days after transplanting, DAS – Days after storage, Note: Recommended dose of N:P at 125:75 kg and
farmyard manure 30 t ha-1 was applied commonly to all the treatments and nitrogen was applied 50 % at
transplanting and 50 % at 30 DAT.
4233
Int.J.Curr.Microbiol.App.Sci (2018) 7(7): 4226-4237
Table.3 Effect of potassium levels, sources and time of application on marketable bulbs (%) of
onion var. ArkaKalyan stored under ambient condition
Treatment
2015
Potassium levels (k)
K1-100 % RDK
K2-125 % RDK
K3-150 % RDK
K4-175 % RDK
K5-200 % RDK
S.Em±
C.D. (p= 0.05)
Potassium sources (S)
S1- Muriate of potash
(MOP)
S2- Sulphate of potash
(SOP)
S.Em±
C.D. (p= 0.05)
Time of application (T)
T1- 100 % K at
transplanting
T2- 50 % K at transplanting
& 50 % K at 30 DAT
S.Em±
C.D. (p= 0.05)
Interactions
K1S1T1
K1S1T2
K1S2T1
K1S2T2
K2S1T1
K2S1T2
K2S2T1
K2S2T2
K3S1T1
K3S1T2
K3S2T1
K3S2T2
K4S1T1
K4S1T2
K4S2T1
K4S2T2
K5S1T1
K5S1T2
K5S2T1
K5S2T2
S.Em±
C.D. (p= 0.05)
30 DAS
2016
Poole
d
Marketable bulbs (%)
Day after storage (DAS)
60 DAS
2015
2016
Poole
d
2015
90 DAS
2016
Poole
d
87.16
88.41
88.47
87.85
90.03
0.65
1.86
84.49
86.94
87.59
88.77
89.45
0.72
2.07
85.52
87.67
88.03
88.31
89.74
0.49
1.40
79.13
80.65
82.20
82.37
83.81
0.87
2.49
78.47
81.80
83.47
83.82
84.88
0.53
1.53
78.80
81.22
82.83
83.10
84.35
0.48
1.37
71.76
75.09
76.76
77.11
78.17
0.53
1.53
72.17
73.69
75.23
75.41
76.85
0.87
2.49
71.96
74.39
76.00
76.26
77.51
0.48
1.37
87.57
86.75
87.16
80.82
81.72
81.27
75.01
73.86
74.43
89.19
88.15
88.67
82.44
83.26
82.85
76.55
75.48
76.01
0.41
1.17
0.46
1.31
0.31
0.88
0.55
1.57
0.34
0.96
0.30
0.86
0.34
0.96
0.55
1.57
0.30
0.86
87.89
87.03
87.46
81.25
82.18
81.61
75.47
74.29
74.88
88.87
87.86
88.37
81.99
82.79
82.39
76.08
75.03
75.55
0.41
NS
0.46
NS
0.31
0.88
0.55
NS
0.34
NS
0.30
NS
0.34
NS
0.55
NS
0.30
NS
85.52
87.27
87.59
88.24
87.53
87.78
88.77
89.55
87.62
88.21
88.27
89.78
86.50
87.76
88.63
88.52
87.73
89.81
90.74
91.84
1.30
NS
83.43
84.11
84.72
85.70
85.85
86.92
86.96
88.03
86.79
87.44
87.63
88.52
87.31
88.72
89.01
90.05
88.05
88.85
90.59
90.30
1.45
NS
84.48
85.69
86.16
86.97
86.69
87.35
87.87
88.79
87.21
87.83
87.95
89.15
86.91
88.24
88.82
89.29
87.89
89.33
90.67
91.07
0.98
NS
76.75
78.02
80.76
80.98
79.53
80.33
81.37
81.36
81.80
82.20
81.77
83.02
80.89
82.29
83.00
83.30
82.75
83.62
83.99
84.87
1.74
NS
77.63
78.23
78.77
79.23
80.97
81.57
82.10
82.57
82.47
82.96
83.70
84.75
83.38
83.37
83.90
84.63
82.97
83.67
85.93
86.97
1.07
NS
77.19
78.13
79.77
80.11
80.25
80.95
81.74
81.97
82.14
82.58
82.74
83.89
82.14
82.83
83.45
83.97
82.86
83.65
84.96
85.92
0.96
NS
70.92
71.52
72.06
72.52
74.26
74.86
75.39
75.86
75.76
76.25
76.99
78.04
76.67
76.66
77.19
77.90
76.26
76.96
79.22
80.26
1.07
NS
69.79
71.06
73.80
74.02
72.57
73.37
74.41
74.40
74.84
75.23
74.80
76.06
73.93
75.33
76.04
76.33
75.79
76.66
77.03
77.91
1.74
NS
70.36
71.29
72.93
73.27
73.42
74.12
74.90
75.13
75.30
75.74
75.90
77.05
75.30
76.00
76.62
77.12
76.03
76.81
78.13
79.09
0.96
NS
DAT – Days after transplanting, DAS – Days after storage, NS-Non significant
Note: Recommended dose of N: P at 125:75 kg and farmyard manure 30 t ha-1 was applied commonly to all the
treatments and nitrogen was applied 50 % at transplanting and 50 % at 30 DAT.
4234
Int.J.Curr.Microbiol.App.Sci (2018) 7(7): 4226-4237
This might be due to higher level of
potassium application resulted in low
moisture content of onion bulbs and hence,
there was a low physiological loss in weight
during storage. Potassium increases the bulb
cellulose, control plant turgidity, maintains
integrity of the cell membranes and reduces
water loss, reduce rotting and sprouting of
bulbs. Similar observation were made by
Gunjan et al., (2005), and El-Sayed and ElMorsey (2012) and Poornima et al., (2015).
Rotting and sprouting of onion bulbs at all the
storage days differed significantly by
potassium levels. At 30, 60 and 90 DAS, the
rotting and sprouting of onion bulbs was
recorded significantly minimum in 200 per
cent RDK (2.01, 6.89 and 13.91%,
respectively) over 100 per cent RDK (3.88,
9.42 and 18.13%, respectively). The rotting
and sprouting of onion bulbs least with higher
level of potassium application. This might be
attributed to potential activity of potassium
against the rotting and sprouting of onion
bulbs. Potassium is as an essential element
and it plays vital role in plant nutrition and
reduce the water loss. Similar results were
reported by Faten et al., (2010) and Poornima
et al., (2015).
Marketable bulbs of onion differed
significantly by potassium levels. The higher
marketable bulb of onion was significantly in
200 per cent RDK and lowest marketable
bulbs was recorded in 100 per cent RDK. The
marketable bulbs of onion increased with
levels of potassium application. Marketable
bulb yield depends upon the how much extent
of loss in weight, sprouting and rotting during
storage. The increase in marketable bulbs
yield might be due to low physiological loss
in weight, rotting and sprouting of bulbs due
to application of potassium. Similar results
were reported by Hariyappa (2003), Gunjan et
al., (2005) and El-Sayed and El-Morsey
(2012).
Physiological loss in weight of onion bulbs
varied significantly by potassium sources
during both the years as well as in pooled data
of onion storage. At 30, 60 and 90 DAS,
physiological loss in weight of onion bulbs
was significantly minimum in potassium
sources as SOP (7.78, 17.43 and 21.12%,
respectively) over MOP (8.54, 18.97 and
22.60%, respectively). There was significant
difference with respect to physiological loss
in weight of onion during storage due to
potassium sources such as sulphate of potash
was recorded minimum PLW compared to
MOP. Potassium sulphate increased bulbs
cellulose, control plant turgidity, maintains
integrity of the cell membranes and reduce the
water loss. These results are in agreement
with the finding of Ghulamnabi et al., (2010).
Rotting and sprouting of onion bulbs varied
significantly by potassium sources. At 30, 60
and 90 DAS, the rotting and sprouting of
onion bulbs was significantly minimum in
potassium sources as SOP (2.40, 7.86 and
15.09%, respectively) over MOP (3.54, 8.24
and 16.50 per cent, respectively). This results
might be due to potassium source as sulphate
of potash was attributed to potential activity
of potassium against fungal diseases and
rotting of the bulbs. These results are in
agreement with the findings of Ghulamnabi et
al., (2010) and Deshpande et al., (2013).
Marketable bulb of onion varied significantly
by potassium sources. At 30, 60 and 90 DAS,
the marketable bulb of onion was
significantly highest in potassium sources as
SOP (88.67, 82.85 and 76.01%, respectively)
over MOP (87.16, 81.27 and 74.43%,
respectively). The marketable bulb yield
depends upon the how much extent of loss in
weight, sprouting and rotting during storage.
The highest marketable bulbs of onion due to
application of sulphate of potash compared to
muriate of potash. Similar findings have been
reported by Gunjan et al., (2005) and
4235
Int.J.Curr.Microbiol.App.Sci (2018) 7(7): 4226-4237
Deshpande et al., (2013). The result indicated
that the significantly increased the marketable
bulb yield and reduced the physiological loss
in weight, rotting and sprouting onion bulbs
and minimum moisture content of bulb during
storage period of 90 days with the application
50 per cent potassium at transplanting and 50
per cent K at 30 DAT with recommended
dose of nitrogen and phosphorus. The
beneficial effect of potassium and sulphur
present in sulphate of potash and split
application resulting in reduced the PLW,
rotting and sprouting and increased the
marketable bulb yield during storage of onion
bulbs under ambient condition. These
findings are in agreement with the results of
Gunjan et al., (2005) and El-Sayed and ElMorsey (2012).
In pooled data at 60 and 90 DAS, the
treatment combination of K5S2T2 (200%
RDK, SOP with application of 50 per cent
potassium at transplanting and 50 per cent at
30
DAT)
was
recorded
minimum
physiological loss in weight of onion bulbs
(12.91and 16.84%, respectively). There was
significant difference with respect to
physiological loss in weight in onion during
storage due to potassium levels, sources such
as sulphate of potash was recorded minimum
PLW compared to MOP with split application
of potash. This results may be due sulphur
and potash present in SOP. Potassium
sulphate increased bulbs cellulose, control
plant turgidity, maintains integrity of the cell
membranes and reduce the water loss. These
results are in agreement with the finding of
Desuki et al., (2006), Ghulamnabi et al.,
(2010).
In pooled data at 60 and 90 DAS, the
treatment combination of K5S2T2 (200%
RDK, SOP with application of 50 per cent
potassium at transplanting and 50 per cent at
30 DAT) was recorded significantly minimum
rotting and sprouting of onion bulbs (5.75 and
12.69%, respectively). This results might be
due to potassium levels, sources and split
application. This was attributed to potential
activity of potassium against fungal diseases
and rotting of the bulbs. These results are in
agreement with the finding of Ghulamnabi et
al., (2010) and Deshpande et al., (2013).
At 90 DAS, the treatment combination of
K5S2T2 (200% RDK, SOP with application of
50 per cent potassium at transplanting and 50
per cent at 30 DAT) was recorded minimum
marketable bulb of onion bulbs (79.09%). The
marketable bulb yield depends upon the how
much less losses in bulb yield. The highest
marketable bulb of onion due to application
potassium levels, sources such as sulphate of
potash compared to muriate of potash and
split application of potash. Similar findings
have been reported by Hariyappa (2003),
Gunjan et al., (2005) and Deshpande et al.,
(2013).
References
Anonymous, 2015. Indian Horticultural
Database. www.nhb.gov.in.
Chopra, A., 2010. Understanding onion
storage-issues and solutions for
India.www.onions-potatos.com/ storage.
Deshpande, A. N., Dage, A. R., Bhalerao, V.
P. and Bansal, S. K., 2013. Potassium
nutrition for improving yield and
quality of onion. Int. Potash Institute,
36: 214-222.
El-Sayed, H. A. and El-Morsey. A. H. A.,
2012. Response of productivity and
storability of garlic (Allium sativumL.)
to some potassium levels and foliar
spray with mepiquatcholoride (pix). Int.
Res. J. Agril Sci. Soil Sci., 2 (7): 298305.
Faten, S. Abd El-Al, Shaheen A.M., Fatma A.
Rizk, Magda M. Hafez, 2010. Influence
of irrigation intervals and potassium
fertilization on productivity and quality
4236
Int.J.Curr.Microbiol.App.Sci (2018) 7(7): 4226-4237
of onion plant. IntJ. Acad. Res., 2 (1):
110-116.
Ghulamnabi, Abdur, R., Sayed, J. A.,
Farhatullah, Fazal, M. and Ibrar, H. S.,
2010. Influence of different levels of
potash on the quantity, quality and
storage life of onion bulbs. Pakistan J.
Bot.,42 (3): 215-219.
Gopalakrishnan, T. R., 2010. Horticulture
Science Series 4. Ed.Peter, K. V., New
India publishing Agency, New Delhi, p.
226.
Gunjan, A., Pariwal, R. and Sarolia, D. K.,
2005. Effect of nitrogen and
biofertilizers on yield and quality of
rabi onion (Allium cepaL.) cv. Puna
red. Agric. Sci. Digest., 25 (2): 124-126.
Hariyappa, N., 2003. Effect of potassium and
sulphur on growth, yield and quality
parameters of onion (Allium cepa L.).
M. Sc. Thesis, Univ. of Agric. Sci.,
Dharwad (India).
Poornima, K. S., Mamatha, N. and Ramesh,
H. S., 2015. Effect of potassium and
sulphur on quality parameters of onion
and chilli intercrops in a vertisol. Adv.
Res. J. Crop improvement,6 (2):166169.
Sharma, H. P., Bhonde, S. R. and Singh, R.
K., 2012. Post-harvest management and
storage of onion and garlic. National
Horticultural
Research
and
Development Foundation, p. 3- 6.
Tripathi, P. C. and Lawande, K. E., 2003.
Onion storage structure for small and
marginal farmers. ICARNews, A
Science and Technology Newsletter, 9
(4): 18-19.
Vavilov, N. I., 1951. Origin, variation,
immunity and breeding of cultivated
plants. J. Chronical Bot., 13 (1/6): 1364.
How to cite this article:
Kumara B. R., C. P. Mansur, S. L. Jagadeesh, R. K. Mesta, D. Satish, Shankar Meti, Girish
Chander, S. P. Wani, T. B. Allolli and Sanjeev Reddy. 2018. Effect of Potassium Levels,
Sources and Time of Application on Storage Life of Onion (Allium cepa L.).
Int.J.Curr.Microbiol.App.Sci. 7(07): 4226-4237. doi: />
4237