Construction of a VPN system for remote programming and monitoring of environmental parameters for serving plant production in greenhouses
Bạn đang xem bản rút gọn của tài liệu. Xem và tải ngay bản đầy đủ của tài liệu tại đây (2.07 MB, 13 trang )
Vietnam Journal
of Agricultural
Sciences
ISSN 2588-1299
VJAS 2019; 2(1): 343-355
/>
Construction of a VPN System for Remote
Programming and Monitoring of
Environmental Parameters for Serving Plant
Production in Greenhouses
Nguyen Van Dieu & Ngo Tri Duong
Faculty of Engineering, Vietnam National University of Agriculture, Hanoi 131000,
Vietnam
Abstract
This article introduces a virtual private network (VPN) system
deployed in a 70m2 operator station and greenhouse at Vietnam
National University of Agriculture. The VPN system was not
limited by geographical distance and allowed for remote
monitoring of environmental parameters, viz. light (1016000lux), soil moisture (20-100%), temperature (20-60oC), and
ambient humidity (30-90%) with tolerances of ± 5% of the
set/measured values. The signals from the sensor system were
recorded with a sampling time of 6 seconds. The designed
interface made it easy for Vietnamese users. The system was
initially established, and tested successfully with Gerbera in the
greenhouse. The VPN system allowed for remote programming,
stable operation, and no loss of data during the signal collecting
process, and allowed users to fully and quickly react when the
system crashed or when the user needed to upgrade or maintain
the greenhouse system.
Keywords
VPN, monitoring, remote programming
Introduction
Received: November 23, 2018
Accepted: April 6, 2019
Correspondence to
/>
The application of high technology in agricultural production is
of great interest in countries with harsh climates and scarce
resources. There have been many studies that offer wireless
solutions for sensor networks to exchange data or to provide control
requests for remote systems such as Li et al. (2010) who introduced
a monitoring system for plants in a greenhouse based on a wireless
sensor network and the launching of an automated control system in
a greenhouse based on wireless sensor networks using Zigbee (Park
et al., 2011). Those studies have been applied in practice but have
343
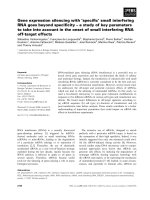
Optimization of chlorogenic acid extraction from green coffee beans using response surface methodology
not been yet connected to generate a large
network. There have also been several popular
PLC
(programmable
logic
controller)
applications such as Martin et al. (2016) who
managed a blueberry farm and monitoring
system using a PLC based on a wireless sensor
network; and Sindhu et al. (2016) who used a
PLC for the purpose of designing, selecting,
controlling,
updating,
and
upgrading
greenhouses. The biggest downside of those
systems, however, is that they must have direct
professional support from the manufacturer
when the system commits errors. The direct
support can increase the initial investment cost
for the user as well as the time it takes to get
professional assistance when the system is in
operation.
Since 2010, the research and application of
hi-tech systems in domestic crop production
have been implemented but still on a small
scale. An automatic control model was applied
to a plant growth house in the area of Ho Chi
Minh City in a study by Lam et al. (2012). In
addition, research and development of
automated monitoring systems for the growth
and development processes of greenhouse
crops, and applications in the production of
high-tech flowers have also been studied
(Duong et al., 2016). The above research
articles have supported users by using a PLCSIMATIC to control, monitor, and collect
information of the systems through a screen
interface in the greenhouse. Even so, users must
frequently visit the greenhouse to control the
systems, especially since if a problem occurs it
will not be detected or treated in time if there is
no one at the greenhouse. Quy et al. (2016) built
an automatic smartphone model that
automatically controls and monitors the
greenhouse environment through a wireless
transmit/receive
module
and
STM
microcontroller. The research team just released
this model but it has not been applied in
practice. In addition, with the use of
microcontrollers in practice, the stability and
reliability are not high, the rate of damage is
high, replacement and program editing are
344
complex, and the ability to upgrade peripheral
equipment is limited.
According to the report of Vinh et al. (2014),
they developed several multimedia services and
monitored production environment parameters
on the WIMAX telecommunications network in
the Central Highlands. Then, Minh et al. (2015)
improved the model and introduced a method for
controlling and monitoring environmental
parameters on a cloud computing platform via a
wireless WIMAX telecommunication network.
However, the system is susceptible to bad
weather, and nearby radio waves can cause
interference, data depletion, or disconnection of
the transmission line leading to disruption of
services to users. The Northern Electricity
Corporation made a plan in 2015 to build a
110kV TBA electrical substation without human
monitoring and a remote controller center by
2020. The scheme uses the IPsec VPN peers
protocol as an internal network but it is still
undergoing testing. Because of the outstanding
advantages of VPNs, in the near future, it is
going to become a popular technology.
Materials and Methods
Planting techniques and plant care, as well
as the factors affecting the greenhouse crops,
were researched and implemented in the
greenhouses and the operator station of Vietnam
National University of Agriculture with the web
server application PLC S7-1200. The wireless
communication
network
system
was
implemented with the site to site protocol of the
VPN and FPT networks.
Installation of the VPN system
The layout of the whole system is shown in
Figure 1.
Here, the VPN technology required the IP
address to be in the 2 LAN (local area network
site) which was not the same as the network
layer. Two Vigor modems were connected via
the internet through the tunnel of the VPN.
The operator station was located at the
Vietnam National University of Agriculture.
Vietnam Journal of Agricultural Sciences
Nguyen Van Dieu & Ngo Tri Duong (2019)
The computer at the operator station was connected
to the Vigor 2910 modem (dial-in) and had to be
attached to 1 network layer that the Vigor 2910
modem (dial-in) created. The modem (dial-in)
was configured with the FTP network.
The greenhouse was located at the Vietnam
National University of Agriculture. The PLC
was connected to the Vigor 2910 modem (dialout) with the IP address belonging to the same
network layer as the Vigor 2910 modem (dialout). The modem (dial-out) was configured with
USB 3G.
The VPN system could connect the LAN to
LAN directly through the FPT network or could
connect HOST to LAN via an external network
to monitor the test environmental parameters in
the greenhouse.
/>
Set-up of the systems receiving signals from
the sensors
Figure 2 reveals information on the selection
and installation of the sensor types to the CPU and
expansion module to help collect the parameters
of soil moisture, light intensity, temperature, and
environment humidity. The signals received were
processed through the CPU and then sent to the
operator station via the VPN.
Web server application of the PLC for
monitoring environmental parameters
Users could access the webserver interface
of the PLC via the name domain. The design
and construction of the environmental parameter
monitoring interface was based on appropriate
requirements that were convenient for
Vietnamese people to use. On the basis of the
345
Optimization of chlorogenic acid extraction from green coffee beans using response surface methodology
parameters measured from the sensors, the data
were pushed onto the PLC's webserver interface
for remote monitoring by the user.
Running tests and adjustment of the
monitoring system
Implementation of installation, running
tests, monitoring, and remote programming of
the system were conducted at the greenhouse
and the operator station of the Vietnam National
University of Agriculture. The tests were
completed in order to check and adjust the
quality of the system to ensure accuracy and
stability at the experimental site. The goals of
the tests were to evaluate and analyze the
growth environment of crops based on the data
of the parameters to improve the system and to
develop the best ecosystem for greenhouse
crops.
Results and Discussion
Selection of system installation
Sensor system
DHT11 sensors were used to measure the
environmental temperature and humidity. The
DHT11 sensors had a structure of 4 legs. It used
digital interface/serial communication with a 1wire standard. The DHT11 parameters included
the tolerances of 1% RH and 1oC. The accuracy
of the air humidity measurement at 25oC was ±
4% RH, at 0-50oC ± 5% RH, and the maximum
temperature was ± 2oC.
The humidity sensor consisted of a soil
humidity sensor and a sensor module. The probe
was plugged into the ground to detect moisture;
and when the soil moisture reached the set
threshold, the DO output moved the status from
a low to a high level. When the humidity sensor
module was activated, there was a voltage
change at the input of the IC LM393.
The light intensive sensor had high
accuracy using optical resistors and IC
LM393. Optical or photodiode resistors, also
known as LDR (light-dependent resistor) or
photoresistors, are photoelectric elements
made from a polycrystalline semi-conductor
material but without a p-n junction
semiconductor. As light rays fall onto the
photoresistors, they release valuable electrons
from the crystal lattice of the semiconductor
and cause them to travel like free electrons
and increase electrical conductivity, reducing
the electrical resistance of the irradiation of
light (Dieu, 2008). The LDR fabrication
material was a CdS (cadmium sulphide)
semiconductor, and very sensitive to the
visible light spectrum. In the dark, the LDR
photoresistor had an electrical resistance of
some MΩ. When there was light, the electrical
resistance decreased to a few hundred Ω. This
was a nonlinear electrical resistance. With a
measurement range of 10-15000lux, the
electrical resistor in the dark was 1MΩ.
Figure 3. Setting up a light sensor
346
Vietnam Journal of Agricultural Sciences
Nguyen Van Dieu & Ngo Tri Duong (2019)
PLC S7-1200, expansion module, and vigor 2910
Connection of the VPN system
The
PLC
S7-1200
CPU
1214C
AC/DC/RLY (Code 214-1BG31-0XB0) consisted
of four basic components: processor, memory,
power supply, and interface in-output. The CPU
1214C AC/DC/RELAY was integrated locally
with the 14DI/10DO/2AI. The CPU 1214C had
a physical size of 110 x 100 x 75mm.
VPN LAN to LAN
The SM 1234 analogue module (Code 2344HE32-0XB0) was the same extension module
of the S7-1200 PLC. The SM 1234 module
production code 6ES7234-4HE32-0XB0 had
4AI/2AO, +/-10V, 14 BIT 0(4) - 20 mA, and
definition of 13 BIT.
The Vigor 2910 had 4 LAN ports, one
WAN port, and one USB port for the 3G
modem. The Vigor 2910 can load from 20 to
30 devices and at the same time support the
transmission line up to 35Mbps and support the
USB modem with HSDPA standard that can
reach up to 1Mbps of a 3G mobile phone
network system. The main WAN port of
10/100BaseT Ethernet connected to the
Internet via an ADSL modem.
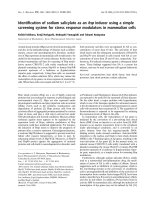
Here, the authors group performed a ping to
the Vigor modem (dial-out) via the LAN to
LAN. The sending of several ICMP information
packets from the computer connected to the
Vigor (dial-in) at the operator station via a VPN
transmission line to a Vigor (dial-out) modem
that received and responded to the signal
indicated that the connection of the VPN LAN
to LAN through two Vigor modems was
successful (Figure 6A). Figure 6B shows the
receipt and response from the PLC in the
greenhouse to the operator station via the VPN.
The Ping to the IP PLC was successful (Figure
6B).
VPN Host to LAN
The Host to LAN connection test was set up
on a 3G enabled smartphone named "Green
House 1". The connection system was quite
stable, and the test was held for about 20
minutes, providing the user enough time to
monitor the entire operation of the environment
in the greenhouse (Figures 7A and 7B).
Figure 6A. Vigor program output confirming successful data transmission to the dial-out modem
/>
347
Optimization of chlorogenic acid extraction from green coffee beans using response surface methodology
Figure 6B. Vigor program output confirming successful data transmission to the IP PLC in the greenhouse
Figure 7A. Smartphone display for setting up the VPN
TIA with PLC
Connect TIA to PLC
The TIA connection on the computer at the
operator station with the PLC at the greenhouse
was performed in the form of the LAN to LAN.
When using TIA software on a LAN we could
go online to a PLC on another LAN. The
successful connection is shown in Figure 8.
Remote programming
When connecting, going online or
otherwise connecting successfully to the PLC
348
Figure 7B. Smartphone display confirming a
successful VPN connection
via the VPN, the programming proceeded as
normal. Figure 9 shows how to successfully
load the TIA program onto the PLC via the
VPN. The program loading time was stable, and
there were no data loss or errors during program
loading.
Monitoring of environmental parameters via
VPN
Monitoring results from sensors
Below are some pictures of the signals
measured from the sensors on April 28, 2018
Vietnam Journal of Agricultural Sciences
Nguyen Van Dieu & Ngo Tri Duong (2019)
in the greenhouse at Vietnam National
University of Agriculture. With a 6s sampling
time, the system received continuous signals
from the sensors. The red line represents the
signal of sensor 1, and the green line is the
signal received by sensor 2.
TIA program display allowing for the management of the PLC from the operating station
/>
349
Optimization of chlorogenic acid extraction from green coffee beans using response surface methodology
Soil moisture monitoring signals (Figures 10 A-D):
oil moisture monitoring signal at
oil moisture monitoring signal
oil moisture monitoring signal
oil moisture monitoring signal
Light intensity monitoring signals (Figures 11 A-D):
Light intensity monitoring signal
350
ight intensity monitoring signal
Vietnam Journal of Agricultural Sciences
Nguyen Van Dieu & Ngo Tri Duong (2019)
ight intensity monitoring signal
Light intensity monitoring signal
Environmental humidity monitoring signals (Figures 12 A-D):
Environmental humidity monitoring signal at
nvironmental humidity monitoring signal
/>
Environmental humidity monitoring signal
nvironmental humidity monitoring signal
351
Optimization of chlorogenic acid extraction from green coffee beans using response surface methodology
Environmental temperature monitoring signals (Figures 13 A-D):
Environmental temperature monitoring signal
Environmental temperature monitoring signal
Environmental temperature monitoring signal
Environmental temperature monitoring signal
Sensor value 1
(%)
Measurement
equipment
value 1 (%)
Relative error
(%)
Sensor value
2 (%)
Measurement
equipment
value 2 (%)
Relative error
(%)
09:00 a.m.
75
74.6
0.54
75
75.1
0.13
09:15 a.m.
73
73.9
1.22
73
73.8
1.08
09:30 a.m.
74
74.4
0.54
74
74.6
0.80
09:45 a.m.
73
73.9
1.22
72
73.3
1.77
13:00 p.m.
67
67.3
0.45
67
67.4
0.59
13:15 p.m.
66
66.7
1.05
66
66.6
0.90
13:30 p.m.
66
66.8
1.20
66
66.4
0.60
13:45 p.m.
65
65.9
1.37
65
65.8
1.22
18:00 p.m.
70
70.3
0.43
70
70.2
0.28
18:15 p.m.
70
70.4
0.57
70
70.2
0.28
18:30 p.m.
71
71.2
0.28
71
71.3
0.42
18:45 p.m.
72
71.9
0.14
72
72.2
0.28
21:00 p.m.
79
79.5
0.63
79
79.6
0.75
21:15 p.m.
80
80.2
0.25
80
80.3
0.37
21:30 p.m.
80
80.2
0.25
80
80.3
0.37
21:45 p.m.
79
79.6
0.75
78
79.5
1.89
Time of day
352
Vietnam Journal of Agricultural Sciences
Nguyen Van Dieu & Ngo Tri Duong (2019)
Sensor value 1
(lux)
Measurement
equipment value
1 (lux)
Relative error
(%)
Sensor value
2 (lux)
Measurement
equipment value
2 (lux)
Relative error
(%)
09:00 a.m.
11826
11811.8
0.12
11623
11811.3
1.59
09:15 a.m.
11563
11563.4
0.00
11563
11563.2
0.00
09:30 a.m.
11234
11234.5
0.00
11234
11234.5
0.00
09:45 a.m.
11765
11723.4
0.35
11758
11723.6
0.29
13:00 p.m.
12234
12212.3
0.18
12195
12212.1
0.14
13:15 p.m.
12453
12453.8
0.01
12453
12453.4
0.00
13:30 p.m.
12345
12345.7
0.01
12345
12345.8
0.01
13:45 p.m.
12643
12593.9
0.39
12598
12593.7
0.03
18:00 p.m.
4463
4413.9
1.11
4411
4413.8
0.06
18:15 p.m.
4425
4425.9
0.02
4425
4425.9
0.02
18:30 p.m.
4463
4463.5
0.01
4463
4463.3
0.01
18:45 p.m.
4429
4399.2
0.68
4408
4399.4
0.20
21:00 p.m.
230
225.7
1.91
225
226.2
0.53
21:15 p.m.
235
237.7
1.14
235
239.6
1.92
21:30 p.m.
225
228.4
1.49
225
230.1
2.22
21:45 p.m.
245
249.1
1.65
234
239.9
2.46
Sensor value 1
(%)
Measurement
equipment value
1 (%)
Relative error
(%)
Sensor value
2 (%)
Measurement
equipment value
2 (%)
Relative error
(%)
09:00 a.m.
72
71.5
0.70
72
71.5
0.70
09:15 a.m.
71
71.5
0.70
71
71.5
0.70
09:30 a.m.
71
71.5
0.70
71
71.5
0.70
09:45 a.m.
72
71.5
0.70
72
71.5
0.70
13:00 p.m.
63
63.1
0.16
63
63.2
0.32
13:15 p.m.
63
63.1
0.16
63
63.2
0.32
13:30 p.m.
62
62.9
1.43
62
62.6
0.96
13:45 p.m.
62
62.9
1.43
62
62.6
0.96
18:00 p.m.
67
67.7
1.03
67
67.6
0.89
18:15 p.m.
67
67.7
1.03
67
67.7
1.03
18:30 p.m.
67
67.7
1.03
67
67.7
1.03
18:45 p.m.
68
68.1
0.15
68
68.2
0.29
21:00 p.m.
78
78.2
0.26
78
78.4
0.51
21:15 p.m.
77
77.8
1.03
77
77.9
1.16
21:30 p.m.
77
77.8
1.03
77
77.9
1.16
21:45 p.m.
78
78.1
0.13
78
78.4
0.51
Time of day
Time of day
/>
353
Optimization of chlorogenic acid extraction from green coffee beans using response surface methodology
Sensor value 1
(oC)
Measurement
equipment value
1 (oC)
Relative error
(%)
Sensor value
2 (oC)
Measurement
equipment value
2 (oC)
Relative error
(%)
09:00 a.m.
23
23.8
3.36
23
23.8
3.36
09:15 a.m.
24
24.2
0.83
24
24.1
0.41
09:30 a.m.
24
24.3
1.23
24
24.2
0.83
09:45 a.m.
24
24.6
2.44
24
24.5
2.04
13:00 p.m.
25
25.2
0.79
24
24.9
3.61
13:15 p.m.
25
25.5
1.96
25.5
25.5
0.00
13:30 p.m.
26
26.1
0.38
26
26.1
0.38
13:45 p.m.
27
27.1
0.37
27
27.2
0.74
18:00 p.m.
25
25.3
1.19
25
25.2
0.79
18:15 p.m.
24
24.8
3.23
24
24.7
2.83
18:30 p.m.
24
24.6
2.44
24.5
24.6
0.41
18:45 p.m.
24
24.5
2.04
24
24.4
1.64
21:00 p.m.
23
23.1
0.43
23
23.2
0.86
21:15 p.m.
22.4
22.5
0.44
22.5
22.6
0.44
21:30 p.m.
22.4
22.3
0.45
22.5
22.6
0.44
21:45 p.m.
21
21.8
3.67
21
21.5
2.33
Time of day
The environmental parameters in a covered
greenhouse at Vietnam National University of
Agriculture (April 28, 2018) show that the
signals measured from the sensors sent to the
operator station were relatively stable and had
errors within the allowed range (Tables 1-4).
The standard sampling devices used here were
similar to the study by Duong et al. (2016).
The results received from the sensors
through the VPN show a reliable signal, which
allowed the user to master the system as desired.
Signal transmission through the VPN was
stable, and no signs of loss of transmission or
weak signals due to external factors at the
greenhouse of Vietnam National University of
Agriculture were detected.
(10-16000lux), soil moisture (20-100%),
temperature (20-60oC), and ambient humidity
(30-90%) with tolerances of ± 5% of the
measured values.
Conclusions
Acknowledgments
The sensor parameters were recorded with a
sampling time of 6 seconds, and the visual
expression interface made it easy for the
Vietnamese users to safely and quickly monitor the
wireless parameters at the limits allowed for light
We would like to thank the staff and
students of the Faculty of Engineering, Vietnam
National University of Agriculture, for their
great contributions to the completion of this
research.
354
Improving the system and fixing random
incidents is essential to deal with the everchanging complexity of the environment. In
particular, dealing with unusual situations or
upgrading changes to the system need to be
strengthened. Therefore, the development of
remote monitoring features and remote
programming applying VPN technology allows
users to react completely and quickly when the
system crashes or users need help from the
outside.
Vietnam Journal of Agricultural Sciences
Nguyen Van Dieu & Ngo Tri Duong (2019)
References
Dieu D. T. (2008). Curriculum measurement sensor
technology & control. Publishing House of
Industrial University of HCM City. 70 (in
Vietnamese).
Duong N. T. & Dieu N. V. (2016). Design and
manufacture of data collection system on
parameters affecting growth and development of
gerbera plants grown in greenhouse. Vietnam
Journal of Agricultural Sciences. 14(3): 477-490
(in Vietnamese).
Lam N. N., Minh D. Q., Thinh T. C. & Nhuong P. H.
(2012). The model of the automated greenhouse
used for HoChiMinh City’s area. Journal of
Automation
Today.
Retrieved
from
on May 11, 2018 (in Vietnamese).
Li X., Cheng X., Yan K. & Gong P. (2010). A
monitoring system for vegetable greenhouse based
on a wireless sensor network. Sensors. 10: 89638980.
Martin N. S., Calado M. R. A., Pombo J. A. N. &
Mariano S. J. P. S. (2016). Blueberries field
irrigation management and monitoring system
using PLC based control and wireless sensor
network. 2016 IEEE 16th International Conference
on Environment and Electrical Engineering
(EEEIC).
Minh P. N., Phuong N. T., Vinh T. Q., Hoang H. D. & Thap
/>
P. H. (2015). Method monitor and control
environment parameters on cloud computing over
WIMAX wireless communication network.
Proceedings of the 3rd National Conference on
Control and Automation VCCA-2015. Publisher of
Natural Science and Technology (in Vietnamese).
Park D., Kang B., Cho K., Shin C., Cho S. & Park J.
(2011). A study on greenhouse automatic control
system based on wireless sensor network. Wireless
Personal Communications. 56(1): 117-130.
Quy D. X., Dat T. T. & Quang P. T. A. (2016).
Smartphone automatically monitor and control the
greenhouse environment via the ESP8266-ESP01
wifi transmitter/receiver module and the
STM32F103C8T6 microcontroller. Journal for
Science and Technology Information Quang Binh.
2: 44-48 (in Vietnamese).
Sindhu P. S., Divya L. R., Vasuki S. & Rakesh R.
(2016).Glass house horticulture using PLC.
Journal of Biometrics and Bioinformatics. 8(9):
239-242.
Vinh T. Q., Tuan D. A., Chung N. D., Long N. T., Liem
C. N., Minh P. N., Phuong N. T., Giang P. T., Anh
P. Q., Hung N. N., Tung V. D., Duc D. V., Sinh V.
T. & Truong T. M. (2014). Research and
development of some multimedia services and
monitoring the environmental parameters of
production on the WIMAX network in the Central
Highlands. Topic TN3/C07 belonging to the Statelevel scientific and technological program (in
Vietnamese).
355