Transcriptome profiling of grapevine seedless segregants during berry development reveals candidate genes associated with berry weight
Bạn đang xem bản rút gọn của tài liệu. Xem và tải ngay bản đầy đủ của tài liệu tại đây (1.98 MB, 17 trang )
Muñoz-Espinoza et al. BMC Plant Biology (2016) 16:104
DOI 10.1186/s12870-016-0789-1
RESEARCH ARTICLE
Open Access
Transcriptome profiling of grapevine
seedless segregants during berry
development reveals candidate genes
associated with berry weight
Claudia Muñoz-Espinoza1,2,4, Alex Di Genova3,4, José Correa1, Romina Silva1, Alejandro Maass3,4,
Mauricio González-Agüero1, Ariel Orellana2,4 and Patricio Hinrichsen1*
Abstract
Background: Berry size is considered as one of the main selection criteria in table grape breeding programs.
However, this is a quantitative and polygenic trait, and its genetic determination is still poorly understood.
Considering its economic importance, it is relevant to determine its genetic architecture and elucidate the
mechanisms involved in its expression. To approach this issue, an RNA-Seq experiment based on Illumina platform
was performed (14 libraries), including seedless segregants with contrasting phenotypes for berry weight at fruit
setting (FST) and 6–8 mm berries (B68) phenological stages.
Results: A group of 526 differentially expressed (DE) genes were identified, by comparing seedless segregants with
contrasting phenotypes for berry weight: 101 genes from the FST stage and 463 from the B68 stage. Also, we
integrated differential expression, principal components analysis (PCA), correlations and network co-expression
analyses to characterize the transcriptome profiling observed in segregants with contrasting phenotypes for berry
weight. After this, 68 DE genes were selected as candidate genes, and seven candidate genes were validated by
real time-PCR, confirming their expression profiles.
Conclusions: We have carried out the first transcriptome analysis focused on table grape seedless segregants with
contrasting phenotypes for berry weight. Our findings contributed to the understanding of the mechanisms
involved in berry weight determination. Also, this comparative transcriptome profiling revealed candidate genes for
berry weight which could be evaluated as selection tools in table grape breeding programs.
Keywords: RNA-seq, Table grapes, Berry weight, Functional genomics, Candidate genes
Background
Grape (Vitis vinifera L.) is the main fruit crop of temperate regions, reaching nearly 77 million tons of fruit produced throughout the world in 2013 [1]. It also exhibits
a high level of genetic diversity; the genus Vitis includes
more than 50 species [2–4].
Berry weight is considered as one of the main selection
criteria in table grape breeding, due to the consumer
preferences for large and seedless berries along with
* Correspondence:
1
Instituto de Investigaciones Agropecuarias, INIA-La Platina, Santa Rosa 11,
610 Santiago, Chile
Full list of author information is available at the end of the article
organoleptic quality traits such as flavor and aroma [5].
However, berry weight is a quantitative and polygenic
trait, probably determined by numerous processes such
as cell multiplication, cell wall modification, water and
sugar transport. Despite its relatively high heritability
which is mostly additive, the genetic determination of
berry weight was until recently scarcely documented
[6, 7]. Therefore, considering the economic importance
of berry weight for table grapes, it is relevant to determine its genetic architecture and elucidate the mechanisms involved in the expression of its driver genes.
This information is required for the development of
new cultivars involving the combination of desirable
© 2016 Muñoz-Espinoza et al. Open Access This article is distributed under the terms of the Creative Commons Attribution
4.0 International License ( which permits unrestricted use, distribution, and
reproduction in any medium, provided you give appropriate credit to the original author(s) and the source, provide a link to
the Creative Commons license, and indicate if changes were made. The Creative Commons Public Domain Dedication waiver
( applies to the data made available in this article, unless otherwise stated.
Muñoz-Espinoza et al. BMC Plant Biology (2016) 16:104
traits, which include not just berry size and lack of
seeds, but also cluster architecture compatible with a
proper berry spatial distribution [8], response to gibberellic acid (GA3) [9], yield [10] and tolerance to fungal diseases [11, 12], among others production traits.
As in other plant species, growth and cell proliferation of grape berries correspond to different processes
which together determine the final fruit dimensions
[13]. The development and maturation of grapevine
berries has been studied as a model because of the
uniqueness of this process in plant biology and its
molecular regulation [14, 15].
Berry development presents a characteristic double
sigmoid curve with three main phases, encompassing a
series of physical and biochemical changes such as cell
division and elongation, primary and secondary metabolism and resistance/susceptibility to biotic/abiotic stress
[16]. Phase I involves events associated with cell division
and cell elongation [17], the latter based on the accumulation of organic acids into the vacuole [6, 14, 18]. In this
stage the berry is hard, green and grows slowly [14];
malic acid is the predominant metabolite. In Phase II,
slower growth is observed and berry softening begins;
numerous changes occur associated with gene expression and berry physiology reprogramming. Phase III is
when berries reach their mature weight. This stage is
characterized by the onset of sugar accumulation, a decrease in organic acid content and concomitantly, accumulation of anthocyanins in colored cultivars and
volatile secondary metabolites associated with flavor and
aroma [14].
A positive correlation has been described between the
final berry weight and seed content [19] in segregating
populations [20–24], possibly being the result of growth
regulators produced by seeds [6, 25]. Interestingly, in
stenospermocarpic varieties pollination occurs normally
although the embryo development process aborts early,
approximately 2 to 4 weeks after fertilization, while berry
development continues normally [5, 24]. However, seedless varieties such as cv. Sultanina exhibit a reduced
berry weight at harvest [26, 27], requiring two or three
exogenous applications of gibberellic acid along with
cluster thinning in order to maximize the potential berry
growth; both practices demand high labor force, which
increases production costs.
In relation to hormonal regulation, ethylene, auxins,
ABA, cytokinins and gibberellins can influence berry
development and ripening [28]. The concentration of
auxins, cytokinins and gibberellins tends to increase
during Phase I, in pre-véraison stages, and later decreasing in véraison, where a peak of abscisic acid has been
described [28, 29].
Previous studies have described QTLs associated with
berry weight in chromosomes 1 and 12 [23], 5 and 13
Page 2 of 17
[30], 8, 11 and 17 [6], 15 [21] and 18 [22, 24]. In
addition, [31] recently reported the VvCEB1 gene, a
bHLH transcription factor, as possibly involved in the
regulation of cell size in cv. Cabernet Sauvignon. Also,
the VvNAC26 gene has been proposed as probably associated with berry weight variation in V. vinifera [32].
However, the genetics and information on the molecular
mechanisms behind berry development in table grapes
are still scarce and limited.
Diverse transcriptome studies based on microarrays
[16, 33–35] as well as high-throughput RNA-Seq sequencing [36, 37] have been developed in grapes, focused on understanding the developmental and
maturation process of the berry. However, these studies
were directed to improve the understanding of organic
acids, resveratrol, anthocyanin and tannin content and
metabolism in relation to wine quality [36–40].
Due to the economic importance of berry weight in
table grapes, it is relevant to determine the underlying
mechanisms controlling this trait, in order to reveal
positive and negative genetic factors involved in the expression of this complex trait.
We carried out the first transcriptome analysis with
the aim of elucidating the mechanisms involved in berry
weight determination. We contrasted seedless table
grape segregants with opposite phenotypes for this trait
in order to explore its genetic architecture. This comparative transcriptome profiling revealed candidate
genes associated with berry weight, which could be evaluated as selection tools in table grape breeding
programs.
Results and Discussion
RNA isolation from contrasting segregants for berry
weight and library construction
The feasibility of this study was based on the availability
of seedless segregants for berry weight (RxS crossing),
maintained under the same climatic and agronomic
conditions, which offer a unique opportunity to analyze
transcriptome changes associated with this complex
trait.
In order to study the underlying differences between
large and small berries, six seedless segregants derived
from a ‘Ruby Seedless’ x ‘Sultanina’ crossing (RxS; n =
139) with contrasting phenotypes for berry weight were
selected and phenotyped during three seasons, 2009–
2010 to 2011–2012 (Fig. 1, Additional file 1: Table S1).
According to ANOVA, the genotype effect was the most
significant (83 %), the season effect corresponding to
8.5 % and the genotype x season interaction was 5.9 %.
The linear model explained 97 % of the phenotypic
variance (Table 1).
Thus a transcriptome experiment based on Illumina
platform (RNA-Seq) was undertaken focused on early
Muñoz-Espinoza et al. BMC Plant Biology (2016) 16:104
Page 3 of 17
Berry fresh weight
(g/berry)
3
2
1
19
112
Ruby
117
Sultanina
359
151
91
0
Segregants + parentals
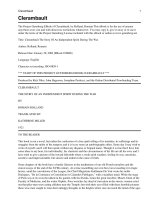
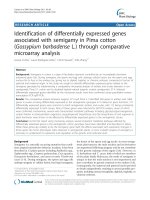
Fig. 1 Berry fresh weight at harvest (18°Brix) of six RxS segregants exhibiting contrasting phenotypes, including parents cv. Ruby Seedless and
Sultanina. Each value corresponded to phenotypic mean values during the 2009–2010, 2010–2011 and 2011–2012 seasons. Error bars represent
one standard error of the mean (SEM)
stages of berry development, i.e., fruit setting (FST) and
berry 6–8 mm stages (B68) [14]; mRNA samples isolated
in both stages were sequenced independently (Fig. 2a).
These two stages are part of Phase I of the double sigmoid curve during berry growth, when the final number
of cells is being defined, followed by cell expansion associated with water and organic acid accumulation in the
vacuole [6, 14], critical processes defining the final fruit
size [18, 31]. During the FST stage the berry cell machinery is receptive to exogenous gibberellin (GA) applications, increasing berry weight and reducing seed weight
[41]. GA1 and GA4, the two endogenous bioactive GAs
synthetized in the berry, have their maximum peaks in
the FST and B68 stages, respectively (Ravest et al., in
preparation).
Global analysis of gene expression changes from fruit set
(FST) to berry 6–8 mm (B68) stages
Illumina GAII mRNA sequencing
A total of 14 libraries were analyzed; 155,060,882
reads of 50 bp were obtained (Additional file 2: Table
S2). After quality trimming 152,897,297 reads were
kept, representing a loss of about 2 % of the reads
for each library (Additional file 2: Table S2). Of this
Table 1 Genotypic and season effect on berry weight
phenotype (%)
Segregant
82.86***
total, 91 % of the reads were mapped as unique and
multiple alignments (Additional file 3: Table S3). The
total of mapped reads corresponded to 147.8 million
reads, of which 63 to 69 % mapped in exons, 15 to
19 % in UTR regions, 8 to 9 % within intron regions,
and 6 to 9 % in intergenic regions; the percentage of
usable reads (UTR and exons) varied from 80 to
85 % (Additional file 4: Table S4). A total of 8.5 million reads obtained from the 14 libraries were not
mapped to the reference genome PN40024. They were
used to construct 2,625 de novo contigs, with an
average length of 673 bp. Of them, 457 contigs were
mapped to the reference genome and reanalyzed
(Additional file 5: Table S5).
Season
Interaction
Model
8.52*
5.93*
97.32
Significance codes according to ANOVA (p): ***0–0.001; **0.001–0.01; *0.01–
0.05; n.s. not significant (p > 0.05). Coefficient of determinations (adjusted)
based on mean squares of each factor, error and model according to ANOVA
To determine which genes are changing their expression profiles and at what stage, comparisons between
individuals with contrasting phenotypes for berry
weight were performed (Fig. 2b, c). A group of 526 differentially expressed genes (DE) was identified comparing large (LB) versus small berry (SB) segregants in
the two phenological stages (cuffdiff2 p < 0.01, FDR <
0.05) (Fig. 2b). In particular, 101 genes were identified
from FST (39 up-regulated/62 down-regulated)
(Additional file 6: Table S6) and 463 genes from B68
(172 up-regulated/291 down-regulated) (Additional
file 7: Table S7). Interestingly, 37 of these were differentially expressed in both stages, with 34 coincidentally
Muñoz-Espinoza et al. BMC Plant Biology (2016) 16:104
Page 4 of 17
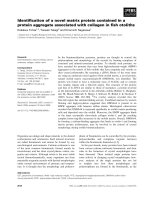
Fig. 2 Experimental design, gene differential expression and hierarchical clustering of differentially expressed genes. a Phenological stages
considered for the transcriptomic study. RNA samples were obtained from large (LB) and small (SB) berry genotypes, at phenological stages of
fruit-setting (FST) and berry 6–8 mm stages (B68), modified from [15]. b Differentially expressed genes after comparison between RxS segregants
with contrasting phenotypes for berry weight in both phenological stages. c Hierarchical clustering of a group of 526 differentially expressed
genes among LB and SB segregants in the FST and B68 stages. Pearson correlation was used as distance and five clusters were identified
raising or decreasing their expression level, including
transcripts coding for stilbene synthases (STS) (14)
(Additional file 8: Table S8); this is equivalent to what has
been observed in previous transcriptome studies during
berry development in cv. Corvina [36] and cv. Cabernet
Sauvignon [39].
Muñoz-Espinoza et al. BMC Plant Biology (2016) 16:104
A hierarchical clustering was performed using gene expression measured as fpkm observed in the group of 526
DE genes (Fig. 2c), and using Pearson correlation as distance in the transcriptional dendrogram. According to
the expression profiles, five groups of DE genes were
identified containing 60, 58, 101, 169 and 138 DE genes
(Fig. 2c). In addition, a functional enrichment analysis
(Gene Ontology) was developed to assess main processes
over-represented in each cluster of transcripts using the
agriGO platform [42] (Additional file 9: Figure S1). No
over-represented category was identified in the case of
cluster 2. Concomitantly, GO analysis of the groups of
101 DE genes identified in the FST and 463 in the B68
stage were performed and the results agreed with the
global analysis.
Functional analysis of DE genes comparing large and
small berry segregants at fruit set (FST) and berry
6–8 mm (B68) development stages
Selection of a subset of candidate genes able to explain the
difference in berry size
In order to identify the genes involved in berry size
determination, a principal components analysis was
performed considering the 526 DE genes. The results
showed that two components explained 87 % of the
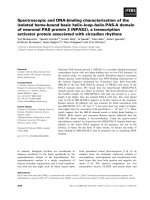
phenotypic variance (Fig. 3). The first component
explained 55 % of the variation and clearly discriminates between contrasting phenotypes. The second
component explained 31.7 % of the observed variation
and discriminated between phenological stages (Fig. 3).
Subsequently, correlation analyses were performed
and significant correlations (p < 0.05) between DE
genes and the two components were performed in
order to select candidate genes, defined as transcripts
whose expression level discriminates between individual classes [40].
Page 5 of 17
A group of 68 DE genes were significantly correlated
with component 1 and 16 with component 2 (Table 2).
Interestingly, both subsets of DE genes were identified in
the B68 stage (Additional file 7: Table S7).
One of the most relevant functional categories associated with this group of genes was stress/defense response (26 %), encompassing HSP and chaperonins upregulated in LB segregants (Additional file 10: Figure
S2). In addition, protein kinase modifications and transcription categories were also relevant, possibly associated with the reprogramming of genes controlling
transcription and translation rate in order to remodel
the set of cell proteins. Four genes coding for receptor
kinase-like (RLK) were up-regulated in SB segregants
(Table 2). RLKs play a pivotal role in sensing external
stimuli, activating downstream signaling pathways and
regulating cell behavior involved in response to pathogens [43] growth and development processes in plants
as well as biotic and abiotic stresses, suggesting a
possible participation in the defense response in plants
[43, 44]. This evidence suggests that a transcriptome reprogramming process is taking place during berry maturation, involving changes in synthesis and activation of
proteins, processes that have been previously described
in cv. Corvina, as well as a possible compensatory adaptation [16]. Indeed, increments in HSPs and chaperonin
expression towards véraison have been reported, with a
peak at véraison and subsequent reduction during berry
maturation, associated with massive changes in metabolism at this phenological stage which demand the synthesis of new proteins [38, 45, 46].
Considering the observed evidence from other genetic
backgrounds such as cv. Corvina, the higher expression
level of HSP and chaperonins in LB segregants may be
reflecting the adaptation of the berry to environmental
stresses such as higher temperatures in the field.
FST
B68
Fig. 3 Principal components analysis (PCA) using normalized expression data (fpkm). Analysis included the group of 526 DE genes derived from
comparison between LB (in blue) and SB segregants (in red) in the FST and B68 stages
Muñoz-Espinoza et al. BMC Plant Biology (2016) 16:104
Page 6 of 17
Table 2 Differentially expressed genes (DE genes) significantly correlated with PCA components 1 (A) and 2 (B)
Category
geneID
Description
Correlation
p-value
A.
Secondary metabolism
GSVIVG01027145001
O-acyltransferase WSD1
1.00
0.00
GSVIVG01022205001
Cytochrome P450 84A1
0.99
0.01
GSVIVG01036583001
Probable cytochrome P450 313a3
0.98
0.02
GSVIVG01010574001
Stilbene synthase 4
0.95
0.05
GSVIVG01031543001
Lichenase
1.00
0.00
GSVIVG01020228001
Probable xyloglucan endotransglucosylase/hydrolase protein 33
0.99
0.01
GSVIVG01006161001
Glycogenin-2
0.97
0.03
GSVIVG01011500001
Probable galacturonosyltransferase 13
0.96
0.04
GSVIVG01029411001
Expansin-A15
−0.99
0.01
Epidermis-specific secreted glycoprotein EP1
0.99
0.01
GSVIVG01023803001
F-box protein At2g16365
0.96
0.04
GSVIVG01007961001
LON peptidase N-terminal domain and RING finger protein 1
0.96
0.04
GSVIVG01022680001
Protease Ulp1 family
−0.98
0.02
GSVIVG01035051001
Two-component response regulator ARR1
1.00
0.00
GSVIVG01000579001
Vegetative incompatibility protein HET-E-1
0.96
0.04
GSVIVG01008850001
Two-component response regulator ARR9
−0.97
0.03
GSVIVG01005164001
Cysteine-rich receptor-like protein kinase 29
0.99
0.01
GSVIVG01015298001
Receptor-like protein kinase HSL1
0.99
0.01
GSVIVG01013279001
Phosphatidylinositol-4-phosphate 5-kinase 5
0.98
0.02
GSVIVG01005168001
Cysteine-rich receptor-like protein kinase 10
0.97
0.03
GSVIVG01014382001
5'-AMP-activated protein kinase gamma subunit
0.97
0.03
GSVIVG01023804001
AMP-activated protein kinase gamma regulatory subunit putative
0.97
0.03
GSVIVG01021407001
LRR receptor-like serine/threonine-protein kinase FLS2
0.96
0.04
GSVIVG01019840001
Thaumatin-like protein
0.99
0.01
GSVIVG01035061001
Major allergen Pru av 1
0.99
0.01
GSVIVG01023740001
Protein WAX2
0.98
0.02
GSVIVG01021355001
Protein SRG1
0.98
0.02
GSVIVG01009107001
Cationic peroxidase 1
0.97
0.03
GSVIVG01019841001
Pathogenesis-related protein R major form
0.97
0.03
GSVIVG01019835001
Thaumatin-like protein
0.96
0.04
GSVIVG01016196001
Nodulin family protein
0.96
0.04
GSVIVG01008094001
Germin-like protein subfamily T member 1
0.96
0.04
GSVIVG01016697001
18.6 kDa class III heat shock protein
−0.95
0.05
Cell wall metabolism
Water transport
GSVIVG01014205001
Protein degradation/proteasome
Hormonal metabolism and signaling
Protein modification/kinase
Stress/Defense
Muñoz-Espinoza et al. BMC Plant Biology (2016) 16:104
Page 7 of 17
Table 2 Differentially expressed genes (DE genes) significantly correlated with PCA components 1 (A) and 2 (B) (Continued)
GSVIVG01003320001
Cysteine proteinase inhibitor 1
−0.95
0.05
GSVIVG01003118001
Heat stress transcription factor A-2b
−0.96
0.04
GSVIVG01029025001
Chaperonin CPN60-1 mitochondrial
−0.96
0.04
GSVIVG01016053001
Anthranilate N-benzoyltransferase protein 2
−0.96
0.04
GSVIVG01000021001
Copper chaperone
−0.97
0.03
GSVIVG01011742001
10 kDa chaperonin
−0.98
0.02
GSVIVG01035433001
17.9 kDa class II heat shock protein
−0.99
0.01
GSVIVG01024050001
Pathogenesis-related protein 5
−1.00
0.00
GSVIVG01015278001
emb|CAB79689.1| putative protein
0.98
0.02
GSVIVG01008595001
Protein RUPTURED POLLEN GRAIN 1
0.97
0.03
GSVIVG01008851001
Delta-aminolevulinic acid dehydratase chloroplast
−0.98
0.02
GSVIVG01021406001
Chlorophyll a-b binding protein type 2 member 1B chloroplast
−0.97
0.03
GSVIVG01027803001
Inorganic phosphate transporter 1-4
1.00
0.00
GSVIVG01029349001
Probable metal-nicotianamine transporter YSL7
0.99
0.01
GSVIVG01000580001
ABC transporter B family member 15
0.96
0.04
GSVIVG01034463001
ABC transporter G family member 25
0.95
0.05
Development
Chlorophyll biosynthesis
Transport
GSVIVG01001036001
Sugar carrier protein A
−0.96
0.04
GSVIVG01033414001
Putative mitochondrial 2-oxoglutarate/malate carrier protein
−0.96
0.04
GSVIVG01015353001
Transcription factor bHLH68
0.99
0.01
GSVIVG01030127001
Zinc finger protein CONSTANS-LIKE 9
0.99
0.01
GSVIVG01007666001
DEAD-box ATP-dependent RNA helicase 30
0.99
0.01
GSVIVG01013182001
NAC domain-containing protein 78
0.98
0.02
GSVIVG01017714001
Transcription factor HY5-like
0.96
0.04
Transcription
GSVIVG01003118001
Heat stress transcription factor A-2b
−0.96
0.04
GSVIVG01024694001
GCN5-related N-acetyltransferase (GNAT) family protein
−0.96
0.04
Bifunctional 3-dehydroquinate dehydratase/shikimate dehydrogenase chloroplast
0.96
0.04
B.
Secondary metabolism
GSVIVG01021978001
Cell wall metabolism
GSVIVG01028042001
Endoglucanase 1
0.95
0.05
GSVIVG01036543001
Pollen Ole e 1 allergen and extensin family protein
0.96
0.04
GSVIVG01037059001
Serine carboxypeptidase-like 18
0.96
0.04
GSVIVG01017158001
Auxin-induced protein AUX22
0.96
0.04
GSVIVG01028033001
Indole-3-acetic acid-induced protein ARG2
0.96
0.04
GSVIVG01037758001
Pirin-like protein
0.97
0.03
Dihydroflavonol-4-reductase
0.97
0.03
Hormonal metabolism and signaling
Stress/Defense
GSVIVG01009743001
Muñoz-Espinoza et al. BMC Plant Biology (2016) 16:104
Page 8 of 17
Table 2 Differentially expressed genes (DE genes) significantly correlated with PCA components 1 (A) and 2 (B) (Continued)
Development
GSVIVG01020682001
Os01g0614300
0.98
0.02
GSVIVG01009155001
Aspartic proteinase nepenthesin-1
0.97
0.03
GSVIVG01034174001
Metallothionein-like protein type 2
0.97
0.03
GSVIVG01036671001
Aspartic proteinase nepenthesin-1
0.95
0.05
Uncharacterized basic helix-loop-helix protein At1g64625
0.95
0.05
Transcription
GSVIVG01037572001
Furthermore, evidence of a strong transcriptional
control was found, with seven genes associated with
the transcription category, two of them up-regulated
in LB segregants, the heat stress transcription factor
A-2b and a GCN5-related N-acetyltransferase (GNAT)
family protein. Interestingly, the former corresponds
to a transcriptional regulator whose orthologue in rice
is the protein OsHsfA2e, induced by heat stress and
specifically bound to the promotor of heat shock elements and possibly responsible for tolerance to high
temperatures. Considering this, its introgression could
be considered useful, in order to improve crop tolerance to climate change-associated stresses [47, 48].
The latter gene, a histone acetyltransferase (HAT), is
responsible for lysine residue acetylation in histones
H2B, H3 and H4, and also acts as a transcriptional
activator, implicated in chromatin assembly and DNA
replication [49].
In addition, a gene coding for a NAC domaincontaining protein 78 was found up-regulated in SB segregants, which are plant-specific transcription factors
(TFs). Members of this gene family have been related to
plant development [50]. In particular in Vitis vinifera,
VvNAC26 gene has been associated with the early development of grape flowers and berries [51], possibly contributing to berry size variation [32].
In the transport category six DE genes were found,
two up-regulated in LB segregants, the sugar carrier protein A and the putative mitochondrial 2-oxoglutarate/
malate carrier protein, probably associated with the
transport of malate to the vacuole and cell turgor; both
could be key for cell expansion. Malate is the main organic acid stored in the vacuole of grape berry cells,
from FST to véraison [46].
Associated with cell wall metabolism, we found DE
genes coding for a probable xyloglucan endotransglucosylase/hydrolase proteins, a lichenase and a probable
galacturonosyltransferase 13, up-regulated in SB segregants, and an expansin-A15, up-regulated in LB segregants (Additional file 7: Table S7). This result is
concordant with the top over-represented category ‘xyloglucan:xyloglucosyl transferase’ associated with cluster 4
(Fig. 2c, Additional file 9: Figure S1C).
This evidence could be related to cell expansion events
described in the B68 stage, which initially requires cell
wall softening and later the incorporation of recently
synthetized material [18, 31]. Cell wall softening occurs
as a result of disruption of chemical bonds between
structural cell wall components, by acidification and
hydrolase enzymes, modifications which require an accurate and coordinated transcriptional regulation of
genes involved in biosynthesis and cell wall adaptations
[18, 31]. These enzymes modify hemicelluloses during
cell expansion and fruit softening, suggesting a direct influence on growth. Furthermore, cell expansion involves
changes in composition as well as the accumulation of
different compounds which maintain osmotic pressure
and water flux in cells in expansion [31, 52]. Evidence
obtained in this study agreed with these events where a
strong induction of genes associated with cell expansion
was observed, which probably results in larger berry
weights.
Our results suggest a relevant role of expansins in the
LB phenotype during the B68 stage. In the case of SB
segregants, genes with xyloglucan:xyloglucosyl transferase activity were found up-regulated in the same stage
(Additional file 7: Table S7). This evidence suggests a
differentiation in cell wall modifications, considering
that expansins have been proposed as cell wall activator
agents without hydrolytic activity. Likewise, up-regulated
endoglucanases were identified in LB segregants, which
are also associated with cell wall dynamics. Concomitantly, in the B68 stage genes related to auxin metabolism were also identified, up-regulated in the LB
phenotype, in line with the putative role of auxins in cell
expansion, involved in acid growth mediated by expansins [31, 53] (Additional file 7: Table S7).
Evidence obtained from the transcriptome analysis
suggested that major differences among LB and SB seedless segregants are triggered at the B68 stage, which may
be responsible for the final berry weight observed at harvest. In this stage berry diameter increases by cell expansion [14].
Other functional categories were associated with
secondary metabolism, transport of inorganic ions and
metals, proteosome-protein degradation, hormone
Muñoz-Espinoza et al. BMC Plant Biology (2016) 16:104
metabolism and signaling, development and chlorophyll biosynthesis (Additional file 10: Figure S2).
Regarding the group of 16 genes significantly correlated with component 2 (Table 2), two genes were identified coding for aspartic proteinase nepenthesin-1,
possibly associated with aspartic-type endopeptidase
activity [54], and senescence process (development); as
well as a serine carboxypeptidase-like 18 and endoglucanase 1, both related to cell wall metabolism (Additional
file 11: Figure S3). Furthermore, three genes were found
associated with hormonal metabolism and signaling,
coding for auxin-induced protein AUX22 and ARG2,
and pirin-like protein, related to calcium signaling.
Co-expression network analysis
Network analyses were performed to identify coexpression genes associated with the separation between
LB and SB segregants. Subsequently, correlation analyses
results lead to identify a total of 4,950 partial correlations,
431 of them significant (p < 0.05). Correlograms were
plotted with the total observed correlations (Additional
file 12: Figure S4), and correlations of over 90 % were
considered as significant (Additional file 13: Figure S5).
Page 9 of 17
Furthermore, 15 % of the significant correlations were
negative and more variable (CV = 5 %). Positive significant correlations represented 85 % and were less variable
(CV = 2.6 %). Five interconnected clusters of nodes were
identified (Fig. 4) (Additional file 14: Table S9).
These results were concordant with those obtained
from hierarchical clustering and PCA; the seven DE
genes selected as candidate markers for berry weight
from PCA analysis were also present in the network
analysis (Additional file 15: Figure S6). In addition,
according to the cluster connectivity our results agreed
with previous studies which described that highly connected genes were usually involved in the same biological pathways [55].
Cluster one was conformed mostly of genes coding for
HSPs and chaperonin proteins, including also a gene
coding for GDSL esterase/lipase and expansin-A8
(Fig. 4), all of them up-regulated in LB segregants. This
result is concordant with identification of the category
‘Protein folding’ over-represented in cluster 3 (Fig. 2c,
Additional file 9: Figure S1B), a process mediated by
HSP [56]. As these genes have been associated with heat
stress during berry development [56] and the response
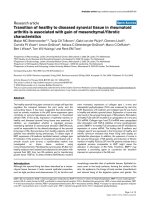
Fig. 4 Nodes of co-expressed genes among LB and SB segregants identified using a network analysis. Main components of each node are N1:
HSPs, chaperonins; N2: STBs, thaumatins; N3: monooxygenases; N4: cell wall modifications; N5: vacuolar transporters. Lines in red and green
represent negative and positive correlations, respectively
Muñoz-Espinoza et al. BMC Plant Biology (2016) 16:104
to microclimate changes in bunches [16, 57], this evidence suggests that LB segregants could respond more
efficiently to heat stress.
Negative correlations were among genes coding for
major allergen Pru av 1, associated with defense responses [58, 59], and expansin-A8; genes coding for chaperonins or HSPs were also found (Fig. 4).
Cluster two was composed mainly of genes coding for
PALs and STS, a gene co-expression previously reported
in cv. Syrah [37]; they were up-regulated in SB segregants in this study, in both phenological stages (Fig. 4;
Additional files 6 and 7). These results are concordant
with the identification of the over-represented categories
‘L-phenylalanine catabolic process’ and ‘Response to biotic stimulus’ found in cluster 5 (Fig. 2c, Additional file
9: Figure S1D, E).
STS expression has been considered as a response to
stress factors such as fungal diseases, wounding and UV
light [16, 60, 61], and a shift in phenylpropanoid pathway metabolites is highly sensitive to temperature
changes [56]. The differential expression of those genes
during berry development and maturation have been described in cv. Corvina [16, 40, 62], Norton [33] and
Moscatel de Hamburgo [35]. Hence these results suggest
that SB segregants presented a higher stress level during
berry development than LB segregants, possibly environmental due to high temperatures.
However, positive correlation was observed between
genes coding for expansin-A15 (code 80) and F-box/
LRR-repeat protein 3 (code 35), both negatively correlated with genes coding for stilbene synthases in the
cluster. F-box proteins act as regulators of the ubiquitin
kinase dependent pathway associated with protein degradation, an important post-translational mechanism.
Thus the removal of unfolded or non-functional proteins
facilitates the adaptation of organisms to environmental
changes, through rapid intracellular signaling [63].
In particular, expansin-A15 also showed negative correlation with genes coding for thaumatins, proteosome
subunits, inorganic transporters and proteins related to
pathogenesis (Additional file 14: Table S9), identified upregulated in SB segregants (Additional files 6 and 7).
Cluster three was composed mostly of genes with
monooxygenase and oxide-reductase activities, including
cytochrome P450, PR6 protease inhibitor and eugenol
synthase (Fig. 4). Genes belonging to the cytochrome
P450 family were found up-regulated in SB segregants
(Additional files 6 and 7), associated with phenylpropanoids, flavonoids, brassinosteroids and lignin synthesis.
Interestingly, it has been reported that cytochrome
P450-78A partially controls fruit size in tomato and possibly has a role in the domestication of this species [64].
Biosynthetic enzymes, redox regulators and HSP have
been described as effector genes related to abiotic stress
Page 10 of 17
responses [65]. However, genes coding for chloroplast
beta-amylase 3, gibberellin receptor GID1 and protein
WAX2, up-regulated in SB segregants, were negatively
correlated (Fig. 4).
WAX2 protein plays a role in the conversion or secretion of common precursors for cutins and wax metabolic pathways; it is also related to cuticle formation and
stomata, both involved in transpiration control and
drought tolerance as well [66].
Cluster 4 included a cohort of candidate enzymes
related to cell wall modification, with xyloglucan endotransglucosylase/hydrolase protein 23 (XTH) and glucan
endo-13-beta-glucosidase activities, positively correlated
(Fig. 4).
Interestingly, cluster 5 presented no edges with the
remaining clusters. Two branches were observed, the
first composed of genes coding for 60S ribosomal protein L7 and abscisic acid 8'-hydroxylase 3, all of them
positively correlated. The ribosomal protein modulation
suggests that the transcriptome reprogramming that occurs during berry maturation involves changes in protein
synthesis [16] (Fig. 4). A second branch included genes
coding for cysteine-rich receptor-like protein kinase 10;
vacuolar amino acid transporter 1, up-regulated in LB
segregants (Additional file 6: Table S6), possibly associated with amino acid compartmentalization in the vacuole [67]; cytokinin dehydrogenase 3, as well as
galactinol-sucrose galactosyltransferase; glutathione Stransferase, associated with the cellular response induced
by heat shock stress and auxins, and metals such as
cadmium, silver and copper [68]; and isoflavone-7-Omethyltransferase 9, related with flavonoid/isoflavonoid
metabolism and biotic stress responses [69], which were
positively regulated (Fig. 4).
Expression analysis of a group of candidate genes
associated with berry weight using qPCR
The expression profiles of seven DE genes were experimentally validated by real-time qPCR experiments, in
the phenological stages of anthesis (FL), fruit-setting
(FST) and berry 6–8 mm (B68) (Fig. 5), in order to select
candidate genes as putative factors associated with berry
weight determination.
The results of the network and PCA were considered
in the selection of candidate genes. Genes coding for
GDSL esterase/lipase, cytokinin dehydrogenase 3 and
stilbene synthase 6 were selected from the network analysis. In addition, the gene coding for HSP 17.9 kDa class
II was significantly correlated with PCA component 1.
In the case of the gene coding for GDSL esterase/lipase, experimental results confirmed its up-regulated
expression in LB segregants in the B68 stage (p < 0.05),
suggesting an increase in its expression in this stage in
both LB and SB segregants (Fig. 5a). In addition, the
Muñoz-Espinoza et al. BMC Plant Biology (2016) 16:104
Page 11 of 17
Fig. 5 Validation of differentially expressed (DE) genes among LB and SB segregants by real-time PCR. LB, large berries, in black; SB, small
berries, in grey. Phenological stages were anthesis (FL), fruit setting (FST) and berry 6–8 mm (B68). Genes are a GDSL esterase/lipase; b cytokinin
dehydrogenase 3; c stilbene synthase 6; d gene coding for 17.9 kDa class II HSP; e TF-bHLH60; f TF-bHLH93; g TF-bHLH96; different letters on
top of bars indicate significant differences (p < 0.05) according to one-way ANOVA and Tukey’s multiple comparison test among phenotypic
category/phenological stage; values are the results of 27 observations categorized by phenotype. The TCPb gene (possible T-complex protein
subunit beta, GSVIVG01008708001) was used as reference gene and gene expression was expressed as relative expression
gene coding for cytokinin dehydrogenase 3 was significantly up-regulated in LB segregants in the FST stage
(Tukey test, p < 0.05), with lower expression in both
groups of segregants at the B68 stage (Fig. 5b). Interestingly, the gene coding for stilbene synthase 6 showed a
tendency to be up-regulated in SB segregants in the
Muñoz-Espinoza et al. BMC Plant Biology (2016) 16:104
three evaluated stages. Significant differences were confirmed during FL and B68 (Tukey test, p < 0.05), being
higher in the latter stage (Fig. 5c).
In addition, the gene coding for HSP 17.9 kDa class II
(HSP17.9-D) showed similar expression in FL in LB and
SB segregants. However, in the FST and B68 stages it
was significantly up-regulated in LB segregants (Fig. 5d).
Considering that HSP17.9-D was also highly correlated
with component 1 of the PCA, it could be considered as
a potential candidate gene for berry weight.
Participation of bHLH proteins in plant organ size determination has been described. In particular in V. vinifera, the cell elongation protein bHLH (VvCEB1) has
been recently associated with berry weight in Cabernet
Sauvignon, possibly involved in cell expansion during
berry development [31]. Therefore, in order to evaluate
the possible role of members of this transcription factor
family in the differences between LB and SB segregants,
three DE genes coding for bHLH60, bHLH93 and
bHLH96 were selected to be experimentally confirmed
by real-time qPCR experiments.
The results showed that in the case of genes coding
for transcription factors (TFs), TF-bHLH60 was significantly up-regulated in SB segregants during the FL stage.
However, in the FST stage it was up-regulated in LB segregants (p < 0.05) (Fig. 5e). There was an inflexion in the
FST stage, with maximum expression for LB segregants
and minimum for SB segregants. The same tendency
was detected for TF-bHLH93, but with a significant differential expression during the FST and B68 stages, upregulated in LB segregants (Fig. 5f ). A similar expression
profile was observed in the gene coding for TF-bHLH96,
which was up-regulated in LB segregants at the FST
stage (Fig. 5g).
Interestingly, our results differ from previous reports
that proposed the gene VvCEB1 as a candidate marker
for berry size, whose transcripts are predominantly
accumulated in berries, especially with minimum auxin
content [31]. Indeed, the three TFs evaluated showed
higher expression in the FST stage comparing LB vs. SB
segregants, suggesting a possible role in early stages of
development. Experimental validation in advanced
phenological stages would confirm their expression profile in berries in order to determine if, as with VvCEB1,
these TFs plays a role in cell expansion in a wider genetic background.
Conclusions
We have carried out the first transcriptome analysis focused on seedless table grape segregants with contrasting phenotypes for berry weight. A group of 526
differentially expressed genes potentially associated with
berry size was identified, 101 genes in the FST stage and
463 genes in the B68 stage.
Page 12 of 17
The integration of differential expression, PCA,
correlation and network analysis provided a wide
characterization of overall regulation and dynamic
remodeling of the gene expression in berry development in pre-véraison stages. A survey of candidate
genes was also performed, and expression profiles of
seven candidate genes were validated.
Methods
Plant material
The ‘Ruby’ x ‘Sultanina’ (RxS) population (n = 139) is
planted at La Platina Experimental Station of the Instituto de Investigaciones Agropecuarias (INIA), located in
Santiago, Chile (Latitude 33°34’23.3”S, longitude 70°
37’35.73”W). This population is managed using a trendil
system known as ‘spanish parron’, grafted over cv. Sultanina, and two to four replicates are available per segregant (clones). Segregants were managed under standard
conditions for watering, fertilization, pest and diseases
control and pruning. Both parents are publicly available
resources and the segregants belong to the table grape
breeding program of INIA.
The segregants and both parents were sampled in
order to determine a number of quality-related traits;
sugar content and titratable acidity, berry and seed
weight and volume were the relevant traits for this
study. Phenotype robustness was evaluated over three
seasons (2009–2010 to 2011–2012), as well as health
condition and vigor.
Experimental design and sample collection
A group of six segregants of the RxS cross (N = 139),
named 19, 27, 112, 117, 151 and 359, plus both parents,
Ruby Seedless and Sultanina, were selected for transcriptome analysis. These segregants exhibited contrasting
phenotypes (Fisher test, p < 0.05) for berry size and
weight, i.e., small (SB) and large (LB), all of them
seedless (Fig. 1). Berry samples were collected in the
2009–2010 season 30 and 45 days after flowering, in
phenological stages of E-L 27 and E-L 31 [70, 71], corresponding to fruit setting (FST) and berries of 6–8 mm
diameter (B68), considered as early stages of berry development. Each genotype was sampled in two or three
replicates (clones), which were later considered as
technical replicates. Samples were collected in the field,
frozen in liquid N2 and stored at −80 °C until RNA
extraction.
RNA isolation from contrasting segregants for berry
weight, library construction and mRNA sequencing
For RNA-Seq experiments, pericarp and mesocarp
tissues were homogenized and analyzed together. Total
RNA was isolated from 3 to 4 g of frozen tissue using
the modified hot borate method [72]. The quantity and
Muñoz-Espinoza et al. BMC Plant Biology (2016) 16:104
quality of RNA was assessed by measuring the A260/280
ratio using a Nanodrop ACT GeneASP-2680 equipment,
and by agarose gel electrophoresis. RNA samples with
260/280 ratios between 1.8 and 2.2 were selected. Prior
to sequencing, RNA integrity values were evaluated
using a BioAnalyzer. Selected samples reported an RNA
Integrity Number (RIN) ≥ 7.0. RNAs were sequenced
after the corresponding cDNA synthesis, as described by
[73]. Sequencing was performed using an Illumina sequencing platform (Genome Analyzer II) (IGA, Udine,
Italy).
qPCR analysis followed the same RNA isolation protocol described above and cDNA were obtained by reverse
transcription reactions with 2 ug of total RNA as template, using MMLV-RT reverse transcriptase (Promega,
Madison, WI) and oligo dT primers according to standard procedures. The concentration of cDNA was
assessed by measuring the absorbance at 260 nm, using
a Nanodrop ACT Gene ASP-2680 equipment, finally diluting each cDNA to 50 ng/uL prior to use in qPCR
experiments.
Sequencing data analysis
A total of approximately 10 million single-end reads
were obtained per sequenced library, with an average
length of 50 bp. Reads were trimmed by sequencing
quality (Q20) and a minimum length of 30 bp. Trimmed,
good-quality reads were aligned to the grapevine reference genome (PN40024 12X.v1) [74] using Tophat software [75], with a maximum of two mismatches per read.
Multiple reads with more than 20 hits were discarded.
Reads were then normalized as fpkm expression values,
defined as reads per kilobase of exon per million reads
mapped, to make them comparable across experiments.
The reference grapevine genome and the gene annotation were downloaded from the GENOSCOPE database
[76]. The RNA-Seq data used in this study are available
at the NCBI’s Sequence Read Achieve [77] with SRA
Study accession number SRX366617 [73].
Differential expression analysis
In order to identify differentially expressed genes, libraries derived from LB segregants (19, 112, and 117) were
compared with SB segregant libraries (91, 151 and 359)
in phenological stages FST and B68. Segregants exhibiting the same phenotype for berry weight were considered as biological replicates in the analysis [78].
Differential expression analysis was done using Cuffdiff2 (v. 2.0.2) software [79], using a geometric data
normalization of library sizes (including replicates),
multi-reads and fragment bias correction. Significant
differences with p < 0.01 and a False Discovery Rate
(FDR) of 0.05 were considered in this analysis.
Page 13 of 17
Cluster analysis and gene ontology assignment
Hierarchical clustering (HCL) was performed using
Pearson’s correlation distance and GENE-E software
[80]. A gene ontology (GO) enrichment analysis was performed considering 526 differentially expressed genes
(DE genes) grouped in five clusters, obtained from comparison of LB vs. SB segregants in the FST and B68
stages. The frequency of query genes was compared with
the complete reference genome for V. vinifera
(PN40024), searching for possible enrichment in biological processes. Analyses were performed using agriGO
tool [81], with the singular enrichment analysis and
complete GO options. Significant GO terms (p < 0.05)
were calculated using the hypergeometric distribution
and the Yekutieli multi-test adjustment method [42].
Principal components analysis
A principal components analysis with the group of 526
DE genes obtained from comparison of LB and SB segregants in the FST and B68 stages was performed using
the FactoMineR library [82] and R statistical software
[83]. Then, in order to identify candidate genes, i.e.,
transcripts whose absence, presence or expression level
could be able to discriminate between segregants, a correlation analysis between DE genes and components 1
and 2 derived from PCA was performed. Thus significantly correlated DE genes (p < 0.05) were selected as
candidate genes.
Gene co-expression network analysis
To perform the network analysis a matrix of Pearson
correlations was developed, based on average values for
each phenotype, which was later represented in a correlogram using the corrplot library [84] and R software
[83]. Subsequently, a partial correlation analysis was performed using the PCIT library [85] and R software. Significant correlations were plotted in a correlogram.
Later, correlations were considered for a network analysis using R qgraph [86]. Network analysis consisted of
the representation of correlations between variables in a
set of nodes connected by edges, which showed the correlation between variables [87].
Gene expression analysis by qPCR
Quantitative real-time PCR expression analysis (qPCR)
of the seven selected genes was performed in the group
of six segregants with contrasting phenotypes for berry
weight, in the phenological stages of anthesis (FL), fruitsetting (FST) and berry of 6–8 mm (B68), corresponding
respectively to E-L 23, E-L 27 and E-L 31 [70, 71]. qPCR
were carried out using StepOne™Real-Time PCR System
equipment (Applied Biosystems, Carlsbad, California).
The qPCR amplification reactions were performed in a
total volume of 10 μl containing 1 μL cDNA (50 ng/μL),
Muñoz-Espinoza et al. BMC Plant Biology (2016) 16:104
1 μL primer mix (from 400 nM to 600 nM depending
on the gene), 5 μL FastStart Essential DNA Green
Master (2X) (Roche, Mannheim, Germany), and 3 μL
nuclease-free water. The thermal cycling conditions were
denaturation at 95 °C for 10 min, followed by 40 cycles
of template denaturation at 95 °C for 15 s, primer
annealing at 60 °C for 1 min and extension at 72 °C for
25 s. The amplicon specificity was verified through melting curve analysis, 60 °C to 95 °C, with a gradient of
0.3 °C after 40 cycles. For each segregant three biological
replicates (clones) were used, with three technical replicates per point. In addition, three segregants representative of SB or LB phenotypes were used per point,
corresponding to a total of 27 observations. Values were
normalized based on the housekeeping gene TCPb,
which codes for a putative protein complex T subunit ß
(GSVIVG01008708001) [73]. Statistical analysis of qPCR
results involved ANOVA and Tukey tests (p < 0.05), and
were performed using the statistical package Infostat
(v2012) [88].
Primer design
Specific primers for genes being analyzed were designed
using PRIMER three software [89], according to parameters described by [90], and checked in silico using the
Operon software [91]. Primers were synthesized by Integrated DNA Technologies, Inc. (Coralville, Iowa). The
nucleotide sequences of the genes of interest were
downloaded from a private database maintained at [92].
Primers used in real-time experiments (qRT-PCR) are
summarized in Additional file 16: Table S10.
Ethics approval and consent to participate
Page 14 of 17
Additional file 4: Table S4. Read mapping distribution summary.
(PDF 49 kb)
Additional file 5: Table S5. Unmapped reads summary describing the
total of contigs mapped to the reference genome using MegaBlast
program. (PDF 57 kb)
Additional file 6: Table S6. Differentially expressed (DE) genes
identified in the comparison between LB and SB segregants, in the FST
stage (Cuffdiff2, p < 0.01). (PDF 117 kb)
Additional file 7: Table S7. Differentially expressed (DE) genes
identified in the comparison between LB and SB segregants, in the B68
stage (Cuffdiff2, p < 0.01). (PDF 327 kb)
Additional file 8: Table S8. List of 37 DE genes (p < 0.01) identified in
the FST and B68 stages in the comparisons between LB and SB
segregants. (PDF 69 kb)
Additional file 9: Figure S1. A, B, C, D, E. GO enrichment of five clusters
identified in hierarchical clustering of 526 DE genes, from comparison
between LB and SB segregants. A. GO categories over-represented in
Cluster 1 (Biological Process); B. GO categories over-represented in Cluster 3
(Biological Process); C. GO categories over-represented in Cluster 4
(Molecular Function); D. GO categories over-represented in Cluster 5
(Biological Process); E. GO categories over-represented in Cluster 5
(Molecular Function). Biological Process and Molecular Function categories
are shown, and only significantly over-represented categories were
considered (p < 0.05 and FDR < 0.05). The analysis was performed using
the online agriGO tool and the GO complete category. The boxes
contain the GO number, the p-value (in parentheses), the category
description, the number of genes in each category associated with the
GO term versus the total of query genes and the number of genes in
each category out of 14,511 genes of the reference genome of Vitis
vinifera (PN40024, 12X.v1), with associated GO terms. The arrows
indicate the relationships among the GO categories, as follows: black
solid arrows mean that a GO category is also included in the other one;
red solid arrows mean that one GO category positively regulates the
other; green solid arrows mean that the GO category negatively
regulates the other; black dashed arrows indicate that there are two
significant nodes related to the GO category; and black dotted arrows
indicate that only one significant node is related to the GO category.
(PDF 567 kb)
Additional file 10: Figure S2. Functional characterization of 68
candidate genes significantly correlated with PCA component 1,
associated with differences between LB and SB segregants. (PDF 96 kb)
Not applicable.
Additional file 11: Figure S3. Functional characterization of 16
candidate genes significantly correlated with PCA component 2,
associated with differences between FST and B68 stages. (PDF 87 kb)
Consent for publication
Additional file 12: Figure S4. Correlogram representing a total of 4,950
partial correlations, including significant and non-significant correlations,
found among the group of 100 DE genes with the highest significance,
associated with differences between LB and SB segregants, in the FST
and B68 stages. The color indicates the type of correlation i.e., negative
significant correlations are in red while positive significant correlations
are shown in blue. Intensity of colors indicates strength of correlations;
darker shades represent higher or more negative values. (PDF 174 kb)
Not applicable.
Availability of data and material
The RNA-Seq data used in this study is available at the
NCBI’s Sequence Read Achieve (.
nih.gov/sra) with the SRA Study accession number
SRX366617.
Additional files
Additional file 1: Table S1. Phenotypical characterization of berry
weight at harvest of six RxS segregants exhibiting contrasting
phenotypes for berry weight, including parents cv Ruby Seedless and
Sultanina. Analyses were performed during the 2009–2010 to 2011–2012
seasons. SEM is the standard error of the mean and CV is the coefficient
of variation. (PDF 59 kb)
Additional file 2: Table S2. Read quality summary considering the
total 14 libraries. (PDF 46 kb)
Additional file 3: Table S3. Read mapping summary. (PDF 54 kb)
Additional file 13: Figure S5. Correlogram representing 431 significant
correlations (p < 0.05), found among the group of 100 DE genes with the
highest significance, associated with differences between LB and SB
segregants in the FST and B68 stages. Correlograms were plotted with
the total of observed correlations. The color indicates the type of
correlation i.e., negative significant correlations are in red while positive
significant correlations are shown in blue. Intensity of colors indicates
strength of correlations; darker shades represent higher or more negative
values. (PDF 132 kb)
Additional file 14: Table S9. Summary of significant partial correlations
observed in the group of 100 DE genes with high significance, associated
with differences between LB and SB segregants, in the FST and B68
stages. (PDF 295 kb)
Additional file 15: Figure S6. Network analysis of co-expressed genes
among LB and SB segregants. In blue and red are represented DE genes
Muñoz-Espinoza et al. BMC Plant Biology (2016) 16:104
Page 15 of 17
that are part of the network, which respectively present or not significant
correlation with component 1 of the PCA analysis, selected as candidate
genes for berry weight. Lines in red and blue represent negative and
positive correlations, respectively. (PDF 64 kb)
7.
Additional file 16: Table S10. Primers designed for the analysis of the
expression level of the seven candidate genes, based on real-time qPCR.
(PDF 63 kb)
8.
Abbreviations
B68: berry 6–8 mm stage; DE: differentially expressed; FST: fruit set stage;
GO: gene ontology; HSP: heat shock protein; INIA: Instituto de
Investigaciones Agropecuarias; LB: large berry segregants;
PAL: phenylalanine-ammonium lyase; PCA: principal components analysis;
qPCR: Real-Time PCR; QTL: quantitative trait loci; SB: small berry segregants;
STS: stilbene synthases.
Competing interest
The authors declare that they have no competing interests.
Authors’ contributions
CME, PH and AO conceived the experimental design; AM, AO and PH
supervised the project; CME analyzed and interpreted the data, performed
bioinformatic and statistical analyses, designed the qPCR experiments and
wrote the first version of the manuscript; AD carried out bioinformatic
analysis of NGS data; JC carried out experimental field work and statistical
analyses; RS performed the qPCR experiments and statistical analyses; AD,
AM, MGA, AO and PH critically reviewed the manuscript. All authors
approved the final manuscript.
Acknowledgements
This work was mainly supported by FONDEF-Chile Genoma Program, grant
G07I-1002, and Fondecyt grants 1120888 and 3150519. CME was a recipient
of a doctoral fellowship from Mecesup Program. We are also grateful to the
Fondap project 15090007, Basal project PB-16 and the National Laboratory
for High Performance Computing at the Center for Mathematical Modeling,
Santiago, Chile.
Author details
1
Instituto de Investigaciones Agropecuarias, INIA-La Platina, Santa Rosa 11,
610 Santiago, Chile. 2Centro de Biotecnología Vegetal, Universidad Andrés
Bello, Av. Repúbica 217, Santiago, Chile. 3Center for Mathematical Modeling
(UMI2807-CNRS) and Department of Mathematical Engineering, Faculty of
Mathematical and Physical Sciences, University of Chile, Av. Blanco Encalada
2120, 7th Floor, Santiago, Chile. 4Center for Genome Regulation, Av. Blanco
Encalada 2085, 3rd floor, Santiago, Chile.
9.
10.
11.
12.
13.
14.
15.
16.
17.
18.
19.
20.
Received: 10 January 2016 Accepted: 18 April 2016
21.
References
1. Food and Agriculture Organization of United Nations. Statistics division.
. Accessed 05 Oct 2015.
2. Aradhya MK, Dangl GS, Prins BH, Boursiquot JM, Walker A, Meredith CP,
Simon CJ. Genetic structure and differentiation in cultivated grape Vitis
vinifera L. Genet Res. 2003;81:179–92. doi:10.1017/S0016672303006177.
3. Salmaso M, Faes G, Segala C, Stefanini M, Salakhutdinov L, Zyprian E,
Toepfer R, Grando MS, Velasco R. Genome diversity and gene haplotypes in
the grapevine (Vitis vinifera), as revealed by single nucleotide
polymorphisms. Mol Breed. 2004;14:385–95.
4. Myles S, Boyko AR, Owens CL, Brown PJ, Grassi F, Aradhya MK, Prins B,
Reynolds A, Chia JM, Ware D, Bustamante CD, Buckler ES. Genetic structure
and domestication history of the grape. Proc Natl Acad Sci U S A. 2011;108:
3530–5. doi:10.1073/pnas.1009363108.
5. Costenaro da Silva D, Passaia G, Henriques JAP, Margis R, Pasquali G, Revers
L. Identification and expression analysis of genes associated with the early
berry development in the seedless grapevine (Vitis vinifera L.) cultivar
Sultanine. Plant Sci. 2010;179:510–9.
6. Doligez A, Bertrand Y, Farnos M, Grolier M, Romieu C, Esnault F, Dias S,
Berger G, Francois P, Pons T, Ortigosa P, Roux C, Houel C, Laucou V, Bacilieri
R, Péros JP, This P. New stable QTLs for berry weight do not colocalize with
22.
23.
24.
25.
26.
27.
28.
QTLs for seed traits in cultivated grapevine (Vitis vinifera L.). BMC Plant Biol.
2013;13:217. doi:10.1186/1471-2229-13-217.
Houel C, Martin-Magniette ML, Nicolas SD, Lacombe T, Le Cunff L, Franck D,
Torregrosa L, Conéjéro G, Lalet S, This P, Adam-Blondon AF. Genetic
variability of berry size in the grapevine (Vitis vinifera L.). Aust J Grape Wine
Res. 2013;19:208–20. doi:10.1111/ajgw.12021.
Correa J, Mamani M, Muñoz-Espinoza C, Laborie D, Muñoz C, Pinto M,
Hinrichsen P. Heritability and identification of QTLs and underlying candidate
genes associated with the architecture of the grapevine cluster (Vitis vinifera L.).
Theor Appl Genet. 2014;127:1143–62. doi:10.1007/s00122-014-2286-y.
Correa J, Ravest G, Laborie D, Mamani M, Torres E, Muñoz C, Pinto M,
Hinrichsen P. Quantitative trait loci for the response to gibberellic acid of
berry size and seed mass in tablegrape (Vitis vinifera L.). Aust J Grape Wine
Res. 2015;21:496–507. doi:10.1111/ajgw.12141.
Fanizza G, Lamaj F, Costantini L, Chaabane R, Grando MS. QTL analysis for
fruit yield components in table grapes (Vitis vinifera). Theor Appl Genet.
2005;111:658–64. doi:10.1007/s00122-005-2016-6.
Barba P, Cadle-Davidson L, Harriman J, Glaubitz JC, Brooks S, Hyma K, Reisch
B. Grapevine powdery mildew resistance and susceptibility loci identified on
a high-resolution SNP map. Theor Appl Genet. 2014;127:73–84. doi:10.1007/
s00122-013-2202-x.
Amrine KCH, Blanco-Ulate B, Riaz S, Pap D, Jones L, Figueroa-Balderas R,
Walker MA, Cantu D. Comparative transcriptomics of Central Asian Vitis
vinifera accessions reveals distinct defense strategies against powdery
mildew. Hortic Res. 2015;2:15037. doi:10.1038/hortres.2015.37.
Bogrë L, Okresz L, Henriques R, Anthony R. Growth signaling pathways in
Arabidopsis and the AGC protein kinases. Trends Plant Sci. 2003;8:424–31.
Coombe BG, McCarthy MG. Dynamics of grape berry growth and
physiology of ripening. Aust J Grape Wine R. 2000;6:131–5.
Carmona MJ, Chaïb J, Martínez-Zapater JM, Thomas MR. A molecular
genetic perspective of reproductive development in grapevine. J Exp Bot.
2008;59:2579–96. doi:10.1093/jxb/ern160.
Dal Santo S, Tornielli GB, Zenoni S, Fasoli M, Farina L, Anesi A, Guzzo F,
Delledonne M, Pezzotti M. The plasticity of the grapevine berry
transcriptome. Genome Biol. 2013;14:R54. doi:10.1186/gb-2013-14-6-r54.
Nitsch JP, Pratt C, Nitsch C, Shaulis NJ. Natural growth substances in
concord and concord seedless grapes in relation to Berry development.
Am J Bot. 1960;47:566–76. doi:10.2307/2439435.
Coombe BG. Research on development and ripening of the grape berry.
Am J Enol Viticult. 1992;43:101–10.
Friend AP, Trought MCT, Creasy GL. The influence of seed weight on the
development and growth of berries and live green ovaries in Vitis vinifera L.
cvs. Pinot Noir and Cabernet Sauvignon. Aust J Grape Wine Res. 2009;15:
166–74. doi:10.1111/j.1755-0238.2009.00050.x.
Barticevic M, Zavala K, De Felice S, Valenzuela C, Muñoz C, Hinrichsen P.
Caracterización fenotípica de segregantes identificados con marcadores de
microsatélites, con énfasis en apirenia y respuesta a ácido giberélico en
crecimiento de bayas de uva. Agric Téc (Chile). 2004;64:3–16.
Cabezas JA, Cervera MT, Ruiz-Garcia L, Carreño J, Martinez-Zapater JM. A
genetic analysis of seed and berry weight in grapevine. Genome. 2006;49:
1572–85. doi:10.1139/g06-122.
Mejía N, Gebauer M, Muñoz L, Hewstone N, Muñoz C, Hinrichsen P.
Identification of QTLs for seedlessness, berry size, and ripening date in a
seedless x seedless table grape progeny. Am J Enol Vitic. 2007;58:499–507.
Costantini L, Battilana J, Lamaj F, Fanizza G, Grando MS. Berry and phenologyrelated traits in grapevine (Vitis vinifera L.): from quantitative trait loci to
underlying genes. BMC Plant Biol. 2008;8:38. doi:10.1186/1471-2229-8-38.
Mejía N, Soto B, Guerrero M, Casanueva X, Houel C, Miccono MA, Ramos R.
Le Cunff L, Boursiquot JM, Hinrichsen P, Adam-Blondon AF. Molecular,
genetic and transcriptional evidence for a role of VvAGL11 in
stenospermocarpic seedlessness in grapevine. BMC Plant Biol. 2011;11:57.
doi:10.1186/1471-2229-11-57.
Moreno D, Berli F, Piccoli P, Bottini R. Gibberellins and abscisic acid promote
carbon allocation in roots and berries of grapevines. J Plant Growth Regul.
2011;30:220–8. doi:10.1007/s00344-010-9186-4.
Pratt C. Reproductive anatomy in cultivated grapes - a review. Am J Enol
Viticult. 1971;22:92–109.
Ledbetter CA, Ramming DW. Seedlessness in grapes. Hort Rev. 1989;11:159–84.
Cramer GR, Ghan R, Schlauch KA, Tillent R, Heymann H, Ferrarini A, Delledonne
M, Zenoni S, Fasoli M, Pezzotti M. Transcriptomic analysis of the late stages of
grapevine (Vitis vinifera cv. Cabernet Sauvignon) berry ripening reveals
Muñoz-Espinoza et al. BMC Plant Biology (2016) 16:104
29.
30.
31.
32.
33.
34.
35.
36.
37.
38.
39.
40.
41.
42.
43.
44.
45.
46.
significant induction of ethylene signaling and flavor pathways in the skin.
BMC Plant Biol. 2014;14:370. doi:10.1186/s12870-014-0370-8.
Conde C, Silva P, Fontes N, Dias A, Tavares R, Sousa A, Delrot S, Geros H.
Biochemical changes throughout grape berry development and fruit and
wine quality. Food. 2007;1:1–22.
Fischer BM, Salakhutdinov I, Akkurt M, Eibach R, Edwards KJ, Töpfer R,
Zyprian EM. Quantitative trait locus analysis of fungal disease resistance
factors on a molecular map of grapevine. Theor Appl Genet. 2004;108:501–
15. doi:10.1007/s00122-003-1445-3.
Nicolas P, Lecourieux D, Gomès E, Delrot S, Lecourieux F. The grape berryspecific basic helix–loop–helix transcription factor VvCEB1 affects cell size.
J Exp Bot. 2013;64:991–1003. doi:10.1093/jxb/ers374.
Tello J, Torres-Pérez R, Grimplet J, Carbonell-Bejerano P, Martínez-Zapater
JM, Ibáñez J. Polymorphisms and minihaplotypes in the VvNAC26 gene
associate with berry size variation in grapevine. BMC Plant Biol. 2015;15:253.
doi:10.1186/s12870-015-0622-2.
Ali MB, Howard S, Chen S, Wang Y, Yu O, Kovacs LG, Qiu W. Berry skin
development in Norton grape: distinct patterns of transcriptional
regulation and flavonoids biosynthesis. BMC Plant Biol. 2011;11:7. doi:10.
1186/1471-2229-11-7.
Guillaumie S, Fouquet R, Kappel C, Camps C, Terrier N, Moncomble D,
Dunlevy JD, Davies C, Boss PK, Delrot S. Transcriptional analysis of late
ripening stages of grapevine berry. BMC Plant Biol. 2011;11:165. doi:10.1186/
1471-2229-11-165.
Lijavetzki D, Carbonell-Bejerano P, Grimplet J, Bravo G, Flores P, Fenoll J,
Hellín P, Okiveros JC, Martínez-Zapater JM. Berry flesh and skin ripening
features in Vitis vinifera assessed by transcriptional profiling. PLoS ONE. 2012;
7, e39547. doi:10.1371/journal.pone.0039547.
Zenoni S, Ferrarini A, Giacomelli E, Xumerle L, Fasoli M, Malerba G, Bellin D,
Pezzotti M, Delledonne M. Characterization of transcriptional complexity
during berry development in Vitis vinifera using RNA-Seq. Plant Physiol.
2010;152:1787–95. doi:10.1104/pp.109.149716.
Sweetman C, Wong DCJ, Ford CM, Drew DP. Transcriptome analysis at four
developmental stages of grape berry (Vitis vinifera cv. Shiraz) provides
insights into regulated and coordinated gene expression. BMC Genomics.
2012;13:691. doi:10.1186/1471-2164-13-691.
da Silva FG, Iandolino A, Al-Kayal F, Bohlmann M, Cushman MA, Lim H,
Ergul A, Figueroa R, Kabuloglu EK, Osborne C, Rowe J, Tattersall E, Leslie A,
Xu J, Baek J, Cramer GR, Cushman JC, Cook D. Characterizing the grape
trascriptome. Analysis of expressed sequence tags from multiple vitis
species and development of a compendium of gene expression during
berry development. Plant Physiol. 2005;139:574–97. doi:10.1104/pp.105.
065748.
Deluc L, Grimplet J, Wheatley M, Tillett RL, Quilici D, Osborne C, Schooley
DA, Schlauch KA, Cushman JC, Cramer GR. Transcriptomic and metabolite
analysis of Cabernet Sauvignon grape berry development. BMC Genomics.
2007;8:429. doi:10.1186/1471-2164-8-429.
Fasoli M, Del Canto S, Zenoni S, Tornielli JB, Farina L, Zamboni A, Porceddu
A, Venturini L, Bicego M, Murino V, Ferrarini A, Delledonne M, Pezzotti M.
The grapevine expression atlas reveals a deep transcriptome shift driving
the entire plant into a maturation program. Plant Cell. 2012;24:3489–505.
doi:10.1105/tpc.112.100230.
Pérez FJ, Viani C, Retamales J. Bioactive gibberellins in seeded and seedless
grapes: identification and changes in content during berry development.
Am J Enol Viticult. 2000;51:315–8.
Du Z, Zhou X, Ling Y, Zhang Z, Su Z. agriGO: a GO analysis toolkit for the
agricultural community. Nucleic Acids Res. 2010;38:W64–70. doi:10.1093/nar/
gkq310.
Yang K, Rong W, Qi L, Li J, Wei X, Zhang Z. Isolation and characterization of
a novel wheat cysteine-rich receptor-like kinase gene induced by
Rhizoctonia cerealis. Scientific Reports. 2013;3:3021. doi:10.1038/srep03021.
Chen K, Fan B, Du L, Chen Z. Activation of hypersensitive cell death by
pathogeninduced receptorlike protein kinases from Arabidopsis. Plant Mol
Biol. 2004;56:271–83.
Negri AS, Prinsi B, Rossoni M, Failla O, Scienza A, Cocucci M, Espen L.
Proteome changes in the skin of the grape cultivar Barbera among different
stages of ripening. BMC Genomics. 2008;9:378. doi:10.1186/1471-2164-9-378.
Martínez-Esteso MJ, Sellés-Marchart S, Lijavetzky D, Pedreño MA, BruMartinez R. A DIGE-based quantitative proteomic analysis of grape berry
flesh development and ripening reveals key events in sugar and organic
acid metabolism. J Exp Bot. 2011;62:2521–69. doi:10.1093/jxb/erq434.
Page 16 of 17
47. Guo J, Su G, Zhang J, Wang G. Genetic analysis and QTL mapping of maize
yield and associate agronomic traits under semi-arid land condition. Afr J
Biotechnol. 2008;7:1829–38.
48. Yokotani N, Ichikawa T, Kondou Y, Matsui M, Hirochika H, Iwabuchi M, Oda
K. Expression of rice heat stress transcription factor OsHs- fA2e enhances
tolerance to environmental stresses in transgenic Arabidopsis. Planta. 2008;
227:957–67.
49. Dyda F, Klein DC, Hickman AB. GCN5-related N-acetyltransferases: a
structural overview. Annu Rev Biophys Biomol Struct. 2000;29:81–103. doi:10.
1146/annurev.biophys.29.1.81.
50. Wang N, Zheng Y, Xin H, Fang L, Li S. Comprehensive analysis of NAC
domain transcription factor gene family in Vitis vinifera. Plant Cell Rep. 2013;
32:61–75. doi:10.1007/s00299-012-1340-y.
51. Fernandez L, Ageorges A, Torregrosa L. A putative NAP homolog specifically
expressed during grapevine flower and berry development. Vitis. 2006;45:51–2.
52. Carrari F, Fernie AR. Metabolic regulation underlying tomato fruit
development. J Exp Bot. 2006;57:1883–97.
53. Schenck D, Christian M, Jones A, Lüthen H. Rapid auxin- induced cell
expansion and gene expression: a four-decade-old question revisited. Plant
Physiol. 2010;152:1183–5. doi:10.1104/pp.109.149591.
54. Athauda SBP, Matsumoto K, Rajapakshe S, Kuribayashi M, Kojima M,
Kubomura-Yoshida N, Iwamatsu A, Shibata C, Inoue I, Takahashi K. Enzymic
and structural characterization of nepenthesin, a unique member of a novel
subfamily of aspartic proteinases. Biochem J. 2004;381:295–306. doi:10.1042/
BJ20031575.
55. Palumbo MC, Zenoni S, Fasoli M, Massonnet M, Farina L, Castiglione F,
Pezzotti M, Paci P. Integrated network analysis identifies fight-club nodes as
a class of hubs encompassing Key putative switch genes that induce major
transcriptome reprogramming during grapevine development. Plant Cell.
2014;26:4617–35. doi:10.1105/tpc.114.133710.
56. Rienth M, Torregrosa L, Luchaire N, Chatbanyong R, Lecourieux D, Kelly MT,
Romieu C. Day and night heat stress trigger different transcriptomic
responses in green and ripening grapevine (Vitis vinifera) fruit. BMC Plant
Biol. 2014;14:108. doi:10.1186/1471-2229-14-108.
57. Pastore C, Zenoni S, Fasoli M, Pezzotti M, Tornielli GB, Filippetti I. Selective
defoliation affects plant growth, fruit transcriptional ripening program and
flavonoid metabolism in grapevine. BMC Plant Biol. 2013;13:30. doi:10.1186/
1471-2229-13-30.
58. Neudecker P, Schweimer K, Nerkamp J, Scheurer S, Vieths S, Sticht H, Rösch
P. Allergic cross-reactivity made visible - Solution structure of the major
cherry allergen Pru av 1. J Biol Chem. 2001;276:22756–63. doi:10.1074/jbc.
M101657200.
59. Lu M, Han YP, Gao JG, Wang XJ, Li WB. Identification and analysis of the
germin-like gene family in soybean. BMC Genomics. 2010;11:620. doi:10.
1186/1471-2164-12-16.
60. Langcake P, Pryce RJ. The production of resveratrol by Vitis vinifera and
other members of the Vitaceae as a response to infection or injury. Physiol
Mol Plant Pathol. 1976;9:77–86.
61. Bais AJ, Murphy PJ, Dry IB. The molecular regulation of stilbene phytoalexin
biosynthesis in Vitis vinifera during grape berry development. Funct Plant
Biol. 2000;27:723–723.
62. Zamboni A, Di Carli M, Guzzo F, Stocchero M, Zenoni S, Ferrarini A, Tononi
P, Toffali K, Desiderio A, Lilley K, Pé ME, Benvenuto E, Delledonne M,
Pezzotti M. Identification of putative stage-specific grapevine berry
biomarkers and omics data integration into networks. Plant Physiol. 2010;
154:1439–59. doi:10.1104/pp.110.160275.
63. Schumann N, Navarro-Quezada A, Ullrich K, Kuhl C, Quint M. Molecular
evolution and selection patterns of plant F-Box proteins with C-Terminal
Kelch repeats. Plant Physiol. 2011;155:835–50. doi:10.1104/pp.110.166579.
64. Chakrabarti M, Zhang N, Sauvage C, Muños S, Blanca J, Cañizares J, Diez MJ,
Schneider R, Mazourek M, McClead J, Causse M, van der Knaap E. A
cytochrome P450 regulates a domestication trait in cultivated tomato. Proc
Natl Acad Sci U S A. 2013;110:17125–30. doi:10.1073/pnas.1307313110.
65. Xu J, Yuan Y, Xu Y, Zhang G, Guo X, Wu F, Wang Q, Rong T, Pan G, Cao M,
Tang Q, Gao S, Liu Y, Wang J, Lan H, Lu Y. Identification of candidate genes
for drought tolerance by whole-genome resequencing in maize. BMC Plant
Biol. 2014;14:83. doi:10.1186/1471-2229-14-83.
66. Chen X, Goodwin SM, Boroff VL, Liu X, Jenks MA. Cloning and
characterization of the WAX2 gene of Arabidopsis involved in cuticle
membrane and wax production. Plant Cell. 2003;15:1170–85. doi:10.1105/
tpc.010926.
Muñoz-Espinoza et al. BMC Plant Biology (2016) 16:104
67. Sekito T, Fujiki Y, Ohsumi Y, Kakinuma Y. Novel families of vacuolar amino
acid transporters. IUBMB Life. 2008;60:519–25. doi:10.1002/iub.92.
68. Chen C, Song Y, Zhuang K, Li L, Xia Y, Shen Z. Proteomic Analysis of
Copper-Binding Proteins in Excess Copper-Stressed Roots of Two Rice
(Oryza sativa L.) Varieties with Different Cu Tolerances. PLoS ONE. 2015;10,
e0125367. doi:10.1371/journal.pone.0125367.
69. Debeaujon I, Peeters AJM, Léon-Kloosterziel KM, Koornneef M. The transparent
testa12 gene of Arabidopsis encodes a multidrug secondary transporter-like
protein required for flavonoid sequestration in vacuoles of the seed coat
endothelium. Plant Cell. 2001;13:853–71. doi:10.1105/tpc.13.4.853.
70. Coombe BG. Adoption of a system for identifying grapevine growth stages.
Aust J Grape Wine R. 1995;1:100–10.
71. Lorenz DH, Eichhorn KW, Bleiholder H, Klose R, Meier U, Weber E.
Phenological growth stages of the grapevine (Vitis vinifera L.ssp. vinifera)Codes and descriptions according to the extended BBCH scale. Aust J
Grape Wine Res. 1995;1:100–10. doi:10.1111/j.1755-0238.1995.tb00085.x.
72. Gudenschwager O, González-Agüero M, Defilippi BG. A general method for
high-quality RNA isolation from metabolite-rich fruits. S Afr J Bot. 2012;83:
186–92. doi:10.1016/j.sajb.2012.08.004.
73. González-Agüero M, García-Rojas M, Di Genova A, Correa J, Maass A,
Orellana A, Hinrichsen P. Identification of two putative reference genes from
grapevine suitable for gene expression analysis in berry and related tissues
derived from RNA-Seq data. BMC Genomics. 2013;14:878. doi:10.1186/14712164-14-878.
74. Jaillon O, Aury JM, Noel B, Policriti A, Clepet C, Casagrande A, Choisne N,
Aubourg S, Vitulo N, Jubin C, Vezzi A, Legeai F, Hugueney P, Dasilva C,
Horner D, Mica E, Jublot D, Poulain J, Bruyere C, Billault A, Segurens B,
Gouyvenoux M, Ugarte E, Cattonaro F, Anthouard V, Vico V, Del Fabbro C,
Alaux M, Di Gaspero G, Dumas V, et al. The grapevine genome sequence
suggests ancestral hexaploidization in major angiosperm phyla. Nature.
2007;449:463–7. doi:10.1038/nature06148.
75. Trapnell C, Pachter L, Salzberg SL. TopHat: discovering splice junctions with
RNA-Seq. Bioinformatics. 2009;25:1105–11. doi:10.1093/bioinformatics/btp120.
76. GENOSCOPE database. />GenomeBrowser/Vitis. Accesed 12 May 2013.
77. NCBI’s Sequence Read Achieve. Accesed
09 June 2013.
78. Almeida AM, Urra C, Moraga C, Jego M, Flores A, Meisel L, González M,
Infante R, Defilippi BG, Campos-Vargas R, Orellana A. Proteomic analysis of a
segregant population reveals candidate proteins linked to mealiness in
peach. J Proteomics. 2016;131:71–81. doi:10.1016/j.jprot.2015.10.011.
79. Roberts A, Trapnell C, Donaghey J, Rinn JL, Pachter L. Improving RNA-Seq
expression estimates by correcting for fragment bias. Genome Biol. 2011;12:
R22. doi:10.1186/gb-2011-12-3-r22.
80. GENE-E. . Accesed 01 Dec 2014.
81. agriGO tool. Accesed 09 Jan 2015.
82. Lê S, Josse J, Husson F. FactoMineR: An R Package for Multivariate Analysis. J
Stat Softw. 2008;25:1–18.
83. R Core Team. R: A Language and Environment for Statistical Computing. Vienna:
R Foundation for Statistical Computing; 2012. />84. Wei T. corrplot: Visualization of a correlation matrix, R package version 0.72.
2013. />85. Watson-Haigh NS, Kadarmideen HN, Reverter A. PCIT: an R package for
weighted gene co-expression networks based on partial correlation and
information theory approaches. Bioinformatics. 2010;26:411–3. doi:10.1093/
bioinformatics/btp674.
86. Epskamp S, Cramer AOJ, Waldorp LJ, Schmittmann VD, Borsboom D.
qgraph: Network Visualizations of Relationships in Psychometric Data. J Stat
Softw. 2012;48:1–18. />87. Ursem R, Tikunov Y, Bovy A, Berloo R, Eeuwijk F. A correlation network
approach to metabolic data analysis for tomato fruits. Euphytica. 2008;161:
181–93. doi:10.1007/s10681-008-9672-y.
88. Infostat (v2012). Accesed 20 Aug. 2014.
89. PRIMER 3. Accesed 15 Mar 2014.
90. Taylor S, Wakem M, Dijkman G, Alsarraj M, Nguyen M. A practical approach
to RT-qPCR-Publishing data that conform to the MIQE guidelines. Methods.
2010;50:S1–5. doi:10.1016/j.ymeth.2010.01.005.
91. Operon software. />Accesed 01 April 2014.
92. Accesed 08 Jan 2014.
Page 17 of 17
Submit your next manuscript to BioMed Central
and we will help you at every step:
• We accept pre-submission inquiries
• Our selector tool helps you to find the most relevant journal
• We provide round the clock customer support
• Convenient online submission
• Thorough peer review
• Inclusion in PubMed and all major indexing services
• Maximum visibility for your research
Submit your manuscript at
www.biomedcentral.com/submit