Comparative proteomics illustrates the complexity of drought resistance mechanisms in two wheat (Triticum aestivum L.) cultivars under dehydration and rehydration
Bạn đang xem bản rút gọn của tài liệu. Xem và tải ngay bản đầy đủ của tài liệu tại đây (2.01 MB, 23 trang )
Cheng et al. BMC Plant Biology (2016) 16:188
DOI 10.1186/s12870-016-0871-8
RESEARCH ARTICLE
Open Access
Comparative proteomics illustrates the
complexity of drought resistance
mechanisms in two wheat (Triticum
aestivum L.) cultivars under dehydration
and rehydration
Lixiang Cheng1†, Yuping Wang1†, Qiang He1, Huijun Li1,2, Xiaojing Zhang1,3 and Feng Zhang1*
Abstract
Background: Drought stress is one of the most adverse environmental constraints to plant growth and productivity.
Comparative proteomics of drought-tolerant and sensitive wheat genotypes is a strategy to understand the complexity
of molecular mechanism of wheat in response to drought. This study attempted to extend findings regarding the
potential proteomic dynamics in wheat under drought stress and to enrich the research content of drought tolerance
mechanism.
Results: A comparative proteomics approach was applied to analyze proteome change of Xihan No. 2 (a droughttolerant cultivar) and Longchun 23 (a drought-sensitive cultivar) subjected to a range of dehydration treatments (18 h,
24 h and 48 h) and rehydration treatment (R24 h) using 2-DE, respectively. Quantitative image analysis showed a total
of 172 protein spots in Xihan No. 2 and 215 spots from Longchun 23 with their abundance significantly altered
(p < 0.05) more than 2.5-fold. Out of these spots, a total of 84 and 64 differentially abundant proteins were
identified by MALDI-TOF/TOF MS in Xihan No. 2 and Longchun 23, respectively. Most of these identified proteins were
involved in metabolism, photosynthesis, defence and protein translation/processing/degradation in both two cultivars.
In addition, the proteins involved in redox homeostasis, energy, transcription, cellular structure, signalling and transport
were also identified. Furthermore, the comparative analysis of drought-responsive proteome allowed for the general
elucidation of the major mechanisms associated with differential responses to drought of both two cultivars. These
cellular processes work more cooperatively to re-establish homeostasis in Xihan No. 2 than Longchun 23. The
resistance mechanisms of Xihan No. 2 mainly included changes in the metabolism of carbohydrates and amino acids
as well as in the activation of more antioxidation and defense systems and in the levels of proteins involved in ATP
synthesis and protein degradation/refolding.
(Continued on next page)
* Correspondence:
†
Equal contributors
1
College of Agronomy, Gansu Provincial Key Laboratory of Aridland Crop
Science, Gansu Key Laboratory of Crop Improvement & Germplasm
Enhancement, Research & Testing Center, Gansu Agricultural University,
Lanzhou, China
Full list of author information is available at the end of the article
© 2016 The Author(s). Open Access This article is distributed under the terms of the Creative Commons Attribution 4.0
International License ( which permits unrestricted use, distribution, and
reproduction in any medium, provided you give appropriate credit to the original author(s) and the source, provide a link to
the Creative Commons license, and indicate if changes were made. The Creative Commons Public Domain Dedication waiver
( applies to the data made available in this article, unless otherwise stated.
Cheng et al. BMC Plant Biology (2016) 16:188
Page 2 of 23
(Continued from previous page)
Conclusions: This study revealed that the levels of a number of proteins involved in various cellular processes were
affected by drought stress in two wheat cultivars with different drought tolerance. The results showed that there exist
specific responses to drought in Xihan No. 2 and Longchun 23. The proposed hypothetical model would explain the
interaction of these identified proteins that are associated with drought-responses in two cultivars, and help in
developing strategies to improve drought tolerance in wheat.
Keywords: Wheat, Drought stress, Differentially abundant proteins, Proteomics, 2-DE, MALDI-TOF/TOF
Abbreviations: 2-DE, Two-dimensional gel electrophoresis; ABA, Abscisic acid; ABF, ABA-binding factor; ACP, Acid
phosphatase; ALDHs, Aldehyde dehydrogenases; APX, Ascorbate peroxidise; AREB, ABA-responsive element binding
protein; CAT, Catalase; CBB, Coomassie brilliant blue; CBF, C-repeat-binding factor; CBS, Cystathionine β-synthase;
CRT, Calreticulin; DHN, Dehydrin; DMAB, 3-dimethyaminobenzoic acid; DREB, Dehydration-responsive element binding
protein; DW, Dry weight; FBA, Fructose-1,6-bisphosphate aldolase; FBP, Fructose-1,6-bisphosphate; FDH, Formate
dehydrogenase; FW, Fresh weight; GAP, Glyceraldehyde-3-phosphate; GAPDH, Glyceraldehyde-3-phosphate
dehydrogenase; GPX, Glutathione peroxidise; GR, Glutathione reductase; GS, Glutamine synthetase; GSH, Glutathione;
GST, Glutathione S-transferase; HSPs, Heat shock proteins; IP3, 1,4,5-triphosphate; MAPK, Mitogen-activated protein
kinase; MBTH, 3-methyl, 2-benzo thiazolinone hydrazone; MDA, Malonaldehyde; MYB, Myeloblastosis oncogene;
MYC, Myelocytomatosis oncogene; NBT, Nitroblue tetrazolium; OEE, Oxygen-evolving enhancer; POX, Peroxidase;
PPP, Pentose phosphate pathway; PS II, Photosystem II; PVP, Polyvinypyrrolidone; ROS, Reactive oxygen species;
RuBisCO, Ribulose-1,5-bisphosphate carboxylase/oxygenase; RWC, Relative water content; weight; SAMS, Sadenosylmethionine synthase; SE, Standard error; SOD, Superoxide dismutase; TBA, Thiobarbituric acid;
TPI, Triosephosphate isomerise; TW, Turgid weight; UXS, UDP-glucuronate decarboxylase; VDAC, Voltage
dependent anion channel; γ-GCS, Gamma-glutamylcysteine synthetase
Background
Drought is one of the most adverse environment stress
factors that negatively affects plant growth and development, which adversely leads to the yield losses of major
crops worldwide every year [1]. Of the 1.5 billion hectares of global cropland, only 20 % were irrigated that
provides about 40 % of the world’s food production,
whereas the remaining 60 % was provided by rain-fed
agriculture. Wheat (Triticum aestivum L.) as the world’s
most important cereal crop is grown in a large range of
latitudes worldwide under both irrigated and rain-fed
conditions and thus in conditions subjected to drought.
Wheat is considered as an excellent system to study
drought tolerance in spite of its genetic complexity [2].
Recently, the completion of chromosome-based draft sequencing of hexaploid bread wheat genome will accelerate wheat breeding and identification of key genes
controlling complex traits in response to drought [3].
Based on the wheat genome sequencing data, much research effort would be applied to gain better understanding of mechanisms adopted by wheat to combat drought
stress.
To date, some physiological and molecular mechanisms of plants to cope with drought stress have been
extensively described by many researchers. When plants
are subjected to drought stress, an early response is the
rapid closure of stomata triggered by ABA for decreasing
water loss from leaves [4, 5]. The transient increases of
ABA level under water deficit condition can also trigger
many downstream stress responses [6]. Two major responses have emerged in terms of cellular and molecular
basis in coping with drought. First, the initial response is
closely related to osmotic adjustment [7]. The accumulated osmolytes include proline, glutamate, glycinebetaine and sugars (mannitol, sorbitol and trehalose),
which play a key role in preventing membrane disintegration and enzyme inactivation under drought stress
[8, 9]. Second, a large number of drought-responsive
genes and specific protective proteins were induced
for drought tolerance [10, 11]. These drought stressrelated transcripts and proteins are mostly involved in
signalling transduction and activation/regulation of
transcription, antioxidants and reactive oxygen species
(ROS) scavengers [12]. Most of the important transcription regulon in drought-induced ABA signalling pathways
have been identified, such as dehydration-responsive
element binding protein (DREB), C-repeat-binding factor
(CBF), ABA-responsive element binding protein (AREB),
ABA-binding factor (ABF), myelocytomatosis oncogene
(MYC) and myeloblastosis oncogene (MYB) [13–15].
DREB and CBF function in ABA-independent gene expression, whereas AREB, ABF, MYC and MYB function in
ABA-dependent gene expression [16]. In wheat, stressinducible expression of TaDREB2 and TaDREB3 genes
demonstrated substantial resistance to drought stress [17].
Over-expression of TaNAC69 leads to enhanced transcript
levels of stress up-regulated genes and dehydration tolerance in bread wheat [18]. A MYB gene from wheat,
Cheng et al. BMC Plant Biology (2016) 16:188
TaMYBsdu1, is up-regulated under drought stress and
differentially regulated between tolerant and sensitive genotypes [19]. For the ROS-scavenging pathways, the deleterious effects of ROS under drought stress need to be
quickly scavenged to protect cells from oxidative damage.
Some antioxidant enzymes, such as superoxide dismutase
(SOD), catalase (CAT), ascorbate peroxidase (APX), glutathione peroxidase (GPX), glutathione reductase (GR) and
glutathione S-transferase (GST), are responsible for ROSscavenging [6]. Drought-induced up-regulation of these
proteins suggested the presence of well-equipped antioxidant system in plant cells to cope with drought stress
[20, 21]. Apart from antioxidants, accumulation of
molecular chaperons (HSP17, HSP70, Chap60, dnaK)
helps in refolding of misfolded proteins [22]. In addition,
inducible synthesis of dehydrin (DHN) proteins further
provides protection to membranes against dehydration
damage [23]. The association between accumulation of
DHN family members and drought tolerance has been
shown in some species, such as wheat [24, 25], tomato
[26], gentian [27] and white clover [28].
Despite intensive studies on drought-responsive mechanisms in plants [29–32], drought tolerance mechanisms
remain largely unknown due to a complex nature of the
quantitative trait. It is known that different cultivars
within a crop species may greatly differ in their response
and adaptation to drought stress [21, 33]. The information available on the molecular basis of drought tolerance in different wheat genotypes is still limited.
Previous studies at transcriptomic level have revealed
that the drought-tolerant and sensitive wheat genotypes
can adopt different molecular strategies to cope with
drought stress [34–37]. One of the main differences is
the differential expression of some drought-inducible
genes for protection (e.g., antioxidants, detoxifiers, dehydrins, transporters and compatible solutes), regulation
(e.g., kinases, transcription factors and hormones) and
remodelling (e.g., membrane systems, cell wall and primary metabolic networks) [25, 30, 31, 37]. A large number of these well-known drought-related genes can often
be activated in drought-sensitive wheat genotype, while
the tolerant genotype shows the constitutive expression
of several genes activated by drought in sensitive genotype, which might contribute to limit drought effect and
perception [37]. In addition, signal transduction and
hormone-dependent regulation pathways are also different in different wheat genotypes [35, 38]. The droughttolerant genotype can quickly sense drought and trigger
the signal transduction pathways for activation of downstream elements for survival from drought stress. The
differential expression of phospholipase C gene involved
in inositol-1, 4, 5-triphosphate (IP3) signalling and
mitogen-activated protein kinase (MAPK) cascade elements has been reported in two contrasting wheat
Page 3 of 23
genotypes [35]. Some transcription factors also have
unique responses to drought stress in different wheat genotypes, suggesting differences in hormone-dependent
regulation pathways. A drought-tolerant wheat genotype
has been reported to show induction of bZIP and HDZIP gene known as transcription factors relevant to ABA
regulatory pathway under drought stress, whereas the
sensitive genotype induced transcription factors that
bind to ethylene responsive elements [35]. Although
these studies have provided important insights to some
extent, the data at transcriptional level are always insufficient to predict protein expression due to posttranscriptional and post-translational regulation mechanisms [39]. There is far less information available on the
functional products of these identified genes, leading to
poor knowledge of correlations between transcriptomes
and proteomes in drought-tolerant and sensitive wheat
genotypes under drought stress.
Proteomics has become the most direct and powerful
tool to obtain protein expression information of plants
in response to drought stress [9, 20]. It can provide the
global protein expression profile encoded by genome,
thereby complementing transcriptomic studies [40].
Comparative proteomics of drought-tolerant and sensitive wheat genotypes is a strategy to understand the
complexity of molecular mechanism of wheat in response to drought stress. Recently, a few published studies have been applied to describe proteome changes in
different wheat genotypes under drought stress [41–45].
A small set of drought-inducible proteins was also identified from these studies in various wheat organs including seedling leaves, stems, roots and grains. Differential
expression of these proteins in different wheat genotypes
may be responsible for the stronger drought resistance
of tolerant genotypes. Although these studies have provided some insight into the molecular mechanisms of
different wheat genotypes in response to drought stress,
the limited information cannot be enough to establish
the possible drought-responsive proteins network for
explaining the different drought-responsive strategy in
drought-tolerant and sensitive genotypes. Furthermore,
it is conceivable that there may be many novel droughtinducible proteins yet to be identified in previous studies. Thus, our observations attempt to extend findings
regarding the potential proteomic dynamics in droughttolerant and sensitive wheat genotypes under drought
stress and to enrich the research content of drought tolerance mechanism.
In the present study, a comparative proteomics approach was applied to investigate the molecular events
of two wheat cultivars in response to drought stress,
Xihan No. 2 (drought-tolerant cultivar) and Longchun
23 (drought-sensitive cultivar), respectively. The differentially abundant proteins including well-known and
Cheng et al. BMC Plant Biology (2016) 16:188
novel drought-responsive proteins were identified in two
cultivars under drought stress using 2-DE coupled with
MALDI-TOF/TOF MS and Mascot database searching.
The findings will help drive further work to develop
strategies for improving drought tolerance and water use
efficiency of wheat, and to gain comprehensive knowledge of the underlying molecular mechanisms involved
in drought response.
Methods
Plant materials, growth conditions and dehydration
treatments
Seeds of wheat (Triticum aestivum L. cvs. Xihan No. 2
and Longchun 23) were supplied by Gansu Provincial
Key Laboratory of Aridland Crop Science, Lanzhou,
China. The two wheat cultivars were different in drought
resistance. In arid area with a rainfall of 250–300 mm,
the average yield of Xihan No. 2 (a drought-tolerant cultivar, approved by the National Crop Variety Approval
Committee of China in 2007) was 15–45 % higher than
Longchun 23 (a drought-sensitive cultivar), which itself
produced only 50 % of the yield compared with optimal
watering. The seeds of two cultivars were sucking water
to break seed dormancy for 2 days at 25 ± 2 °C, then
they were sown in glass plates containing expanded
perlite in an environmentally controlled growth room
with 25 ± 2 °C, 70 % relative humidity and 16 h
photoperiod (300 μmol m−2 · s−1 light intensity). Initially, the plants were irrigated with 300 ml of water
every day that maintained the moisture content at
about 30 %. After a week, drought treatment was carried out in 1-week-old seedlings by withholding water for
48 h, and then re-watered for the recovery of dehydrated
seedlings. The leaf samples were taken in triplicate from
both stressed/re-watered plants and continuously watered
controls after 18 h, 24 h and 48 h of dehydration and 24 h
of rehydration, respectively. The samples from controls
were collected at each time point during dehydration and
were finally pooled to normalize the growth and developmental effects. The fresh leaves were directly used to determine the physiological and biochemical responses of
wheat seedlings under drought stress. Another part of
leaves was immediately frozen in liquid nitrogen and
stored at −80 °C until the further processing of proteomic
analysis.
Determination of relative water content
The relative water content (RWC) was measured as described by Bhushan et al. [9]. Fresh leaves were sampled
and immediately weighted for fresh weight (FW). To determine turgid weight (TW), the leaves were incubated
in distilled water in darkness at 4 °C for 24 h to
minimize respiration losses until fully turgid. Dry weight
(DW) was determined by drying the fully turgid leaves
Page 4 of 23
in an oven at 80 °C for 48 h. The RWC was calculated
by the following formula: RWC (%) = [(FW - DW) /
(TW - DW)] × 100.
Determination of proline accumulation
Proline was extracted and determined by the method of
Bates et al. [46]. Approximately 0.5 g of fresh leaves was
homogenized in 5 ml of 3 % (w/v) aqueous sulfosalicylic
acid. The homogenate was centrifuged at 5 000 × g for
15 min at 4 °C. The supernatant was treated with acid
ninhydrin reagent and glacial acetic acid (1:1, v/v), boiled
at 100 °C for 1 h, then the reaction was terminated on
ice for 5 min. The absorbance of reaction mixture was
read at 520 nm. Proline content was determined from
standard curve and calculated on a fresh weight basis
(μg · g FW−1).
Determination of lipid peroxidation
Malonaldehyde (MDA) content as an important index
of lipid peroxidation was measured following the
methods of Hodges et al. [47]. Approximately 0.5 g of
fresh leaves was homogenized in 5 ml of 0.1 % (w/v)
trichloroacetic acid (TCA). The homogenate was centrifuged at 10 000 × g for 15 min at 4 °C, and 1 ml of
supernatant was added to 2 ml of 0.5 % (v/v) TBA in
20 % TCA. The mixture was incubated at 100 °C for
30 min and then quickly cooled in an ice bath. After
centrifuged at 10 000 × g for 10 min at 4 °C, the absorbance of supernatant was recorded at 450 nm, 532 nm
and 600 nm, respectively. The non-specific absorbance at
600 nm was subtracted, and a standard curve of sucrose
was used to rectify the possible interference of soluble
sugars in samples. MDA content was calculated using an
extinction coefficient of 155 mM−1 cm−1and expressed as
μg · g FW−1.
Determination of electrolyte leakage
Electkrolyte leakage was assayed according to Yan et al.
[48]. Fresh leaves were cut into 1 cm segments and
washed three times with ultrapure water. The segments
were incubated in a tube containing 10 ml of ultrapure
water at room temperature for 2 h. Two hours later,
conductivity (C1) was recorded using a conductivity
meter (INESA, China). Then, the tubes were incubated
at 100 °C for 20 min. After the solution was cooled to
room temperature, conductivity (C2) was recorded again.
Electrolyte leakage was calculated by the following formula: Electrolyte leakage (%) = C1 / C2 × 100.
Determination of photosynthetic pigments
Approximately 1 g of fresh leaves was extracted in 10 ml
of 80 % chilled acetone. After centrifuged at 3 000 × g
for 2 min at 4 °C, the supernatant was used for the determination of photosynthetic pigments. The absorbance
Cheng et al. BMC Plant Biology (2016) 16:188
of supernatant was recorded at 663 nm, 645 nm and
470 nm, respectively. Chlorophyll and carotenoid content was calculated as described by Bhushan et al. [9]
and expressed as mg · g FW−1.
Determination of H2O2 content
H2O2 content was determined by the peroxidasecoupled assay according to Veljovic-Jovanovic et al. [49].
Approximately 0.2 g of fresh leaves was ground in liquid
nitrogen and the powder was extracted in 2 ml of 1 M
HClO4 in the presence of 5 % insoluble polyvinylpyrrolidone (PVP). The homogenate was centrifuged at 12
000 × g for 10 min and the supernatant was neutralized
with 5 M K2CO3 to pH 5.6 in the presence of 100 ml 0.3
M phosphate buffer (pH 5.6). The solution was centrifuged at 12 000 × g for 1 min and the sample was incubated for 10 min with 1 U ascorbate oxidase (Sigma, St.
Louis, USA) to oxidize ascorbate prior to assay. The reaction mixture consisted of 0.1 M phosphate buffer (pH
6.5), 3.3 mM DMAB (3-dimethylaminobenzoic acid)
(Sigma, St. Louis, USA), 0.07 mM MBTH (3-methyl, 2benzo thiazolinone hydrazone) (Sigma, St. Louis, USA)
and 0.3 U POX (peroxidase) (Sigma, St. Louis, USA).
The reaction was initiated by addition of 200 ml sample.
The absorbance change at 590 nm was monitored at
25 °C.
Enzyme assay
Approximately 1 g of fresh leaves was homogenized
in 5 ml of extraction buffer [50 mM K-phosphate
buffer (pH 7.8), 1 mM Na-EDTA and 1 % (w/v)
PVP]. The homogenate was centrifuged at 15 000 × g
for 20 min at 4 °C, and the supernatant was used to
assay the enzyme activity. All the steps in the preparation of enzyme extracts were performed at 4 °C.
Total superoxide dismutase (SOD) activity was measured by nitroblue tetrazolium (NBT) method of Beyer &
Fridovich [50] and expressed as units · mg protein−1. Catalase (CAT) activity was assayed by monitoring the consumption of H2O2 at 240 nm (E = 39.4 mM−1 cm−1)
according to the method of Aebi [51] and expressed as
μmol · min−1 · mg protein−1.
Protein extraction
Total leaf proteins were extracted from the control and
treatment seedlings as described by Donnelly et al. [52]
with some modifications. Approximately 2 g of leaves
were homogenized in liquid nitrogen. The homogenate
was precipitated overnight at −20 °C by the addition of
25 ml of chilled 10 % (w/v) TCA/acetone containing
1 mM PMSF and 0.07 % (v/v) β-mercaptoethanol.
After centrifuged at 20 000 × g for 20 min at 4 °C,
the pellet was collected and incubated at −20 °C for
20 min. Then pellet was washed and resuspended
Page 5 of 23
with 20 ml of chilled acetone containing 1 mM PMSF
and 0.07 % (v/v) β-mercaptoethanol. After centrifuged
at 15 000 × g for 15 min at 4 °C, the pellet was collected and incubated at −20 °C for 10 min. The steps
were repeated until the pellet became pure white. The
washed pellet was air-dried for 1 h and then solubilized in
250 μl of rehydration buffer [8 M urea, 2 % (v/v) Triton
X-100, 1 % (w/v) DTT, 1 mM PMSF] for 2 h at room
temperature. After centrifuged at 15 000 × g for 15 min at
4 °C, the supernatant was collected and stored at −80 °C.
The protein extraction was repeated three times, and the
protein concentration was measured using Bio-Rad
Protein Assay Kit (Bio-Rad, Hercules, CA, USA) according to the manufacturer’s instructions with bovine serum
albumin (BSA) as the standard.
2-DE (Two-dimensional polyacrylamide gel electrophoresis)
The first dimension of the isoelectric focusing (IEF) was
performed using 17 cm immobilised pH gradients (IPG)
strips (Bio-Rad, Hercules, CA, USA) with pH gradients
3–10 in PROTEAN IEF Cell System (Bio-Rad, Hercules,
CA, USA). The IPG strips were rehydrated overnight
with 900 μg of total proteins diluted in rehydration buffer [7 M urea, 2 M thiourea, 2 % (w/v) CHAPS, 0.3 %
(w/v) DTT, 0.5 % (v/v) IPG buffer (pH3-10) and 0.001 %
(w/v) bromophenol blue] to reach a final volume of
350 μl. After rehydration, the focusing was performed
at 20 °C using the following settings: 50 V during 14 h,
gradient to 250 V during 0.5 h, gradient to 1 000 V in 1 h,
gradient to 10 000 V in 5 h, 10 000 V until 60 000 Vh.
Prior to second dimension electrophoresis, the IPG strips
were equilibrated at room temperature for 15 min in
5 ml of equilibration buffer [6 M urea, 2 % (w/v)
SDS, 20 % (v/v) glycerol, 0.375 M Tris-HCl (pH8.8)
and 0.2 % (w/v) DTT], and subsequently for 15 min
in the same buffer but 2.5 % (w/v) iodoacetamide replacing DTT. The equilibrated strips were loaded and
run on 12 % SDS-PAGE gels using PROTEANII xi
Cell System (Bio-Rad, Hercules, CA, USA) with a
programmable power controller. The gels were run
for 15 min at 50 V, then at constant voltage 200 V
until the dye front reached the bottom of gel. The
separated proteins were visualized by coomassie brilliant blue (CBB) G-250 staining. For each protein
sample, three replicates were run for each gel to ascertain reproducibility.
Image acquisition and data analysis
The CBB-stained 2-DE gels were scanned with a UMAX
PowerLook 2100XL-USB scanner (Maxium Tech Inc.,
Taiwan, China) at 600 bits per pixel and scan resolution
of 300 dpi in a transmission mode. Image analysis was
subsequently carried out with PDQuest v8.0.1 software
(Bio-Rad, Hercules, CA, USA), including background
Cheng et al. BMC Plant Biology (2016) 16:188
subtraction, spot detection, spot measurement and spot
matching. The gel image of control was selected as a reference gel to align with gel image of dehydration (18 h,
24 h and 48 h) and rehydration (R24 h), respectively.
The abundance of one protein spot was expressed as the
volume of that spot which was defined as the sum of the
intensities of all the pixels that make up that spot. To
minimize possible errors due to differences in the
amount of protein loaded and the staining intensity, the
spot abundance was normalised as a percentage of the
total spot volume in the gel. The normalised percentage
volume (Relative V%) of protein spots from triplicate
biological samples were subjected to statistical analysis
using means ± standard error (SE). At least nine images
derived from three biological replicates of each treatment were compared, which were obtained in the same
experimental set. We used one-way analyses of variance
(ANOVA) to evaluate the significance (p < 0.05) of protein differential expression. Only spots with statistical
significance (p < 0.05) and reproducible changes were
considered, and the spots with an abundance ratio at
least 2.5-fold in relative abundance were selected as differentially abundant proteins. These spots were then selected for protein identification using MALDI-TOF/TOF
MS.
Tryptic digestion
Spots with significantly differential expression from 2DE gels were carefully excised. Gel spots were washed
twice for 30 min with deionized water, and then
destained and dehydrated with acetonitrile (ACN). After
washed twice for 30 min at room temperature with vigorous shaking in 400 μl of 50 % ACN containing 50 mM
ammonium bicarbonate, the gel spots were incubated
overnight with 400 μl of 100 % ACN and then dried.
Proteins were digested for 18 h at 37 °C in 10 μl of
15 ng/μl trypsin solution. The supernatant was collected, and the fluid was further extracted twice from
gel spots with 50 μl of 50 % ACN containing 5 % trifluoroacetic acid (TFA) for 1 h at 37 °C. Finally, all
the extractions were pooled with the trypsin supernatant and dried.
Page 6 of 23
shots per subspectrum were accumulated using a random search pattern. MS was used a CalMix5 standard to
calibrate the instrument (ABI 4700 Calibration Mixture).
For MS calibration, autolysis peaks of trypsin (m/z
842.5100 and 2211.1046) were used as internal calibrates, and up to 10 of the most intense ion signals were
selected as precursors for MS/MS acquisition, excluding
the trypsin autolysis peaks and the matrix ion signals. In
MS/MS positive-ion mode, for one main MS spectrum
50 subspectra with 50 shots per subspectrum were accumulated using a random search pattern. Collision energy
was 1-kV, collision gas was air, and default calibration
was set by using the Glu1-Fibrino-peptide B (m/z
1570.6696) spotted onto Cal 7 positions of the MALDI
target. Both the MS and MS/MS data were integrated
and extracted using GPS Explore v3.6 software (AB
SCIEX, Framingham, MA, USA). Peptides were identified by searching for taxonomy (Viridiplantae, green
plants; 1022713 sequences) in the NCBInr database
20120107 (16831682 sequences; 5781564572 residues)
using Mascot v2.2 search engine (Matrix science, London,
UK). The parameters for searching were: enzyme equals
trypsin; one missed cleavage; allowed variable oxidation
modifications (Met); allowed fixed modifications of carbamidomethyl (Cys); peptide mass tolerance of 100 ppm;
fragment mass tolerance of 0.3 Da. The significance
threshold (p < 0.05) was set using the Mascot algorithm.
Functional classification and hierarchical clustering
analysis
The functional classification of the identified proteins
was conducted according to the putative functions
assigned to each of the candidates using the protein
function database. A hierarchical clustering analysis
was performed by using the Multi Experiment Viewer
(MEV) software (Pearson correlation, default parameters). The data were taken in terms of -fold expression with respect to the control expression value.
Then, the data sets were log-transformed to the base
2 to level the scale of expression and reduce the
noise. Only the clusters with n > 6 were taken to investigate the co-expression patterns for functionally
similar proteins.
Protein identification by MALDI-TOF/TOF MS
For MALDI-TOF/TOF MS, digested protein samples
were mixed (1:1, v/v) with the matrix solution [7 mg/ml
α-cyano-4-hydroxycinnamic-acid in 50 % (v/v) ACN and
0.1 % (w/v) TFA], and then 0.7 μl of this mixture was
spotted on the MALDI target. Tryptic peptides were
analysed using an ABI 4800 Plus MALDI-TOF/TOF™
Analyzer (AB SCIEX, Framingham, MA, USA). The MS
spectra were recorded in the positive reflector mode in a
mass range from 800 to 4000 with a focus mass of 2000.
For one main MS spectrum 25 subspectra with 125
Statistical analysis
Statistical analysis was carried out with three biological
replicates for proteomic and physiological analyses. The
repeated measurement was given as means ± standard
error (SE). The results of spot abundance and physiological data were statistically evaluated by one-way analyses of variance (ANOVA) and the Duncan’s multiple
range test to determine the significant difference among
group means. In all cases, significance was defined as
p < 0.05.
Cheng et al. BMC Plant Biology (2016) 16:188
Results
The morphological and physiological responses induced
by drought stress in wheat seedlings
One-week-old seedlings of two wheat cultivars were subjected to gradual dehydration treatments over 48 h.
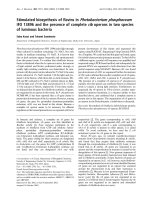
There were no visible morphological changes in seedlings until 18 h dehydration treatment, but the leaves of
both two cultivars began to roll after 24 h, and the damage was further aggravated at 48 h (Fig. 1). After 24 h rehydration, the seedlings of Xihan No. 2 were obviously
recovered and no recovery was found in Longchun 23
(Fig. 1). During the whole drought stress period, Xihan
No. 2 still showed a higher RWC than Longchun 23
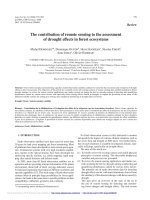
(Fig. 2a). The RWC was significantly declined by 35.8 %
in Longchun 23 but only declined by 15.8 % in Xihan
No. 2 after 24 h dehydration treatment, and sharply declined in both two cultivars at 48 h. After 24 h rehydration, the RWC of Xihan No. 2 rapidly reached higher
value (79.5 %) as compared with Longchun 23 (56.4 %).
A rapid accumulation of free proline was observed in
Xihan No. 2 after 18 h dehydration treatment, but it was
found in Longchun 23 until 48 h (Fig. 2b). After 48 h dehydration treatment, proline content was sharply increased by 8.86-fold in Xihan No. 2 but only increased
by 4.99-fold in Longchun 23. MDA and electrolyte leakage as important indexes of membrane injury were measured (Fig. 2c and d). MDA content of Longchun 23 was
significantly increased by 68.25 % after 48 h dehydration
treatment, whereas no obviously increase was found in
Xihan No. 2 (Fig. 2c). It was significantly decreased in
both two cultivars after 24 h rehydration. Electrolyte
leakage showed a sharp rise in Longchun 23 with the increase of drought stress, whereas there was a significant
increase in Xihan No. 2 until 48 h dehydration treatment
(Fig. 2d). As compared with a 1.69-fold increase in
Xihan No. 2, the increase was occurred in Longchun 23
by 2.44-fold after 48 h dehydration treatment. It was significantly decreased in both two cultivars after 24 h
Page 7 of 23
rehydration. The correlation between photosynthetic
pigments and drought stress was examined (Fig. 2e
and f ). Chlorophyll content in both two cultivars was
significantly declined during all the stages of drought
stress, and the decrease occurred in Longchun 23 by
45.10 % as compared with a decrease only by 30.10 %
in Xihan No. 2 after 48 h dehydration treatment
(Fig. 2e). Carotenoid content also showed a significant
decline in both two cultivars during all the stages of
drought stress, and it decreased after 24 h rehydration
(Fig. 2f). The oxidative damage induced by drought stress
was also examined (Fig. 2g, h and i). The H2O2 level in
Longchun 23 was higher than Xihan No. 2 during all the
stages of drought stress (Fig. 2g). H2O2 content was rapidly increased by 241.41 % in Longchun 23 after 48 h dehydration treatment but only increased by 166.39 % in
Xihan No. 2. After 24 h rehydration, H2O2 content of two
cultivars was decreased. The activity of SOD and CAT in
both two cultivars was initially increased until 24 h dehydration treatment, and then decreased by 42.02 % and
14.10 % in Longchun 23 at 48 h as compared with a decrease only by 21.22 and 11.26 % in Xihan No. 2, respectively (Fig. 2h and i).
Identification of drought-responsive proteins by 2-DE and
MS in two wheat cultivars
Comparative proteomics analysis was used to investigate
the changes of protein profiles in two wheat cultivars under
drought stress. Total leaf proteins of control, dehydration
treatments (18 h, 24 h and 48 h) and rehydration treatment
(R24 h) was extracted and separated by 2-DE, and three
replicate gels for control and each treatment were obtaind
(Additional file 1: Figure S3, Additional file 2: Figure S4).
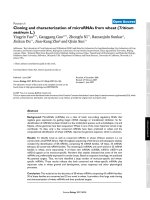
Figures 3 and 4 showed the representative standard gel
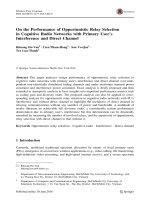
maps of Xihan No. 2 and Longchun 23, respectively. The
total numbers of protein spots reproducibly detected from
control, dehydration treatments (18 h, 24 h and 48 h) and
rehydration treatment (R24 h) in Xihan No. 2 were 880 ± 41,
Fig. 1 The drought-induced morphological responses in wheat seedlings. The wheat seeds of Xihan No. 2 and Longchun 23 were sown in glass
plates containing expanded perlite in an environmentally controlled growth room with 25 ± 2 °C, 70 % relative humidity and 16 h photoperiod
(300 μmol m−2 · s−1 light intensity). One-week-old seedlings were subjected to progressive drought stress up to 48 h. Then, the glass plates were
re-watered for the recovery of dehydrated seedlings. The photographs of two wheat cultivars were taken from 0 h, dehydration treatments (18 h,
24 h and 48 h) and rehydration treatment (R24 h), respectively
Cheng et al. BMC Plant Biology (2016) 16:188
a
b
Xihan No.2
Longchun 23
b
c
80
c
d
d d
60
40
20
80
b
60
a
c
40
20
a
d
b
b
b
1.2
a
c
d
b
b
b
b
d
5
0
18
24
48
0.6
g
14
a
12
10
8
b
b
6
c
d
4
a
c
c
0
18
b
b
24
Time (h)
b
c
b
0.8
48
R24
d
e
c
c
d
0.6
0.4
0.2
0.0
0
18
24
48
e
0.4
0.2
12
b
8
b
c
c
c
c
c
4
2
0
18
24
Time (h)
48
R24
48
0.05
R24
a
a
0.04
a
b
b
c
c
d
c
0.03
d
0.02
0.01
0.00
0
18
24
48
R24
Time (h)
Xihan No.2
Longchun 23
14
a
b
24
Time (h)
Xihan No.2
Longchun 23
i
a
10
18
0.06
Xihan No.2
Longchun 23
14
0
a
a
b
0
R24
Time (h)
6
a
f
a
1.0
h
Xihan No.2
Longchun 23
16
d
a
R24
Xihan No.2
Longchun 23
a
R24
Time (h)
c
0.8
12
a
a
10
b
-1
b
48
1.4
1.2
b
8
6
b
b
-1
25
15
24
Time (h)
e
Xihan No.2
Longchun 23
20
18
Carotenoid content (mg g-1 FW)
0
a
a
1.0
0.0
R24
CAT activity
Electrolyte leakage (%)
48
30
0
H2O2 content(ng g-1 FW)
a
100
Chlorophyll content (mg g-1 FW)
24
Time (h)
SOD activity (units mg-1 protein)
18
d
0
a
120
Xihan No.2
Longchun 23
1.4
0
0
2
Xihan No.2
Longchun 23
140
0
10
c
b 160
MDA content (µg g-1 FW)
a a
(µmol min mg protein)
100
Proline content (µg g-1 FW)
Relative water content (%)
a
Page 8 of 23
c
c
c
c
c
4
2
0
0
18
24
Time (h)
48
R24
Fig. 2 The drought-induced physiological responses in wheat seedlings. The RWC (a), free proline content (b), MDA content (c), electrolyte
leakage (d), chlorophyll content (e), carotenoid content (f), H2O2 content (g), SOD activity (h) and CAT activity (i) were measured from
control, dehydration treatments (18 h, 24 h and 48 h) and rehydration treatment (R24 h) of Xihan No. 2 and Longchun 23, respectively.
Each value is represented as means ± SE for three independent experiments. Means followed by different small letters are significantly different
at p < 0.05 according to Duncan’s multiple range test
865 ± 32, 832 ± 34, 768 ± 28 and 748 ± 43, respectively
(Fig. 5). In Longchun 23, the total numbers of protein spots
were 872 ± 43, 865 ± 35, 842 ± 26, 738 ± 19 and 761 ± 37,
respectively (Fig. 5). The total number of protein spots on
2-DE gels was gradually declined in both two cultivars during all the stages of drought stress (Fig. 5). Quantitative
image analyses showed a total of 172 protein spots from
Xihan No. 2 and 215 protein spots from Longchun 23 with
their abundance significantly altered (p < 0.05) by more
than at least 2.5-fold under drought stress and rehydration.
One hundred and forty-eight differentially abundant
proteins were identified by MALDI-TOF/TOF MS in
total, including 84 proteins identified in Xihan No. 2 and
64 proteins identified in Longchun 23, respectively. The
primary identification information of these differentially
abundant proteins of two wheat cultivars were presented
in Additional file 3: Table S1, Additional file 4: Table S2
and Additional file 5: Table S3, which were summarised
in Additional file 6: Table S4 and Additional file 7: Table
S5. To generate a board survey of identified proteins
with altered abundance under drought stress, a Venn
diagram was conducted to show the dynamics of the
number of differentially abundant proteins between
Xihan No. 2 and Longchun 23 (Fig. 6). Among these
identified proteins, 6 proteins (acid phosphatase, glyceraldehyde-3-phosphate dehydrogenase, peptidyl-prolyl
cis-trans isomerase, proteasome subunit alpha, voltage
dependent anion channel and S-like RNase) were upregulated and 4 proteins (ribulose-1,5-bisphosphate
carboxylase/oxygenase large subunit, RuBisCO large
subunit-binding protein subunit alpha, elongation factor
Tu and S-adenosylmethionine synthase) were downregulated in both two cultivars under drought stress. 41
and 31 proteins were up-regulated only in Xihan No. 2
Cheng et al. BMC Plant Biology (2016) 16:188
Page 9 of 23
Fig. 3 2-DE gel analysis of proteins extracted from leaves of Xihan No. 2 during dehydration and rehydration. Equal amounts (900 μg) of proteins
were separated on pH 3–10 IPG strips (17 cm, linear) in the first dimension and by SDS-PAGE on 12 % polyacrylamide gels in the second dimension.
The gels were visualized by CBB staining. Three replicate CBB-stained gels for control, dehydration treatments (18 h, 24 h and 48 h) and rehydration
treatment (R24 h) (Additional file 1: Figure S3) were computationally combined using PDQuest v8.0.1 software, respectively. Protein spots indicated
with numbers were identified by MALDI-TOF/TOF MS. The identified spots were numbered in accordance with Additional file 6: Table S4. a 2-DE
protein profile for control; (b-e) 2-DE protein profile for dehydration treatments (18 h, 24 h and 48 h) and rehydration treatment (R24 h), respectively
and Longchun 23, respectively (Fig. 6a). 31 and 15 proteins were down-regulated only in Xihan No. 2 and Longchun 23, respectively (Fig. 6b). Except for the quantitative
changes, some proteins also showed qualitative changes in
both two cultivars. Five proteins (spots 3508, 3806, 4113,
6214 and 6215) were disappeared after 48 h dehydration
treatment, and two proteins (spots 3500 and 6211) absent
in control were induced under drought stress in Longchun
23. In Xihan No. 2, two proteins (spots 9037 and 2701)
were disappeared after 48 h dehydration treatment.
Otherwise, it was noted that the same protein
migrated to different gel spots, and their function was
common to different spots. In Xihan No. 2, 16 proteins were identified in two to four spots, that is,
glyceraldehyde-3-phosphate dehydrogenase (spot 8304
and 8301), putative acid phosphatase (spots 9036 and
9037), putative inactive purple acid phosphatase 27
(spots 5703 and 5705), S-adenosylmethionine synthase
(spot 4501, 4506 and 4706), ribulose1,5-bisphosphate
carboxylase activase isoform 1 (spots 3402 and 2504),
fructose-bisphosphate aldolase (spot 7407, 2309, 3303
and 3306), fructose-bisphosphate aldolase precursor
Cheng et al. BMC Plant Biology (2016) 16:188
Page 10 of 23
Fig. 4 2-DE gel analysis of proteins extracted from leaves of Longchun 23 during dehydration and rehydration. Equal amounts (900 μg) of
proteins were separated on pH 3–10 IPG strips (17 cm, linear) in the first dimension and by SDS-PAGE on 12 % polyacrylamide gels in the second
dimension. The gels were visualized by CBB staining. Three replicate CBB-stained gels for control, dehydration treatments (18 h, 24 h and 48 h)
and rehydration treatment (R24 h) (Additional file 2: Figure S4) were computationally combined using PDQuest v8.0.1 software, respectively. Protein
spots indicated with numbers were identified by MALDI-TOF/TOF MS. The identified spots were numbered in accordance with Additional file 7: Table
S5. a 2-DE protein profile for control; (b-e). 2-DE protein profile for dehydration treatments (18 h, 24 h and 48 h) and rehydration treatment (R24
h), respectively
(spots 3302 and 5505), protochlorophyllide reductase
(spot 8426 and 9406), glutathione transferase (spots 7102,
6105 and 6101), cyclophilin-like protein (spots 8001 and
8003), germin-like protein 1 (spots 5102, 4112 and 3001),
F1-ATPase (spots 9114 and 9115), adenylate kinase A
(spot 8201 and 7215), aspartic proteinase nepenthesin-1
precursor (spots 8518, 9310 and 7311), chloroplast stemloop binding protein of 41 kDa b (spots 8304 and 8308)
and S-like RNase (spots 7219 and 7108) (Additional file 3:
Table S1, Additional file 6: Table S4). In Longchun 23, 7
proteins were identified in two or three spots, that is
ribulose-1,5-bisphosphate carboxylase/oxygenase large
subunit (spot 4708 and 4705), glutamate-1-semialdehyde
2,1-aminomutase (spots 3508 and 3511), thaumatin-like
protein TLP5 (spots 7104 and 6105), 50S ribosomal
protein L10 (spots 3103 and 5102), ATP-dependent Clp
protease proteolytic subunit (spots 3205 and 2206), mitochondrial outer membrane porin (spots 8220 and 8250)
and rab protein (spots 6212, 6215 and 7206) (Additional
file 4: Table S2, Additional file 7: Table S5). The multiple
observation of same protein on 2-DE gels could be due to
post-translational modifications such as glycosylation,
phosphorylation and proteolytic cleavage that can alter
the molecular weight and charge of these proteins.
Totle number of protein spots
Cheng et al. BMC Plant Biology (2016) 16:188
950
Page 11 of 23
Xihan No.2
Longchun 23
900
functional class corresponded proteins involved in metabolism (23 %), protein translation/processing/degradation
(20 %), photosynthesis (16 %), transport (11 %) and defence (8 %).
850
Dynamics of drought-responsive protein networks in two
wheat cultivars
800
To summarize the proteins with similar expression profiles listed in Additional file 6: Table S4 and Additional
file 7: Table S5, the hierarchical clustering was applied to
differentially abundant proteins identified in two wheat
cultivars. The clustering analysis yielded nine and eight
expression clusters in Xihan No. 2 and Longchun 23
(Figs. 8 and 9), respectively. The detailed information on
proteins within each cluster is presented in Additional
file 8: Figure S1 and Additional file 9: Figure S2. The
proteins involved in redox homeostasis, defense, energy
and protein translation/processing/degradation, played
key roles in drought tolerance of Xihan No. 2 (Fig. 8).
These proteins showed an early induction for drought
response and maintained almost steady state henceforth
in Cluster 1 and 6. However, non-homogeneous expression patterns were also observed in proteins with these
functions. Cluster 5 enriched in defense and protein
translation/processing/degradation-related proteins were
firstly up-regulated and followed by a gradual downregulation after 18–24 h drought stress, and then induced again until recovery. The co-clustering pattern
was also found for unknown proteins in Cluster 1 and 5.
Identification of these proteins might provide some valuable insight into kinetics of drought tolerance mechanisms. The most abundant group, Cluster 7 with 24
proteins, were found to be down-regulated during all the
stages of drought stress, showing the maximum coclustering for the proteins involved in photosynthesis
and metabolism. Due to heterogeneous composition, the
miscellaneous category of proteins were represented
in almost all the clusters and showed no clear clustering patterns. In Longchun 23, Cluster 1 was early
750
700
0
18
24
Time (h)
48
R24
Fig. 5 The total number of protein spots detected from the 2-DE gel
of Xihan No. 2 and Longchun 23 during dehydration and rehydration
Functional classification of drought-responsive proteins in
two wheat cultivars
The identified proteins play a variety of functions during
cellular adaptation to drought stress. In Xihan No. 2,
84 differentially abundant proteins were grouped into
ten functional classes (Fig. 7a and Additional file 6:
Table S4). The largest percentage of identified proteins was involved in photosynthesis (22 %), and the
second classes corresponded functions were involved
in defence (14 %) and metabolism (14 %). Protein
translation/processing/degradation and redox homeostasis accounted 13 % and 11 %, respectively. Proteins
were also found to play roles in energy (9 %), miscellaneous (7 %), unknown (6 %), transcription (2 %) and transport (2 %). A wide range of cellular functions were also
covered in Longchun 23, which were grouped into
twelve functional classes (Fig. 7b and Additional file 7:
Table S5). It included metabolism, photosynthesis, protein
translation/processing/degradation, redox homeostasis,
defence, energy, transcription, cellular structure, signalling, transport, miscellaneous and unknown. The major
Fig. 6 Venn diagrams of the number of up- (a) and down-regulated (b) proteins in Xihan No. 2 and Longchun 23 under drought stress. Overlapping
regions of the circles indicate the number of proteins regulated in either the same manner in both two wheat cultivars, whereas non-overlapping
circles indicated proteins regulated in only that cultivar
Cheng et al. BMC Plant Biology (2016) 16:188
Page 12 of 23
Fig. 7 Functional classification of the differentially abundant proteins in Xihan No. 2 (a) and Longchun 23 (b) during dehydration and
rehydration. The protein function classification was conducted according to the putative functions assigned to each of the candidate proteins
using the protein functional database and displayed in the pie chart
drought-responsive and showed down-regulation after
24 h drought stress (Fig. 9), which was enriched in
proteins associated with metabolism, redox homeostasis,
photosynthesis, energy and transport. The proteins involved in protein translation/processing/degradation and
photosynthesis as the major functional classes in Cluster 4
were observed to be down-regulated during all the stages
of drought stress and recovered after rehydration. Cluster
5 involved in metabolism, protein translation/processing/
degradation and transport was early induced and maintains almost steady state henceforth. The other two major
groups were Cluster 6 and 8. The proteins in Cluster 6
were gradually up-regulated and involved in transport
and defence. The metabolism and protein translation/
processing/degradation-related proteins in Cluster 8
were early induced and maintain almost steady state
during 18–48 h drought stress, and then up-regulated
after rehydration. The co-clustering pattern was also
found for unknown proteins in Cluster 8. Proteins involved in photosynthesis and metabolism showed no
clear clustering patterns.
Discussion
Drought is the most important limiting factor for wheat
production, and it is becoming an increasingly severe
problem in northwestern regions of China. In addition
to the complexity of drought itself, the responses of
different wheat genotype to drought are complex. The
different mechanisms are adopted by wheat genotype
with different drought tolerance when they encounter
drought stress. The present research about physiology
and comparative proteomics in two wheat cultivars with
different drought tolerance will help to establish the precise screening techniques to identify traits which are related to drought tolerance in wheat.
Metabolism-related proteins
Drought can often cause significant metabolism alteration in plants so as to produce some important
metabolic intermediates and more energy against
drought stress [21, 53, 54]. Several key enzymes involved in glycolysis pathway were up-regulated under
drought stress, that is, glyceraldehyde-3-phosphate dehydrogenase (spot 8403) in Xihan No. 2, glyceraldehyde3-phosphate dehydrogenase A (spot 6413), triosephosphate isomerase (spot 1207) and enolase 2 (spot 3702) in
Longchun 23. Glyceraldehyde-3-phosphate dehydrogenase
(GAPDH) is responsible for the interconversion of 1,3diphosphoglycerate and glyceraldehyde-3-phosphate, a
central step in glycolysis and gluconeogenesis [55, 56].
The up-regulation of GAPDH in both two wheat cultivars
can promote glucose metabolism to meet the increased
substance and energy requirement for drought resistance
as suggested by Rochat et al. [57]. Triosephosphate isomerase (TPI) catalyzes the reversible interconversion of
dihydroxyacetone phosphate and D-glyceraldehyde 3phosphate, which is essential for efficient energy production in glycolysis [58]. The up-regualtion of TPI
(spot 1207) in Longchun 23 is consistent with the observation in rice and maize under drought stress [59, 60].
Enolase 2 (spot 3702) catalyzes the dehydration of 2phosphoglycerate to phosphoenolpyruvate, which has
been reported in response to salt, drought, cold and anaerobic stress [33, 48, 59, 61]. It suggested that the
Cheng et al. BMC Plant Biology (2016) 16:188
Page 13 of 23
Fig. 8 Clustering analysis of the expression profiles of differentially abundant proteins in Xihan No. 2 during dehydration and rehydration. The
hierarchical cluster tree is shown at the top, and the expression profiles are shown below. The five rows of hierarchical cluster tree represent
control, dehydration treatments (18 h, 24 h and 48 h) and rehydration treatment (R24 h), respectively. Each individual protein is represented by a
single column of colour boxes. The up- and down-regulated proteins are indicated in red and green, respectively. The colours intensity is increased
with the expression differences increasing, as shown in the bar. The expression profile of each individual protein in the cluster is depicted by gray lines,
while the mean expression profile is marked in pink for each cluster. The number of proteins in each cluster is given in the left upper corner, and the
cluster number is given in the right lower corner. Only the clusters with n > 6 were taken to investigate the co-expression patterns for functionally
similar proteins. The detailed information on proteins within each cluster is presented in Additional file 8: Figure S1
strengthened glycolysis pathway can lead to acetyl-CoA
accumulation in Krebs cycle and finally produce a large
amount of ATP for drought resistance. Malate dehydrogenase (spots 6412 and 7405) associated with Krebs cycle
was also up-regulated during the early period of drought
stress in Longchun 23, which might accelerate Krebs cycle
for drought adaption [33, 62]. In addition, two crucial
enzymes in pentose phosphate pathway (PPP), 6-phosphogluconate dehydrogenate (spot 3608) and transketolase (spot 3806), were up-regulated in Longchun 23. It
was most likely that PPP may be another pathway for producing more energy in response to drought [33]. Such a
number of regulated glucose metabolism-related enzymes
in Longchun 23 reflected an increased energy requirement
in drought-sensitive cultivar than tolerant cultivar under
drought stress.
Drought can cause changes in free amino acid levels in
plant cells [21, 33, 63]. There were several amino acid
biosynthesis-related enzymes affected by drought stress
in two wheat cultivars. Glutamine synthetase (GS) is
Cheng et al. BMC Plant Biology (2016) 16:188
Page 14 of 23
Fig. 9 Clustering analysis of the expression profiles of differentially abundant proteins in Longchun 23 during dehydration and rehydration. The
hierarchical cluster tree is shown at the top, and the expression profiles are shown below. The five rows of hierarchical cluster tree represent
control, dehydration treatments (18 h, 24 h and 48 h) and rehydration treatment (R24 h), respectively. Each individual protein is represented by a
single column of colour boxes. The up- and down-regulated proteins are indicated in red and green, respectively. The colours intensity is increased
with the expression differences increasing, as shown in the bar. The expression profile of each individual protein in the cluster is depicted by gray lines,
while the mean expression profile is marked in pink for each cluster. The number of proteins in each cluster is given in the left upper corner, and the
cluster number is given in the right lower corner. Only the clusters with n > 6 were taken to investigate the co-expression patterns for functionally
similar proteins. The detailed information on proteins within each cluster is presented in Additional file 9: Figure S2
responsible for the first step of ammonium assimilation
and transformation into glutamine and proline (an important osmolyte) precursors [64, 65]. The up-regulated
plastid glutamine synthetase isoform GS2c (spot 1408)
in Xihan No. 2 can lead to proline accumulation and
enhance osmotic adjustment ability of cells under drought
stress as suggested by Díaz et al. [66]. It appeared that
proline biosynthesis may be an important amino acid metabolism strategy against drought in drought-tolerant cultivar. S-adenosylmethionine synthase (SAMS) catalyzes a
Cheng et al. BMC Plant Biology (2016) 16:188
conjugation of methionine and ATP to generate SAM
[67, 68]. Previous study has reported that SAMS plays
a role in betaine (an organic osmolyte) biosynthesis
induced by drought [69] and promotes lignin accumulation for the rearrangement and reinforcement of
cell wall [70, 71]. The up-regulated SAMS 2 (spot 4603) in
Longchun 23 during the early period of drought stress
may contribute to the early protection mechanism against
drought through osmolyte accumulation or an accelerated
formation of vascular tissue and aerenchyma.
There were also other metabolism-related enzymes
providing additional information for wheat in response
to drought stress. Previous studies have found that acid
phosphatase (ACP) activity was increased under low
phosphorus stress [72–74]. The up-regulation of acid
phosphatase 1 (spot 8210) in Longchun 23 and putative
acid phosphatase (spots 9036 and 9037) in Xihan No. 2
during the early period of drought stress indicated that
phosphate metabolism may be a positive droughtresponse by promoting phosphate absorption, transport
and utilization in wheat. Aldehyde dehydrogenases
(ALDHs) belong to a family of NAD(P)+-dependent enzymes that catalyze the oxidation of various toxic aldehydes to carboxylic acids [75, 76]. The up-regulation of
ALDH family 2 member B7 (spot 4703) in Longchun 23
during the early period of drought stress can decrease
the toxicity of aldehyde supported from the report of
Sunkar et al. [77]. Formate dehydrogenase (FDH) is a
mitochondrial and NAD-dependent enzyme that catalyzes the oxidation of formate to carbon dioxide in
plants [78, 79]. Previous study has demonstrated that
FDH activity was highest in intact sprouting potato tubers under hypoxia stress [80]. The up-regulated FDH
(spot 7401) in Xihan No. 2 during the middle period of
drought stress reflected its important role in anaerobic
metabolism of drought-tolerant cultivar.
Photosynthesis-related proteins
Oxygen-evolving enhancer proteins (OEE) as an auxiliary component of photosystem II (PS II) manganese
cluster can control O2 evolution and maintain the stability of PS II [81, 82]. The gradually down-regulated OEE
1–2 (spot 1208) in Xihan No. 2 and the rapidly downregulated OEE 2 (spot 4113) in Longchun 23 under
drought stress suggested that drought-tolerant cultivar
have more stability of oxygen-evolving activity of PS II.
Rubisco is a key rate-limiting enzyme responsible for
photosynthetic carbon assimilation [83, 84]. There
were several down-regulated Rubisco proteins found in
two wheat cultivars, including Ribulose-1,5-bisphosphate
carboxylase/ oxygenase (RuBisCO) large subunit (spot
6713), Ribulose1,5-bisphosphate carboxylase activase isoform 1 (spots 3402 and 2504), RuBisCO large subunitbinding protein subunit alpha (spot 1604) and subunit
Page 15 of 23
beta (spot 2908) in Xihan No. 2 and RuBisCO large subunit (spot 4708), RuBisCO large subunit-binding protein
subunit alpha (spot 1703), RuBisCO large subunit (spot
4705) and rbcL (spot 6214) in Longchun 23. It might be
one of main non-stomatal factors for the decreased
photosynthetic rate in two wheat cultivars under drought
stress as suggested by Galmés et al. [85]. Fructose-1, 6bisphosphate aldolase (FBA) reversibly catalyzes the conversion of fructose-1,6-bisphosphate (FBP) to glyceraldehyde 3-phosphate (GAP) and dihydroxy acetone 3phosphate [86, 87]. Under stress condition, both GAP and
FBP may be converted to glucose 6-phosphate for re-entry
into the PPP for NADPH synthesis [63]. The downregulation of FBA (spots 7407, 2309, 3303, 3306, 3302 and
5505) in Xihan No. 2 can enhance NADPH synthesis for
energy and maintenance of Calvin cycle. Otherwise, some
photosynthetic pigment biosynthesis-regulated enzymes
were also identified in two wheat cultivars. Protochlorophyllide reductase (spots 8426 and 9406), catalyzing
phototransformation of protochlorophyllide to chlorophyllide in chlorophyll biosynthesis [88, 89], was up regulated in Xihan No. 2. Glutamate-1-semialdehyde 2,1aminomutase (spots 3508 and 3511) participating in porphyrin and chlorophyll metabolism [90] and magnesiumprotoporphyrin O-methyltransferase (spot 7306) involved
in light-independent chlorophyll biosynthesis [91] were
up-regulated in Longchun 23. It suggested that the enhanced photosynthetic pigment synthesis might be a common mechanism in response to drought stress in both
drought-tolerant and sensitive cultivars.
Redox homeostasis-related proteins
Plants have developed some antioxidative systems including various antioxidants and antioxidase to protect
against oxidative damage caused by reactive oxygen species (ROS) under drought stress [20, 41, 92]. Several
antioxidases were found to be up-regulated in Xihan No.
2 under drought stress, including glutathione transferase
(spots 7102, 6105 and 6101), glutathione peroxidase-like
protein GPX54Hv (spot 7005), peroxidase (spots 9314
and 8213), probable L-ascorbate peroxidase 6 (spot
6208) and manganese superoxide dismutase (Mn-SOD,
spot 7105). Glutathione transferases (GSTs) as important
detoxification enzymes catalyze the conjugation of xenobiotics or their metabolites to glutathione (GSH)
[93, 94]. Glutathione peroxidases (GPXs) catalyze the
reduction of H2O2, organic hydroperoxides and lipid
peroxides using GSH and/or other reducing equivalents
[95]. The up-regulation of GSTs (spots 7102, 6105 and
6101) and GPX-like protein GPX54Hv (spot 7005) in
Xihan No. 2 may protect cell membrane from oxidative
damage and maintain cellular redox homeostasis [96, 97].
The up-regulated probable L-ascorbate peroxidase 6 (spot
6208) in Xihan No. 2 can detoxify H2O2 to H2O and
Cheng et al. BMC Plant Biology (2016) 16:188
promote the fine-tuning of ascorbate-glutathione cycle
[98, 99]. Mn-SOD (spot 7105) is the principal scavenger
for superoxide in mitochondria, thus its up-regulation in
Xihan No. 2 may provide the dismutation role of superoxide radical to hydrogen peroxide and oxygen in
mitochondrial [100, 101]. It appeared that the multicomponents antioxidant systems may take part in
ROS scavenging and maintain a higher drought tolerance in Xihan No. 2. However, only one up-regulated
ascorbate peroxidase (spot 5201) and one downregulated gamma-glutamylcysteine synthetase (γ-GCS,
spot 2602) catalyzing production of the cellular antioxidant GSH [102, 103] were identified in Longchun 23.
The down-regulation of γ-GCS might inhibit GSH synthesis and lead to a higher oxidative state in Longchun 23
under drought stress.
Defense-related proteins
Twelve defense-related proteins were identified in Xihan
No. 2, including glucan endo-1,3-beta-glucosidase (spot
9319), cyclophilin-like protein (spots 8001 and 8003),
NAD(P)-binding Rossmann-fold-containing protein (spot
5210), CBS domain containing protein (spot 8009),
alpha-1,4-glucan-protein synthase (spot 5406), germinlike protein 1 (spots 5102, 4112 and 3001), xylanase
inhibitor TAXI-IV (spot 9402), stress responsive protein (spot 7306) and USP family protein (spot 5002).
Except for alpha-1,4-glucan-protein synthase and germinlike protein 1, all the other proteins were up-regulated at
least one time stage under drought stress. Glucan
endo-1,3-beta-glucosidase (spot 9319) can degrade the
fungal cell wall polysaccharides [104, 105], and its upregulation in Xihan No. 2 may protect against fungal
pathogen infection under drought stress. Cyclophilinlike protein (spots 8001 and 8003) belongs to a large
family of enzyme with peptidyl prolyl isomerase activity, which might participate in stress response and
pathogen immunity in Xihan No. 2 as suggested by
Chen et al. [106] and Gan et al. [107]. Xylanase inhibitor TAXI-IV (spot 9402) can suppress microbial
xylanases and participate in defense against fungal
and bacteria pathogens [108, 109]. CBS domain containing protein (spot 8009) is connected by 2 or 4
cystathionine β-synthase (CBS) domains [110]. Overexpression of this protein can improve salinity, oxidative and heavy metal tolerance in transgenic tobacco
[111], speculating its important role in stress response. NAD(P)-binding Rossmann-fold-containing protein (spot 5210) can produce coenzyme NAD(P)+ that is
an important proton transfer and energy receptor in respiration, and its up-regulation in Xihan No. 2 may accelerate anaerobic respiration and reduce toxic substances
accumulation under drought stress. In addition, the upregulation of stress responsive protein (spot 7306) and
Page 16 of 23
USP family protein (spot 5002) also showed the potential
to improve resistance against drought in Xihan No. 2.
However, only a few defense-related proteins were identified in Longchun 23, such as putative plastid-lipidassociated protein 3 (spot 0403) involved in drought-related jasmonate biosynthesis [112], thaumatin-like
protein TLP5 (spots 7104 and 6105) and class II
chitinase-like protein (spot 3301) associated with
pathogen resistance [113, 114]. All the results indicated that more defense mechanisms were induced in
the drought-tolerant cultivar than in the sensitive cultivar under drought stress, which can contribute to
stronger drought resistance.
Energy-related proteins
F-ATPase is a key enzyme of energy metabolism that
uses the transmembrane electrochemical proton gradient generated by oxidative phosphorylation or photosynthesis to drive ATP synthesis [115, 116]. The upregulation of F1-ATPase (spots 9114 and 9115) and
ATP synthase precursor (spot 3108) in Xihan No. 2
might enhance ATP synthesis and provide more energy for drought resistance. The similar behaviours of
these proteins were also described in wheat, rice,
Boea hydrometrica and Arabidopsis thaliana under
various abiotic stresses [92, 117–119]. The up-regulated
adenylate kinase A (spots 8201 and 7215) in Xihan No. 2
could contribute to regulate multiple cellular energydependent and nucleotide signaling processes under
drought stress through catalyzing phosphotransfer as
suggested by Dzeja and Terzic [120]. However, only
one energy-related protein, F0-F1 ATPase alpha subunit (spot 3707), were identified in Longchun 23,
which was up-regulated during the early period of
drought stress and then down-regulated. It suggested
that comparing to a transient enhancement of ATP
synthesis during the early period of drought stress in
sensitive cultivar, drought-tolerant cultivar can enhance
energy metabolism for drought resistance through a continuous ATP synthesis.
Protein translation, processing and degradation-related
proteins
Many identified proteins in two wheat cultivars were
attributed to protein metabolism, which were divided
into three functional groups. The first group was
functioned in protein biosynthesis. Translation elongation factor is a core translational protein that catalyzes the initiation and elongation of newly growing
peptide chains [121, 122]. Several GTP-driven elongation factors, chloroplast translational elongation factor Tu (spot 2502) in Xihan No. 2 and elongation
factor G (spot 1810) and elongation factor Tu (spot
2610) in Longchun 23, were down-regulated, reflecting
Cheng et al. BMC Plant Biology (2016) 16:188
that the GTP-dependent ribosomal translocation elongation of protein biosynthesis might be inhibited by
drought stress [123, 124]. The similar behaviours of
these proteins were also described in soybean genotypes with different salt tolerance [125]. Ribosomal
protein is one kind of highly conserved proteins that
make up ribosomal subunits involved in the cellular
process of translation [126]. The up-regulation of 30S
ribosomal protein S5 (spot 1409) in Xihan No. 2 and
50S ribosomal protein L10 (spots 3103 and 5102) in
Longchun 23 can promote mRNA/ribosome interactions early in translation [127]. The second group
participated in protein degradation. Proteolysis is necessary for the removal of abnormal, modified and
mistargeted proteins and for altering the balance of
proteins [21]. Proteasome subunit alpha type-2 (spot
3218), 20S proteasome beta 7 subunit (spot 8102),
aspartic proteinase nepenthesin-1 precursor (spots
8518, 9310 and 7311), triticain alpha (spot 0209) in
Xihan No. 2, and proteasome subunit alpha type-7-A
(spot 8304), proteasome subunit alpha type-1 (spot
1307) and ATP-dependent Clp protease proteolytic
subunit (spots 3205 and 2206) in Longchun 23, were
up-regulated under drought stress. It was postulated
that proteases and proteasomes play key roles in
maintaining strict protein quality control and degrading specific sets of proteins in response to drought
stress in both drought-tolerant and sensitive cultivars
[21, 128, 129]. The third group was engaged in protein refolding and assembly. Heat shock proteins
(HSPs) act as molecular chaperones that protect
plants against various stresses by re-establishing normal protein conformation and cellular homeostasis
[130–132]. Two HSP70s, 70 kDa heat shock protein
(spot 1701) and chloroplast envelope membrane 70 kDa
heat shock-related protein (spot 2701), were downregulated in Xihan No. 2. It was proposed that the transport of newly synthesized peptides was decreased in
Xihan No. 2, partially due to the decreased protein
synthesis under stress conditions as suggested by
Jiang et al. [133] and Cheng et al. [134]. Chaperone
protein dnaJ 10 (spot 6505) as an Hsp40 chaperone
was up-regulated in Longchun 23 during the middle
period of drought stress, which can help transfer substrate proteins to Hsp70s and regulate their ATPase
activity [135]. The down-regulated chaperone protein
ClpC1 (spot 3801) in Longchun 23 can reduce the
degradation ability of denatured chloroplast proteins.
Peptidyl-prolyl cis-trans isomerases, a superfamily of
ubiquitous folding catalysts, catalyzes the interconversion of peptidyl-prolyl imide bonds in peptide and
protein substrates [136, 137]. The up-regulated peptidylprolyl cis-trans isomerase FKBP20-2 (spot 1116) in
Xihan No. 2 and down-regulated peptidyl-prolyl cis-trans
Page 17 of 23
isomerase (spot 0510) in Longchun 23 reflected its critical
role in accelerating protein folding of drought-tolerant
cultivar. Overall, the expression patterns of these proteins
in three groups indicated that protein biosynthesis
might be inhibited by drought stress in both droughttolerant and sensitive cultivars, whereas the higher
degradation ability of denatured proteins as well as
the enhanced protein folding may be appeared in tolerant cultivar for drought resistance.
Transport, cellular structure and signaling-related
proteins
Some transport-related proteins were identified to be
up-regulated in Xihan No. 2 and Longchun 23, indicating that there exists active transport of ions and metabolites for drought adaptation in both drought-tolerant and
sensitive wheat cultivars. Voltage dependent anion channel (VDAC, or mitochondrial outer membrane porin)
regulates metabolic and energetic flux across the outer
mitochondrial membrane [138, 139]. The up-regulation
of VDAC (spot 9303 and 9305) and mitochondrial outer
membrane porin (spot 8220 and 8250) could enhance
the exchange of ions and molecules between mitochondria and cytosol for maintaining intracellular homeostasis under drought stress. YLP (spot 7325) belonged to
the component of vacuolar H+-ATPase subunit E in
Xihan No. 2 and vacuolar proton-ATPase subunit A
(spot 2816) in Longchun 23 were also up-regulated,
which may maintain an electrochemical proton gradient
across the tonoplast to drive transmembrane transport
of ions and metabolites for drought adaptation as suggested by Wang et al. [140]. The up-regulated rab protein (spot 6212, 6215 and 7206) in Longchun 23 may
function as regulators in membrane-trafficking pathways
[141]. In addition, there were two proteins associated
with cellular structure and signaling functions identified
in Longchun 23. Actin can form microfilaments that are
essential elements of cytoskeleton [142, 143]. The upregulated actin (spot 2506) in Longchun 23 might be required to adjust cellular behavior in response to drought
stress. Calreticulin (CRT) as an abundant Ca2+-binding
protein maintains the intracellular Ca2+ homeostasis and
Ca2+ signaling pathway [144], which plays a positive role
in stress response of plants such as cold, drought and
disease [145–147]. The down-regulated CRT (spot 0602)
in Longchun 23 appeared that Ca2+ signaling transduction was weakened and thus cannot start some key
defense reaction in drought-sensitive cultivar.
Miscellaneous and unknown proteins
In addition to the major protein classes, other important
proteins were also identified. UDP-glucuronate decarboxylase 1 (spot 8406) involved in cell wall biosynthesis
of plants [148] was up-regulated and then gradually
Cheng et al. BMC Plant Biology (2016) 16:188
down-regulated in Xihan No. 2, reflecting that the cell
wall components of drought-tolerant cultivar were impacted by drought. The up-regulated ankyrin-repeat protein HBP1 (spot 1623) in Xihan No. 2 might be a
positive response to drought signaling by mediating
protein-protein interactions [149]. The rapidly downregulated victorin binding protein (spot 6808) in Xihan
No. 2 seems to reduce the intracellular toxin [150]. Slike RNases have been reported to be induced by inorganic phosphate-starvation or in response to pathogen
infection and mechanical wounding [151, 152]. The upregulated S-like RNases (spot 7219, 7108 and 6213) in
both two wheat cultivars might act as a positive regulator in drought response as suggested by Zheng et al.
[153]. Two key enzymes in ubiquitination-proteasomal
pathway, ubiquitin-conjugating enzyme 26 (spot 1001)
in Xihan No. 2 and NEDD8-conjugating enzyme Ubc12
(spot 8106) in Longchun 23, were up-regulated, implicating that the ubiquitin-dependent protein degradation
plays an important role in drought tolerance of wheat as
suggested by Zhou et al. [154]. The up-regulated
Page 18 of 23
flavoprotein wrbA-like isoform 1 (spot 5105) in Longchun
23 could prevent interaction of the semiquinone with
O2 and production of superoxide under drought
stress [155]. Otherwise, there were some unknown
proteins identified, which are subject to further studies for clarifying their contributions in response to
drought stress in wheat.
Conclusions
Our integrated analysis of physiology and proteome
data provides useful information about the droughtresponse mechanism of two wheat cultivars with different drought tolerance (Xihan No. 2, a droughttolerant cultivar and Longchun 23, a drought-sensitive
cultivar). Quantitative image analysis of 2-DE gels
showed significant variations of 172 protein spots
from Xihan No. 2 and 215 protein spots from Longchun 23. Out of these spots, a total of 84 and 64 differentially abundant proteins were identified by
MALDI-TOF/TOF MS in Xihan No. 2 and Longchun
23, respectively. Most of these identified proteins
Fig. 10 The representative models for summarizing the functional and regulatory networks activated by drought stress in Xihan No. 2. The
identified proteins are displayed on the corresponding metabolic pathways. The colour boxes are representative of expression profiles of
individual protein during dehydration and rehydration. The up- and down-regulation of proteins are indicated in red and green, respectively. The
colours intensity is increased with the expression differences increasing. The number given on the left side of each colour boxes indicates the
protein identification number in accordance with Additional file 6: Table S4
Cheng et al. BMC Plant Biology (2016) 16:188
were involved in metabolism, photosynthesis, defence
and protein translation/processing/degradation in two
wheat cultivars. In addition, the proteins involved in
redox homeostasis, energy, transcription, cellular
structure, signalling and transport were also identified.
Hierarchical clustering results revealed that these proteins were involved in a dynamic network in response
to drought stress. The representative models for summarizing the functional and regulatory networks activated by drought stress in Xihan No. 2 and Longchun
23 were illustrated in Figs. 10 and 11, respectively.
Wheat leaf cells can perceive drought signalling through
putative sensors and transmit them to regulate transcription, protein synthesis and processing, thereby affecting
the levels of functional proteins involved in metabolism,
photosynthesis, redox homeostasis, defence, energy
and so on. These cellular processes work more cooperatively to re-establish homeostasis in droughttolerant cultivar than sensitive cultivar. More glucose
metabolism-related enzymes regulated in sensitive cultivar suggested more energy requirement in sensitive
Page 19 of 23
cultivar under drought stress. The up-regulation of
proline biosynthesis-related enzyme can enhance the
osmotic adjustment ability of cells in drought-tolerant
cultivar. The down-regulation of Rubisco is one of
main non-stomatal factors for the decreased photosynthetic rate in both two wheat cultivars, whereas
the relative stability of PS II might be an effective
method of drought-tolerant cultivar in response to
drought stress. The up-regulation of ATP synthesisrelated enzymes can enhance energy metabolism in
drought-tolerant cultivar for protective and repair reactions. The higher degradation ability of denatured
proteins as well as the enhanced protein folding may
be associated with stronger drought resistance in tolerant cultivar. More defense mechanisms induced in
the tolerant cultivar than in the sensitive cultivar can
also contribute to stronger drought resistance. Future
work should integrate transcriptomics, proteomics, and
metabolomics approaches to gain a comprehensive knowledge of the sophisticated molecular networks of response
and acclimation to drought stress in wheat.
Fig. 11 The representative models for summarizing the functional and regulatory networks activated by drought stress in Longchun 23. The
identified proteins are displayed on the corresponding metabolic pathways. The colour boxes are representative of expression profiles of
individual protein during dehydration and rehydration. The up- and down-regulation of proteins are indicated in red and green, respectively. The
colours intensity is increased with the expression differences increasing. The number given on the left side of each colour boxes indicates the
protein identification number in accordance with Additional file 7: Table S5
Cheng et al. BMC Plant Biology (2016) 16:188
Additional files
Additional file 1: Figure S3. The primary 2-DE gel maps at least three
biological replicates for control, dehydration treatments (18 h, 24 h and
48 h) and rehydration treatment (R24 h) in Xihan No. 2. (TIF 1852 kb)
Additional file 2: Figure S4. The primary 2-DE gel maps at least three
biological replicates for control, dehydration treatments (18 h, 24 h and
48 h) and rehydration treatment (R24 h) in Longchun 23. (TIF 1707 kb)
Additional file 3: Table S1. The primary identification information of
differentially abundant proteins associated with drought stress response
in Xihan No. 2 by MALDI-TOF/TOF MS. (XLSX 77 kb)
Additional file 4: Table S2. The primary identification information of
differentially abundant proteins associated with drought stress response
in Longchun 23 by MALDI-TOF/TOF MS. (XLSX 74 kb)
Additional file 5: Table S3. Information of single-peptide-based protein
identifications in Xihan No. 2 and Longchun 23. (XLSX 566 kb)
Additional file 6: Table S4. Identification of differentially abundant
proteins associated with drought stress response in Xihan No. 2. Protein
identifications were performed by searching for the Viridiplantae index of
the NCBInr database using peptide mass fingerprinting (PMF) and MS/MS
data from a MALDI-TOF/TOF mass spectrometry analysis. The spot number
as given on the 2-DE gel image (shown in Fig. 3), the identified protein
name, the source organism, the gene identification number as in GenBank,
the number of matched peptides, the statistical score from the database,
the sequence coverage (%), the theoretical Mass (kDa)/ pI values retrieved
from protein database and the means for relative protein abundance ±
standard error (SE) were listed. Spots with a significant differential expression
are described as the spot volumes that were significantly different (p < 0.05,
at least 2.5-fold) in relative abundance. (DOC 485 kb)
Additional file 7: Table S5. Identification of differentially abundant
proteins associated with drought stress response in Longchun 23. Protein
identifications were performed by searching for the Viridiplantae index of
the NCBInr database using peptide mass fingerprinting (PMF) and MS/MS
data from a MALDI-TOF/TOF mass spectrometry analysis. The spot
number as given on the 2-DE gel image (shown in Fig. 4), the identified
protein name, the source organism, the gene identification number as
in GenBank, the number of matched peptides, the statistical score from
the database, the sequence coverage (%), the theoretical Mass (kDa)/pI
values retrieved from protein database and the means for relative
protein abundance ± standard error (SE) were listed. Spots with a significant
differential expression are described as the spot volumes that were
significantly different (p < 0.05, at least 2.5-fold) in relative abundance.
(DOC 372 kb)
Additional file 8: Figure S1. The detailed information on differentially
abundant proteins within each cluster in the clustering analysis of Xihan
No. 2. The five columns of hierarchical cluster tree represent control,
dehydration treatments (18 h, 24 h and 48 h) and rehydration treatment
(R24 h), respectively. Each rows represent individual proteins. The up- and
down-regulation of proteins are indicated in red and green, respectively.
The intensity of colours is increased when the expression differences
increased, as shown in the bar at the top. The differentially abundant
proteins were grouped into 9 clusters in Xihan No. 2. The detailed
information on these proteins within each cluster is presented, including
the protein identification number, protein name and source organism.
(TIF 13294 kb)
Additional file 9: Figure S2. The detailed information on differentially
abundant proteins within each cluster in the clustering analysis of
Longchun 23. The five columns of hierarchical cluster tree represent
control, dehydration treatments (18 h, 24 h and 48 h) and rehydration
treatment (R24 h), respectively. Each rows represent individual proteins.
The up- and down-regulation of proteins are indicated in red and green,
respectively. The intensity of colours is increased when the expression
differences increased, as shown in the bar at the top. The differentially
abundant proteins were grouped into 8 clusters in Longchun 23. The
detailed information on these proteins within each cluster is presented,
including the protein identification number, protein name and source
organism. (TIF 10684 kb)
Page 20 of 23
Acknowledgments
This work was supported by program for Natural Science Foundation
(31171477,31471433, 31060063, 31260094), Innovative Basic Research Groups
of Gansu Province (1308RJIA005), International S&T Cooperation Program of
China (2014DFG31570), Gansu Provincial Key Laboratory of Aridland Crop
Science (GSCS-02), Gansu High Educational Scientific Special Project,
Agricultural Biotechnology Research and Application Development Project of
Gansu Province (GNSW-2008-07), Sheng Tongsheng Science Technology and
Innovation Foundation of Gansu Agricultural University (GSAU-STS-1223).
Availability of data and materials
The data sets supporting the results of this article are included within the
article and its additional files.
Authors’ contributions
Feng Zhang designed the study. Lixiang Cheng, Yuping Wang and Qiang He
performed the experiments. Lixiang Cheng, Yuping Wang, Huijun Li and
Xiaojing Zhang analyzed the data. Lixiang Cheng wrote the manuscript. All
authors read and approved the final manuscript.
Competing interests
The authors declare that they have no competing interests.
Consent for publication
Not applicable.
Ethics approval and consent to participate
Not applicable
Author details
1
College of Agronomy, Gansu Provincial Key Laboratory of Aridland Crop
Science, Gansu Key Laboratory of Crop Improvement & Germplasm
Enhancement, Research & Testing Center, Gansu Agricultural University,
Lanzhou, China. 2Wuwei Agricultural and Animal Husbandry Bureau, Wuwei,
China. 3Gansu Dingxi Academy of Agricultural Science, Dingxi, China.
Received: 3 February 2016 Accepted: 10 August 2016
References
1. Wang W, Vinocur B, Altman A. Plant responses to drought, salinity and
extreme temperatures: towards genetic engineering for stress tolerance.
Planta. 2003;218:1–14.
2. Tardif G, Kane NA, Adam H, Labrie L, Major G, Gulick P, Sarhan F, Laliberté JF.
Interaction network of proteins associated with abiotic stress response and
development in wheat. Plant Mol Biol. 2007;63:703–18.
3. The International Wheat Genome Sequencing Consortium (IWGSC). A
chromosome-based draft sequence of the hexaploid bread wheat
(Triticum aestivum) genome. Science. 2014. doi:10.1126/science.1251788.
4. Wilkinson S, Davies WJ. Drought, ozone, ABA and ethylene: new insights
from cell to plant to community. Plant Cell Environ. 2010;33:510–25.
5. Lee SC, Luan S. ABA signal transduction at the crossroad of biotic and
abiotic stress responses. Plant Cell Environ. 2012;35:53–60.
6. Hossain Z, Nouri MZ, Komatsu S. Plant cell organelle proteomics in response
to abiotic stress. J Proteome Res. 2012;11:37–48.
7. Chaves MM, Maroco JP, Pereira JS. Understanding plant responses to
drought from genes to the whole plant. Funct Plant Biol. 2003;30:239–74.
8. Mahajan S, Tuteja N. Cold, salinity and drought stresses: an overview. Arch
Biochem Biophys. 2005;444:139–58.
9. Bhushan D, Pandey A, Choudhary MK, Datta A, Chakraborty S, Chakraborty N.
Comparative proteomics analysis of differentially expressed proteins in
chickpea extracellular matrix during dehydration stress. Mol Cell Proteomics.
2007;6:1868–84.
10. Reddy AR, Chaitanya KV, Vivekanandan M. Drought-induced responses of
photosynthesis and antioxidant metabolism in higher plants. J Plant Physiol.
2004;161:1189–202.
11. Zang X, Komatsu S. A proteomic approach for identifying osmotic-stressrelated proteins in rice. Phytochemistry. 2007;68:426–37.
Cheng et al. BMC Plant Biology (2016) 16:188
12. Cui SX, Hu J, Yang B, Shi L, Huang F, Tsai SN, et al. Proteomic characterization
of Phragmites communis in ecotypes of swamp and desert dune. Proteomics.
2009;9:3950–67.
13. Ramanjulu S, Bartels D. Drought- and desiccation-induced modulation of
gene expression in plants. Plant Cell Environ. 2002;25:141–51.
14. Bartels D, Sunkar R. Drought and salt tolerance in plants. Crit Rev Plant Sci.
2005;24:23–58.
15. Sakuma Y, Maruyama K, Osakabe Y, Qin F, Seki M, Shinozaki K, et al.
Functional analysis of an Arabidopsis transcription factor, DREB2A, involved
in drought-responsive gene expression. Plant Cell. 2006;18:1292–309.
16. Nakashima K, Ito Y, Yamaguchi-Shinozaki K. Transcriptional regulatory
networks in response to abiotic stresses in Arabidopsis and grasses. Plant
Physiol. 2009;149:88–95.
17. Morran S, Eini O, Pyvovarenko T, Parent B, Singh R, Ismagul A, et al.
Improvement of stress tolerance of wheat and barley by modulation of
expression of DREB/CBF factors. Plant Biotechnol J. 2011;9:230–49.
18. Xue GP, Way HM, Richardson T, Drenth J, Joyce PA, McIntyre CL.
Overexpression of TaNAC69 leads to enhanced transcript levels of stress
up-regulated genes and dehydration tolerance in bread wheat. Mol
Plant. 2011;4:697–712.
19. Rahaie M, Xue GP, Naghavi MR, Alizadeh H, Schenk PM. A MYB gene from
wheat (Triticum aestivum L.) is up-regulated during salt and drought
stresses and differentially regulated between salt-tolerant and sensitive
genotypes. Plant Cell Rep. 2010;29:835–44.
20. Pandey A, Chakraborty S, Datta A, Chakraborty N. Proteomics approach to
identify dehydration responsive nuclear proteins from chickpea (Cicer
arietinum L.). Mol Cell Proteomics. 2008;7:88–107.
21. Choudhary MK, Basu D, Datta A, Chakraborty N, Chakraborty S. Dehydrationresponsive nuclear proteome of rice (Oryza sativa L.) illustrates protein
network, novel regulators of cellular adaptation, and evolutionary
perspective. Mol Cell Proteomics. 2009;8:1579–98.
22. Timperio AM, Egidi G, Zolla L. Proteomics applied on plant abiotic stresses:
Role of heat shock proteins (HSP). J Proteomics. 2008;71:391–411.
23. Rorat T. Plant dehydrins - tissue location, structure and function. Cell Mol
Biol Lett. 2006;11:536–56.
24. Lopez CG, Banowetz GM, Peterson CJ, Kronstad WE. Dehydrin expression
and drought tolerance in seven wheat cultivars. Crop Sci. 2003;43:577–82.
25. Rampino P, Pataleo S, Gerardi C, Mita G, Perrotta C. Drought stress response
in wheat: physiological and molecular analysis of resistant and sensitive
genotypes. Plant Cell Environ. 2006;29:2143–52.
26. Muñoz-Mayor A, Pineda B, Garcia-Abellán JO, Antón T, Garcia-Sogo B,
Sanchez-Bel P, et al. Overexpression of dehydrin tas14 gene improves the
osmotic stress imposed by drought and salinity in tomato. J Plant Physiol.
2012;169:459–68.
27. Imamura T, Higuchi A, Takahashi H. Dehydrins are highly expressed in
overwintering buds and enhance drought and freezing tolerance in
Gentiana triflora. Plant Sci. 2013;213:55–66.
28. Vaseva II, Anders I, Feller U. Identification and expression of different
dehydrin subclasses involved in the drought response of Trifolium repens.
J Plant Physiol. 2014;171:213–24.
29. Mohammadi M, Kav NN, Deyholos MK. Transcript expression profile of
water-limited roots of hexaploid wheat (Triticum aestivum ‘Opata’). Genome.
2008;51:357–67.
30. Aprile A, Mastrangelo AM, De Leonardis AM, Galiba G, Roncaglia E, Ferrari F,
et al. Transcriptional profiling in response to terminal drought stress reveals
differential responses along the wheat genome. BMC Genomics. 2009;10:279.
31. Ergen NZ, Budak H. Sequencing over 13000 expressed sequence tags from
six subtractive cDNA libraries of wild and modern wheats following slow
drought stress. Plant Cell Environ. 2009;32:220–36.
32. Wang J, Ding B, Guo Y, Li M, Chen S, Huang G, et al. Overexpression of a
wheat phospholipase D gene, TaPLDα, enhances tolerance to drought and
osmotic stress in Arabidopsis thaliana. Planta. 2014;240:103–15.
33. Manaa A, Ben Ahmed H, Valot B, Bouchet JP, Aschi-Smiti S, Causse M, et al.
Salt and genotype impact on plant physiology and root proteome
variations in tomato. J Exp Bot. 2011;62:2797–813.
34. Mohammadi M, Kav NN, Deyholos MK. Transcriptional profiling of hexaploid
wheat (Triticum aestivum L.) roots identifies novel, dehydration-responsive
genes. Plant Cell Environ. 2007;30:630–45.
35. Ergen NZ, Thimmapuram J, Bohnert HJ, Budak H. Transcriptome pathways
unique to dehydration tolerant relatives of modern wheat. Funct Integr
Genomics. 2009;9:377–96.
Page 21 of 23
36. Sečenji M, Lendvai Á, Miskolczi P, Kocsy G, Gallé Á, Szucs A, et al.
Differences in root functions during long-term drought adaptation:
comparison of active gene sets of two wheat genotypes. Plant Biol
(Stuttg). 2010;12:871–82.
37. Aprile A, Havlickova L, Panna R, Marè C, Borrelli GM, Marone D, et al. Different
stress responsive strategies to drought and heat in two durum wheat cultivars
with contrasting water use efficiency. BMC Genomics. 2013;14:821.
38. Fleury D, Jefferies S, Kuchel H, Langridge P. Genetic and genomic tools to
improve drought tolerance in wheat. J Exp Bot. 2010;61:3211–22.
39. Pradet-Balade B, Boulme F, Beug H, Muliner EW, Garcia-Sanz JA. Translation
control: bridging the gap between genomics and proteomics? Trends
Biochem Sci. 2001;26:225–9.
40. Agrawal L, Chakraborty S, Jaiswal DK, Gupta S, Datta A, Chakraborty N.
Comparative proteomics of tuber induction, development and maturation
reveal the complexity of tuberization process in potato (Solanum tuberosum L.).
J Proteome Res. 2008;7:3803–17.
41. Ford KL, Cassin A, Bacic A. Quantitative proteomic analysis of wheat
cultivars with differing drought stress tolerance. Front Plant Sci. 2011;2:1–11.
42. Bazargani MM, Sarhadi E, Bushehri AA, Matros A, Mock HP, Naghavi MR,
et al. A proteomics view on the role of drought-induced senescence and
oxidative stress defense in enhanced stem reserves remobilization in wheat.
J Proteomics. 2011;74:1959–73.
43. Ge P, Ma C, Wang S, Gao L, Li X, Guo G, et al. Comparative proteomic
analysis of grain development in two spring wheat varieties under drought
stress. Anal Bioanal Chem. 2012;402:1297–313.
44. Hao P, Zhu J, Gu A, Lv D, Ge P, Chen G, et al. An integrative proteome analysis
of different seedling organs in tolerant and sensitive wheat cultivars under
drought stress and recovery. Proteomics. 2014. doi:10.1002/pmic.201400179.
45. Faghani E, Gharechahi J, Komatsu S, Mirzaei M, Khavarinejad RA, Najafi F,
et al. Comparative physiology and proteomic analysis of two wheat
genotypes contrasting in drought tolerance. J Proteomics. 2015;114:1–15.
46. Bates LS, Waldren RP, Teare ID. Rapid determination of free proline for
water stress studies. Plant Soil. 1973;39:205–7.
47. Hodges DM, DeLong JM, Forney CF, Prange RK. Improving the thiobarbituric
acid-reactive-substances assay for estimating lipid peroxidation in plant
tissues containing anthocyanin and other interfering compounds.
Planta. 1999;207:604–11.
48. Yan SP, Zhang QY, Tang ZC, Su WA, Sun WN. Comparative proteomic
analysis provides new insights into chilling stress responses in rice. Mol Cell
Proteomics. 2006;5:484–96.
49. Veljovic-Jovanovic S, Noctor G, Foyer CH. Are leaf hydrogen peroxide
concentrations commonly overestimated? The potential influence of
artefactual interference by tissue phenolics and ascorbate. Plant Physiol
Biochem. 2002;40:501–7.
50. Beyer WF, Fridovich I. Assaying for superoxide dismutase activity: some
large consequences of minor changes in conditions. Anal Biochem.
1987;161:559–66.
51. Aebi H. Catalase in vitro. Methods Enzymol. 1984;105:121–6.
52. Donnelly BE, Madden RD, Ayoubi P, Porter DR, Dillwith JW. The wheat
(Triticum aestivum L.) leaf proteome. Proteomics. 2005;5:1624–33.
53. Chaves MM, Flexas J, Pinheiro C. Photosynthesis under drought and salt stress:
regulation mechanisms from whole plant to cell. Ann Bot. 2009;103:551–60.
54. Kosová K, Vítámvás P, Prásil IT, Renaut J. Plant proteome changes under
abiotic stress – contribution of proteomics studies to understanding plant
stress response. J Proteomics. 2011;74:1301–22.
55. Danshina PV, Schmalhausen EV, Avetisyan AV, Muronetz VI. Mildly oxidized
glyceraldehydes-3-phosphate dehydrogenase as a possible regulator of
glycolysis. IUBMB Life. 2001;51:309–14.
56. Bedhomme M, Adamo M, Marchand CH, Couturier J, Rouhier N, Lemaire SD,
et al. Glutathionylation of cytosolic glyceraldehyde-3-phosphate
dehydrogenase from the model plant Arabidopsis thaliana is reversed
by both glutaredoxins and thioredoxins in vitro. Biochem J. 2012;445:337–47.
57. Rochat T, Boudebbouze S, Gratadoux JJ, Blugeon S, Gaudu P, Langella P,
et al. Proteomic analysis of spontaneous mutants of Lactococcus lactis:
Involvement of GAPDH and arginine deiminase pathway in H2O2 resistance.
Proteomics. 2012;12:1792–805.
58. Wierenga RK, Kapetaniou EG, Venkatesan R. Triosephosphate isomerise: a
highly evolved biocatalyst. Cell Mol Life Sci. 2010;67:3961–82.
59. Riccardi F, Gazeau P, de Vienne D, Zivy M. Protein changes in response to
progressive water deficit in maize: quantitative variation and polypeptide
identification. Plant Physiol. 1998;117:1253–63.
Cheng et al. BMC Plant Biology (2016) 16:188
60. Salekdeh GH, Siopongco J, Wade LJ, Ghareyazie B, Bennett J. Proteomics
analysis of rice leaves during drought stress and recovery. Proteomics.
2002;2:1131–45.
61. Umeda M, Hara C, Matsubayashi Y, Li HH, Liu Q, Tadokoro F, et al. Expressed
sequence tags from cultured cells of rice (Oryza sativa L.) under stressed
conditions: analysis of transcripts of genes engaged in ATP-generating
pathways. Plant Mol Biol. 1994;25:469–78.
62. Fei G, Zhou Y, Huang L, He D, Zhang G. Proteomic analysis of long-term
salinity stress-responsive proteins in Thellungiella halophila leaves. Chinese
Sci Bull. 2008;53:3530–7.
63. Pandey S, Rai R, Rai LC. Proteomics combines morphological, physiological
and biochemical attributes to unravel the survival strategy of Anabaena sp.
PCC7120 under arsenic stress. J Proteomics. 2012;75:921–37.
64. Brugiere N, Dubois F, Limami AM, Lelandais M, Roux Y, Sangwan RS, et al.
Glutamine synthetase in the phloem plays a major role in controlling
proline production. Plant Cell. 1999;11:1995–2012.
65. Gadaleta A, Nigro D, Giancaspro A, Blanco A. The glutamine synthetase
(GS2) genes in relation to grain protein content of durum wheat. Funct
Integr Genomics. 2011;11:665–70.
66. Díaz P, Betti M, Sánchez DH, Udvardi MK, Monza J, Márquez AJ.
Deficiency in plastidic glutamine synthetase alters proline metabolism
and transcriptomic response in Lotus japonicus under drought stress.
New Phytol. 2010;188:1001–13.
67. Roje S. S-Adenosyl-L-methionine: beyond the universal methyl group donor.
Phytochemistry. 2006;67:1686–98.
68. Roeder S, Dreschler K, Wirtz M, Cristescu SM, van Harren FJ, Hell R, et al.
SAM levels, gene expression of SAM synthetase, methionine synthase and
ACC oxidase, and ethylene emission from N. suaveolens flowers. Plant Mol
Biol. 2009;70:535–46.
69. Mayne MB, Coleman JR, Blumwald E. Differential expression during drought
conditioning of a root-specific S-adenosylmethionine synthetase from jack
pine (Pinus banksiana Lamb.) seedlings. Plant Cell Environ. 1996;19:958–66.
70. Quiroga M, Guerrero C, Botella MA, Ros Barceló A, Amaya I, Medina MI, et al.
A tomato peroxidase involved in the synthesis of lignin and suberin. Plant
Physiol. 2000;122:1119–27.
71. Sánchez-Aguayo I, Rodríguez-Galán JM, García R, Torreblanca J, Pardo JM.
Salt stress enhances xylem development and expression of S-adenosyl-lmethionine synthase in lignifying tissues of tomato plants. Planta.
2004;220:278–85.
72. Yan XL, Liao H, Trull MC, Beebe SE, Lynch JP. Induction of a major leaf acid
phosphatase does not confer adaptation to low phosphorus availability in
common bean. Plant Physiol. 2001;125:1901–11.
73. Yun SJ, Kaeppler SM. Induction of maize acid phosphatase activities under
phosphorus starvation. Plant Soil. 2001;237:109–15.
74. Tian J, Liao H, Wang X, Cao A, Yan XL. Phosphorus starvation-induced
expression of leaf acid phosphatase isoforms in soybean. Acta Bot Sin.
2003;45:1037–42.
75. Tsuji H, Meguro N, Suzuki Y, Tsutsumi N, Hirai A, Nakazono M. Induction of
mitochondrial aldehyde dehydrogenase by submergence facilitates oxidation
of acetaldehyde during re-aeration in rice. FEBS Lett. 2003;546:369–73.
76. Marchitti SA, Brocker C, Stagos D, Vasiliou V. Non-P450 aldehyde oxidizing
enzymes: the aldehyde dehydrogenase superfamily. Expert Opin Drug
Metab Toxicol. 2008;4:697–720.
77. Sunkar R, Bartels D, Kirch HH. Overexpression of a stress-inducible aldehyde
dehydrogenase gene from Arabidopsis thaliana in transgenic plants
improves stress tolerance. Plant J. 2003;35:452–64.
78. Shiraishi T, Fukusaki E, Kobayashi A. Formate dehydrogenase in rice plant:
growth stimulation effect of formate in rice plant. J Biosci Bioeng. 2000;89:241–6.
79. Alekseeva AA, Savin SS, Tishkov VI. NAD(+)-dependent formate dehydrogenase
from plants. Acta Nat. 2011;3:38–54.
80. Bykova NV, Stensballe A, Egsgaard H, Jensen ON, Moller IM. Phosphorylation
of formate dehydrogenase in potato tuber mitochondria. J Biol Chem.
2003;278:26021–30.
81. Lehner I, Niehof M, Borlak J. An optimized method for the isolation and
identification of membrane proteins. Electrophoresis. 2003;24:1795–808.
82. Heide H, Kalisz HM, Follmann H. The oxygen evolving enhancer protein 1
(OEE) of photosystem II in green algae exhibits thioredoxin activity. J Plant
Physiol. 2004;161:139–49.
83. Marin-Navarro J, Moreno J. Modification of the proteolytic fragmentation
pattern upon oxidation of cysteines from ribulose-1,5-bisphosphate
carboxylase/oxygenase. Biochemistry. 2003;42:14930–8.
Page 22 of 23
84. Flexas J, Ribas-Carbò M, Bota J, Galmés J, Henkle M, Martínez-Canellas S,
et al. Decreased Rubisco activity during water stress is not induced by
decreased relative water content but related to conditions of low stomatal
conductance and chloroplast CO2 concentration. New Phytol. 2006;172:73–82.
85. Galmés J, Aranjuelo I, Medrano H, Flexas J. Variation in Rubisco content and
activity under variable climatic factors. Photosynth Res. 2013;117:73–90.
86. Nakahara K, Yamamoto H, Miyake C, Yokota A. Purification and characterization
of class-I and class-II fructose-1,6-bisphosphate aldolase from the
cyanobacterium Synechocystis sp. PCC 6803. Plant Cell Physiol. 2003;44:326–33.
87. Patron NJ, Rogers MB, Keeling PJ. Gene replacement of fructose-1,6bisphosphate aldolase supports the hypothesis of a single photosynthetic
ancestor of chromalveolates. Eukaryot Cell. 2004;3:1169–75.
88. Yamazaki S, Nomata J, Fujita Y. Differential operation of dual
protochlorophyllide reductases for chlorophyll biosynthesis in response
to environmental oxygen levels in the cyanobacterium Leptolyngbya
boryana. Plant Physiol. 2006;142:911–22.
89. Sakuraba Y, Rahman L, Cho SH, Kim YS, Koh HJ, Yoo SC, et al. The rice faded
green leaf locus encodes protochlorophyllide oxidoreductase B and is essential
for chlorophyll synthesis under high light conditions. Plant J. 2013;74:122–33.
90. Reinbothe S, Reinbothe C. The regulation of enzymes involved in
chlorophyll biosynthesis. Eur J Biochem. 1996;237:323–43.
91. Shepherd M, Reid JD, Hunter CN. Purification and kinetic characterization of
the magnesium protoporphyrin IX methyltransferase from Synechocystis
PCC6803. Biochem J. 2003;371:351–60.
92. Jiang GQ, Wang Z, Shang HH, Yang WL, Hu ZA, Phillips J, et al. Proteome
analysis of leaves from the resurrection plant Boea hygrometrica in response
to dehydration and rehydration. Planta. 2007;225:1405–20.
93. Frova C. The plant glutathione transferase gene family: genomic structure,
functions, expression and evolution. Physiol Plantarum. 2003;119:469–79.
94. Frova C. Glutathione transferases in the genomics era: New insights and
perspectives. Biomol Eng. 2006;23:149–69.
95. Margis R, Dunand C, Teixeira FK, Margis-Pinheiro M. Glutathione peroxidase
family: an evolutionary overview. J FEBS. 2008;275:3959–70.
96. Gill SS, Tuteja N. Reactive oxygen species and antioxidant machinery in
abiotic stress tolerance in crop plants. Plant Physiol Biochem. 2010;48:909–30.
97. Suzuki N, Koussevitzky S, Mittler R, Miller G. ROS and redox signaling in the
response of plants to abiotic stress. Plant Cell Environ. 2011;35:259–70.
98. Raven EL, Lad L, Sharp KH, Mewies M, Moody PC. Defining substrate
specificity and catalytic mechanism in ascorbate peroxidase. Biochem Soc
Symp. 2004;71:27–38.
99. Davletova S, Rizhsky L, Liang H, Shengqiang Z, Oliver DJ, Coutu J, et al.
Cytosolic ascorbate peroxidase 1 is a central component of the reactive
oxygen gene network of Arabidopsis. Plant Cell. 2005;17:268–81.
100. Morgan MJ, Lehmann M, Schwarzländer M, Baxter CJ, Sienkiewicz-Porzucek A,
Williams TC, et al. Decrease in manganese superoxide dismutase leads to
reduced root growth and affects tricarboxylic acid cycle flux and mitochondrial
redox homeostasis. Plant Physiol. 2008;147:101–14.
101. Miriyala S, Spasojevic I, Tovmasyan A, Salvemini D, Vujaskovic Z, St Clair D,
et al. Manganese superoxide dismutase, MnSOD and its mimics. Biochim
Biophys Acta. 1822;2012:794–814.
102. Franklin CC, Backos DS, Mohar I, White CC, Forman HJ, Kavanagh TJ. Structure,
function, and post-translational regulation of the catalytic and modifier
subunits of glutamate cysteine ligase. Mol Aspects Med. 2009;30:86–98.
103. Lu SC. Regulation of glutathione synthesis. Mol Aspects Med. 2009;30:42–59.
104. Ganapathi S, Chidambaram P, Natarajan S, Vengoji R, Karuppannan V.
Combined expression of chitinase and β-1,3-glucanase genes in indica rice
(Oryza sativa L.) enhances resistance against Rhizoctonia solani. Plant Sci.
2008;175:283–90.
105. Meirinho S, Carvalho M, Dominguez Á, Choupina A. Isolation and
characterization by asymmetric PCR of the ENDO1 gene for glucan
endo-1,3-β-D-glucosidase in Phytophthora cinnamomi associated with the
ink disease of Castanea sativa Mill. Braz Ach Bol Technol. 2010;53:513–8.
106. Chen AP, Wang GL, Qu ZL, Lu CX, Liu N, Wang F, et al. Ectopic expression
of ThCYP1, a stress-resposive cyclophilin gene from Thellungiella halophila,
confers salt tolerance in fission yeast and tobacco cells. Plant Cell Rep.
2007;26:237–45.
107. Gan PH, Shan W, Blackman LM, Hardham AR. Characterization of
cyclophilin-encoding genes in phytophthora. Mol Genet Genomics.
2009;281:565–78.
108. Weng XY, Huang YY, Gao H, Sun JY. Characterization of a xylanase inhibitor
TAXI-I from wheat. Biol Plantarum. 2010;54:154–8.
Cheng et al. BMC Plant Biology (2016) 16:188
109. Moscetti I, Tundo S, Janni M, Sella L, Gazzetti K, Tauzin A, et al. Constitutive
expression of the xylanase inhibitor TAXI-III delays Fusarium head blight
symptoms in durum wheat transgenic plants. Mol Plant Microbe Interact.
2013;26:1464–72.
110. Hemant RK, Anil KS, Sudhir KS, Sneh LSP, Ashwani P. Genome wide
expression analysis of CBS domain containing proteins in Arabidopsis
thaliana (L.) Heynh and Oryza sativa L. reveals their developmental and
stress regulation. BMC Genomics. 2009;10:200.
111. Singh AK, Kumar R, Pareek A, Sopory SK, Singla-Pareek SL. Overexpression of
rice CBS domain containing protein improves salinity, oxidative, and heavy
metal tolerance in transgenic tobacco. Mol Biotechnol. 2012;52:205–16.
112. Youssef A, Laizet Y, Block MA, Marechal E, Alcaraz JP, Larson TR, et al. Plant
lipid-associated fibrillin proteins condition jasmonate production under
photosynthetic stress. Plant J. 2009;61:436–45.
113. Recklies AD, White C, Ling H. The chitinase 3-like protein human cartilage
glycoprotein 39 (HC-gp39) stimulates proliferation of human connectivetissue cells and activates both extracellular signal-regulated kinase- and
protein kinase B-mediated signalling pathways. Biochem J. 2002;365:119–26.
114. Liu JJ, Sturrock R, Ekramoddoullah AK. The superfamily of thaumatin-like
proteins: its origin, evolution, and expression towards biological function.
Plant Cell Rep. 2010;29:419–36.
115. Leyva JA, Bianchet MA, Amzel LM. Understanding ATP synthesis: structure
and mechanism of the F1-ATPase (Review). Mol Membr Biol. 2003;20:27–33.
116. Itoh H, Takahashi A, Adachi K, Noji H, Yasuda R, Yoshida M, et al.
Mechanically driven ATP synthesis by F1-ATPase. Nature. 2004;427:465–8.
117. Christie AH, Allen GG, Gregory JT. Induction of vacuolar ATPase and
mitochondrial ATP synthase by aluminum in an aluminum-resistant cultivar
of wheat. Plant Physiol. 2001;125:2068–77.
118. Zhang XX, Takano T, Liu SK. Identification of a mitochondrial ATP synthase
small subunit gene (RMtATP6) expressed in response to salts and osmotic
stresses in rice (Oryza sativa L.). J Exp Bot. 2006;57:193–200.
119. Zhang XX, Liu SK, Takano T. Overexpression of a mitochondrial ATP
synthase small subunit gene (AtMtATP6) confers tolerance to several abiotic
stresses in Saccharomyces cerevisiae and Arabidopsis thaliana. Biotechnol
Lett. 2008;30:1289–94.
120. Dzeja PP, Terzic A. Adenylate kinase and AMP signaling networks: metabolic
monitoring, signal communication and body energy sensing. Int J Mol Sci.
2009;10:1729–72.
121. Singh BN, Mishra RN, Agarwal PK, Goswami M, Nair S, Sopory SK, et al. A
pea chloroplast translation elongation factor that is regulated by abiotic
factors. Biochem Biophys Res Commun. 2004;320:523–30.
122. Wan XY, Liu JY. Comparative proteomics analysis reveals an intimate protein
network provoked by hydrogen peroxide stress in rice seedling leaves. Mol
Cell Proteomics. 2008;7:1469–88.
123. Ristic Z, Momcilović I, Fu J, Callegari E, DeRidder BP. Chloroplast protein
synthesis elongation factor, EF-Tu, reduces thermal aggregation of rubisco
activase. J Plant Physiol. 2007;164:1564–71.
124. Margus T, Remm M, Tenson T. A computational study of elongation factor
G (EFG) duplicated genes: diverged nature underlying the innovation on
the same structural template. PLoS One. 2011;6:e22789.
125. Ma H, Song L, Shu Y, Wang S, Niu J, Wang Z, et al. Comparative proteomic
analysis of seedling leaves of different salt tolerant soybean genotypes.
J Proteomics. 2012;75:1529–46.
126. Rodnina M, Wintermeyer W. The ribosome as a molecular machine: the
mechanism of tRNA-mRNA movement in translocation. Biochem Soc Trans.
2011;39:658–62.
127. Xu M, Wang Y, Chen L, Pan B, Chen F, Fang Y, et al. Down-regulation of
ribosomal protein S15A mRNA with a short hairpin RNA inhibits human
hepatic cancer cell growth in vitro. Gene. 2014;536:84–9.
128. Palma JM, Sandalio LM, Corpas FJ, Romero-Puertas MC, McCarthy I, del Río LA.
Plant proteases, protein degradation, and oxidative stress: role of peroxisomes.
Plant Physiol Bioch. 2002;40:521–30.
129. Chamieh H, Marty V, Guetta D, Perollier A, Franzetti B. Stress regulation of
the PAN-proteasome system in the extreme halophilic archaeon
Halobacterium. Extremophiles. 2012;16:215–25.
130. Pang QY, Chen SX, Dai SJ, Chen YZ, Wang Y, Yan XF. Comparative
proteomics of salt tolerance in Arabidopsis thaliana and Thellungiella
halophila. J Proteome Res. 2010;9:2584–99.
131. Wang W, Vinocur B, Shoseyov O, Altman A. Role of plant heatshock proteins
and molecular chaperones in the abiotic stress response. Trends Plant Sci.
2004;9:244–52.
Page 23 of 23
132. Feng JT, Liu YK, Song HY, Dai Z, Qin LX, Almofti MR, et al. Heat-shock
protein 27: a potential biomarker for hepatocellular carcinoma identified by
serum proteome analysis. Proteomics. 2005;5:4581–8.
133. Jiang Y, Yang B, Harris NS, Deyholos MK. Comparative proteomics
analysis of NaCl stress-responsive proteins in Arabidopsis roots. J Exp
Bot. 2007;58:3591–607.
134. Cheng LX, Zhang X, Zhao QX, Li HJ, Wang YP, Wang DX, et al. Comparative
proteomic analysis of cold-induced sweetening in potato (Solanum
tuberosum L.) tuber. Acta Physiol Plant. 2014;36:1197–210.
135. Cuéllar J, Perales-Calvo J, Muga A, Valpuesta JM, Moro F. Structural insights
into the chaperone activity of the 40-kDa heat shock protein DnaJ: binding
and remodeling of a native substrate. J Biol Chem. 2013;288:15065–74.
136. Maruyama T, Furuani M. Archael Peptidyl-Prolyl cis/trans Isomerases
(PPIases). Front Biosci. 2000;5:821–36.
137. Pemberton TJ. Identification and comparative analysis of sixteen fungal
peptidyl-prolyl cis/trans isomerase repertoires. BMC Genomics. 2006;7:244.
138. Hoogenboom BW, Suda K, Engel A, Fotiadis D. The supramolecular
assemblies of voltage-dependent anion channels in the native membrane.
J Mol Biol. 2007;370:246–55.
139. De Pinto V, Messina A, Lane DJR, Lawen A. Voltage-dependent anion-selective
channel (VDAC) in the plasma membrane. FEBS Lett. 2010;584:1793–9.
140. Wang L, He XL, Zhao YJ, Shen YZ, Huang ZJ. Wheat vacuolar H+-ATPase
subunit B cloning and its involvementin salt tolerance. Planta. 2011;234:1–7.
141. Agarwal P, Reddy MK, Sopory SK, Agarwal PK. Plant rabs: characterization,
functional diversity, and role in stress tolerance. Plant Mol Biol Rep.
2009;27:417–30.
142. Pollard TD. Regulation of actin filament assembly by Arp2/3 complex and
formins. Annu Rev Biophys Biomol Struct. 2007;36:451–77.
143. Pollard TD, Cooper JA. Actin, a central player in cell shape and movement.
Science. 2009;326:1208–12.
144. Nakamura K, Zuppini A, Arnaudeau S, Lynch J, Ahsan I, Krause R, et al.
Functional specialization of calreticulin domains. J Cell Biol. 2001;154:961–72.
145. Chen MH, Tain GW, Gafni Y, Citovsky V. Effects of calreticulin on viral
cell-to-cell movement. Plant Physiol. 2005;138:1866–76.
146. Jia XY, Xu CY, Jing RL, Jing RL, Li RZ, Mao XG, et al. Molecular cloning and
characterization of wheat calreticulin (CRT) gene involved in drought-stressed
responses. J Exp Bot. 2008;59:739–51.
147. Komatsu S, Yamada E, Furukawa K. Cold stress changes the concanavalin
A - positive glycosylation pattern of proteins expressed in the basal parts of
rice leaf sheaths. Amino Acids. 2009;36:115–23.
148. Pan YX, Wang XF, Liu HW, Zhang GY, Ma ZY. Molecular cloning of three
UDP-glucuronate decarboxylase genes that are preferentially expressed in
Gossypium fibers from elongation to secondary cell wall synthesis. J Plant
Biol. 2010;53:367–73.
149. Yan J, Wang J, Zhang H. An ankyrin repeat-containing protein plays a
role in both disease resistance and antioxidation metabolism. Plant J.
2002;29:193–202.
150. Wolpert TJ, Navarre DA, Moore DL, Macko V. Identification of the 100-kD
victorin binding protein from oats. Plant Cell. 1994;6:1145–55.
151. Liang L, Lai Z, Ma W, Zhang Y, Xue Y. AhSL28, a senescence- and phosphate
starvation-induced S-like RNase gene in Antirrhinum. Biochim Biophys Acta.
2002;1579:64–71.
152. Hugot K, Ponchet M, Marais A, Ricci P, Galiana E. A tobacco S-like RNase
inhibits hyphal elongation of plant pathogens. Mol Plant Microbe Interact.
2002;15:243–50.
153. Zheng J, Wang YY, He YN, Zhou JJ, Li YP, Liu QQ, et al. Overexpression of
an S-like ribonuclease gene, OsRNS4, confers enhanced tolerance to high
salinity and hyposensitivity to phytochrome-mediated light signals in rice.
Plant Sci. 2014;214:99–105.
154. Zhou GA, Chang RZ, Qiu LJ. Overexpression of soybean ubiquitinconjugating enzyme gene GmUBC2 confers enhanced drought and salt
tolerance through modulating abiotic stress-responsive gene expression in
Arabidopsis. Plant Mol Biol. 2010;72:357–67.
155. Patridge EV, Ferry JG. WrbA from Escherichia coli and Archaeoglobus fulgidus
is an NAD(P)H: quinone oxidoreductase. J Bacteriol. 2005;188:3498–506.