Genetic analysis of phytoene synthase 1 (Psy1) gene function and regulation in common wheat
Bạn đang xem bản rút gọn của tài liệu. Xem và tải ngay bản đầy đủ của tài liệu tại đây (1.8 MB, 15 trang )
Zhai et al. BMC Plant Biology (2016) 16:228
DOI 10.1186/s12870-016-0916-z
RESEARCH ARTICLE
Open Access
Genetic analysis of phytoene synthase 1
(Psy1) gene function and regulation in
common wheat
Shengnan Zhai1, Genying Li2, Youwei Sun1, Jianmin Song2, Jihu Li1, Guoqi Song2, Yulian Li2, Hongqing Ling3,
Zhonghu He1,4* and Xianchun Xia1*
Abstract
Background: Phytoene synthase 1 (PSY1) is the most important regulatory enzyme in carotenoid biosynthesis,
whereas its function is hardly known in common wheat. The aims of the present study were to investigate Psy1
function and genetic regulation using reverse genetics approaches.
Results: Transcript levels of Psy1 in RNAi transgenic lines were decreased by 54–76 % and yellow pigment
content (YPC) was reduced by 26–35 % compared with controls, confirming the impact of Psy1 on carotenoid
accumulation. A series of candidate genes involved in secondary metabolic pathways and core metabolic
processes responded to Psy1 down-regulation. The aspartate rich domain (DXXXD) was important for PSY1
function, and conserved nucleotides adjacent to the domain influenced YPC by regulating gene expression,
enzyme activity or alternative splicing. Compensatory responses analysis indicated that three Psy1 homoeologs
may be coordinately regulated under normal conditions, but separately regulated under stress. The period
14 days post anthesis (DPA) was found to be a key regulation node during grain development.
Conclusion: The findings define key aspects of flour color regulation in wheat and facilitate the genetic
improvement of wheat quality targeting color/nutritional specifications required for specific end products.
Keywords: Carotenoid biosynthesis, RNAi, RNA-Seq, TILLING, Triticum aestivum
Background
Carotenoids, a complex class of C40 isoprenoid pigments
synthesized by photosynthetic organisms, bacteria and
fungi [1], are essential components of the human diet.
The most important function is as a dietary source of
provitamin A [2]. Vitamin A deficiency can result in xerophthalmia, increased infant morbidity and mortality, and
depressed immunological responses [3]. Additionally,
carotenoids as antioxidants can reduce the risk of agerelated macular degeneration, cancer, cardiovascular
diseases and other chronic diseases [4]. Common wheat
(Triticum aestivum L.) is a major cereal crop, supplying
significant amounts of dietary carbohydrate and protein
for over 60 % of the world population. It is also an
* Correspondence: ;
1
Institute of Crop Science, National Wheat Improvement Center, Chinese
Academy of Agricultural Sciences (CAAS), 12 Zhongguancun South Street,
Beijing 100081, China
Full list of author information is available at the end of the article
important source of carotenoids in human diets [5].
Moreover, carotenoids in wheat grains determine flour
color, an important quality trait for major wheat products
such as noodles.
Phytoene synthase (PSY) catalyzes a vital step in carotenoid biosynthesis, generally recognized as the most
important regulatory enzyme in the pathway [1, 6].
Although there are up to three PSY isozymes in grasses,
only Psy1 expression is associated with carotenoid accumulation in grains [7, 8]. The wheat Psy1 gene was cloned
based on the sequence homology, and QTL analysis
showed that Psy1 co-segregated with yellow pigment
content (YPC), which is significantly related to carotenoids (r = 0.8) [6, 9]. To date, several studies have focused
on homology-based cloning of Psy1 and QTL analysis,
whereas gene function and regulation remain to be
determined.
© The Author(s). 2016 Open Access This article is distributed under the terms of the Creative Commons Attribution 4.0
International License ( which permits unrestricted use, distribution, and
reproduction in any medium, provided you give appropriate credit to the original author(s) and the source, provide a link to
the Creative Commons license, and indicate if changes were made. The Creative Commons Public Domain Dedication waiver
( applies to the data made available in this article, unless otherwise stated.
Zhai et al. BMC Plant Biology (2016) 16:228
Common wheat has a large genome that consists of
three closely related (homoeologous) genomes with 93–
96 % sequence identity and a high proportion of repetitive
sequences (>80 %) [10]. Homoeologous gene duplication
limits the use of forward genetics due to compensatory
processes that mask the effects of single-gene knockout
mutations [11]. Therefore, the ability to investigate gene
function and regulation in wheat ultimately depends on
robust, flexible, high-throughput reverse genetics tools.
RNA interference (RNAi) is a sequence-specific gene
suppression system that has been used in a variety of
plant species as an efficient tool to decrease or knockout gene expression. RNAi has an enormous potential in
functional genomics of common wheat, because all
homoeologs (from the A, B and D subgenomes) can be
simultaneously silenced by a single RNAi construct [12].
To date, RNAi has been used to target a wide range of
genes in wheat, including those encoding lipoxygenase,
starch biosynthetic enzymes, and proteins involved in
storage [13–15].
With next-generation high-throughput sequencing
technologies, RNA-sequencing (RNA-Seq) has emerged
as a useful tool to profile genome-wide transcriptional
patterns in different tissues and developmental stages,
and can lead to the discovery novel genes in specific
biological processes [16]. In this context, comparative
analysis of transcriptome data between transgenic lines
and wild type can reveal the transcriptional regulation
network associated with genetic change.
Targeting induced local lesions in genomes (TILLING)
is a powerful reverse genetics approach combining
chemical mutagenesis with a high-throughput screen for
mutations, and has been widely used in functional
genomics [17]. Compared to typical reverse genetics
techniques such as RNAi and insertional mutagenesis,
the main advantage of TILLING is the ability to accumulate a series of mutated alleles, including silent, missense, truncation or splice site changes, with a range of
modified functions, from wild type to almost complete
loss of function [17]. These mutations are excellent materials for understanding gene function, genetic regulation and compensatory processes [18]. Moreover, alleles
generated by TILLING can be used in traditional breeding programs since the technology is non-transgenic and
the mutations are stably inherited.
The main objectives of the present work were to investigate Psy1 function and genetic regulation using three
complementary reverse genetics approaches. Psy1 was
specifically silenced in wheat grain by RNAi to confirm
Psy1 function. Comparative analysis of transcriptome data
between transgenic lines and non-transformed controls by
RNA-Seq was used to reveal the transcriptional regulation
network responding to Psy1 down-regulation. In addition,
two EMS (ethyl methanesulfonate)-mutagenised wheat
Page 2 of 15
populations were screened for mutations in Psy1 by TILLING to obtain a series of Psy1 alleles with potential to
increase our understanding of the gene function, genetic
regulation and compensatory processes. This integrative
approach provided new insights into the molecular basis
and regulatory processes of carotenoid biosynthesis in
wheat grain.
Methods
Wheat transformation and regeneration
The binary vector pSAABx17 containing the endospermspecific promoter of HMW-GS (High-Molecular-Weight
Glutenin Subunits) Bx17, the nopaline synthase (Nos)
terminator, and a selectable neomycin phosphotransferase
II (npt II) gene, was used to construct an RNAi vector.
The first exon of Psy1 (EF600063; 460 bp) was selected as
the trigger fragment. Briefly, the sense fragment of Psy1
was amplified using the primer pair PS-F containing a
BamHI site and PS-R with an AsuII site, while the antisense fragment was amplified with primers PA-F containing a KpnI site and PA-R including a NheI site
(Additional file 1: Table S1). The fourth intron of Psy1
as the spacer was amplified by primers In-F and In-R.
All sequences and directions of the inserts were confirmed by sequencing. The final RNAi construct was
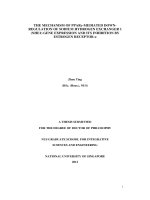
named pRNAiPsy1 (Fig. 1).
pRNAiPsy1 was transformed into wheat cultivar NB1
by Agrobacterium tumefaciens-mediated transformation
[19]. Briefly, immature seeds were collected at 14 DPA
and sterilized with 70 % ethanol for 1 min, 20 % bleach
for 15 min and rinsed three times with sterile water.
Isolated immature embryos were precultured on the induction medium for 4 d in dark at 25 °C. Then, the
embryos were inoculated with a drop of A. tumefaciens
suspension and co-cultured for 3 d on the same
medium. The immature embryos were cultured on selection medium at 25 °C in the dark for 3 weeks for callus
induction. Then, the calli were transferred onto regeneration medium at 25 °C in the light with a density of
45 μmol m−2 s−1 and 16 h photoperiod for another
3 weeks for differentiation process. The culture media
Fig. 1 Non-scale diagram of the RNAi cassette in the transformation
plasmid pRNAiPsy1. The trigger fragment of Psy1 was placed in forward
(Sense) and reverse (Antisene) orientations separated by the fourth
intron of the wheat Psy1 gene (Spacer). Restriction sites used in the RNAi
vector construction are indicated. Bx17, endosperm-specific promoter;
Nos, Agrobacterium tumefaciens nopaline synthase (Nos) terminator
Zhai et al. BMC Plant Biology (2016) 16:228
are shown in Additional file 2: Table S2. All materials
used for RNAi were kept at Crop Research Institute,
Shandong Academy of Agricultural Sciences.
Regenerated plants were screened using G418. Surviving plants were transferred to soil and grown to maturity
under growth chamber conditions of 22/16 °C day/night
temperatures, 50–70 % relative humidity, 16 h photoperiod, and light intensity of 300 μmol photons m−2 s−1.
Transformed plants were verified by PCR using specific
primer pairs designed for the FAD2 intron, a part of the
pSAABx17 vector (Additional file 1: Table S1). Positive
transgenic plants were self-pollinated and harvested in
the following generations. T3 transgenic lines and nontransformed controls were grown under field conditions
in Jinan, Shandong province, during the 2013–14 cropping season. Seeds were sown in 2 m rows with 20
plants per row, 30 cm between rows and 3 rows per
transgenic line. Transformed plants were verified by
PCR and tagged at anthesis. Grains for Psy1 expression
analysis were collected at 7-day intervals from 7 to
28 days post anthesis (DPA), immediately frozen in liquid nitrogen, and stored at −80 °C. Mature grains were
harvested for YPC assays.
RNA extraction and gene expression analysis
Total RNA was extracted from grains of T3 transgenic
lines and non-transformed controls at different developmental stages using an RNAprep Pure Plant Kit (Tiangen
Biotech, Beijing, China), and then treated with DNase I
(Qiagen, Valencia, CA, USA), according to the manufacturer’s instructions. RNA purity and concentration were
measured using a NanoDrop-2000 spectrophotometer
(Thermo Scientific, Wilmington, DE, USA). RNA integrity
was evaluated on agarose gels. Reverse transcription was
performed with 1 μg of total RNA using a PrimeScript™
RT Reagent Kit (Takara Bio Inc., Otsu, Japan) following
the manufacturer’s recommended protocol.
Quantitative real-time PCR (qRT-PCR) was performed
on a Roche LightCycler 480 (Roche Applied Science,
Indianapolis, IN, USA) in 20 μl reaction mixtures containing 10 μl of LightCycler FastStart DNA Master SYBR
Green (Roche Applied Sciences), 0.4 μM of each primer,
50 ng of cDNA and 8.2 μl of ddH2O. Amplification conditions were an initial 95 °C for 10 min, and 40 cycles of
95 °C for 15 s, 60 °C for 20 s and 72 °C for 20 s. Fluorescence was acquired at 60 °C. Designs for gene-specific
primer amplifying all three Psy1 genes were based on
conserved regions among the A, B and D subgenomes.
Expression of a β-actin gene was used as an endogenous
control to normalize expression levels of different
samples. The primers are listed in Additional file 3:
Table S3. Specificities of primers were confirmed by sequencing qRT-PCR products and melt curve analyses.
Gene expression levels were presented as multiples of
Page 3 of 15
actin levels calculated by the formula 2-ΔCT [ΔCT = (Ct
value of target gene) − (Ct value of actin)] to correct for
differential cDNA concentrations among samples [20].
For each line, three biological replicates, each with three
technical replicates, were performed and the data were
expressed as means ± standard error (SE).
Yellow pigment content (YPC) assay
Grains from individual plants of T3 transgenic lines and
non-transformed controls were ground into whole-grain
flour by a Cyclotec™ 1093 mill (Foss Tecator Co., Hillerod,
Denmark). The whole-grain flour (0.5 g) was used for
YPC assay following Zhai et al. [21]. Three biological repeats were performed for each line, and each sample was
assayed in duplicate; all differences between two repeats
were less than 10 %.
Transcriptome library construction and RNA sequencing
To investigate the complex transcriptional regulation network underlying Psy1 down-regulation, deep-sequencing
analysis of transcriptomes of transgenic lines and nontransformed controls was performed by RNA-Seq. Three
transgenic lines (275-3A, 273-2A and 279-1A) with the
most significantly reduced YPC were selected (Fig. 2).
Grains of transgenic lines and controls at 14 DPA were
used for transcriptome analysis, because this developmental stage showed substantially decreased Psy1 expression
(Fig. 3). Total RNA were extracted from pooled grains of
six biological repeats per transgenic line or controls
and sent to BGI (Beijing Genomics Institute, Shenzhen,
China) for RNA-Seq. Transcriptome libraries were
prepared and sequenced on the Illumina HiSeq™ 2000
platform (Illumina, San Diego, CA, USA) following
Zhou et al. [22].
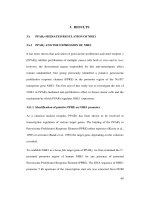
Fig. 2 Yellow pigment content in grains from T3 transgenic lines and
non-transformed controls. Data are presented as means ± standard
error from three biological replicates. The double asterisks indicate
significant differences between transgenic lines and controls at
P = 0.01. CK, non-transformed controls
Zhai et al. BMC Plant Biology (2016) 16:228
Page 4 of 15
also analyzed against the KEGG database (Kyoto Encyclopedia
of Genes and Genomes; to
explore the potential metabolic pathways that might be involved in reduction of carotenoid synthesis in transgenic lines.
Subcellular localization of PSY1 in wheat
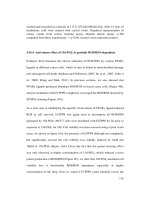
Fig. 3 Expression levels of Psy1 in developing grains from T3 transgenic
lines and non-transformed controls. Gene expression levels were
measured by qRT-PCR and normalized to the transcript level of a
constitutively expressed β-actin gene in the same sample. Data are
presented as means ± standard error from three biological replicates
with three technical replicates each. Significant differences (Student’s t
test) in transgenic lines compared to the controls are represented by
one or two asterisks: * P <0.05, ** P <0.01. CK, non-transformed controls
Screening and analysis of differentially expressed genes
(DEGs)
Original image data were transformed into sequence
data by base calling, and defined as raw reads. Before
data analysis, it was prerequisite to remove dirty raw
reads including reads with adaptors, those with more
than 10 % of unknown bases and low quality reads
(more than 50 % low quality bases). Clean reads were
then aligned to the reference genome of T. aestivum
( />a/triticum_aestivum/). Briefly, the clean reads were
mapped to the genome reference by BWA software [23]
and to the gene reference with Bowtie software [24].
Reads mapping to unique sequences, designated as
unigenes, were the most critical subset in the transcriptome libraries as they explicitly identify a transcript.
Unigene function was annotated by alignment of the
unigenes with the NCBI (National Center for Biotechnology Information) non-redundant (Nr) database using
Blastx at an E-value threshold of 10−5.
Gene expression level was normalized as the FPKM
(fragments per kb per million reads) by a RSEM software
package [25]. The fold-change in expression of each
gene between the transgenic line and non-transformed
control was evaluated by FPKM ratio. We used a false
discovery rate (FDR) of <0.001 and the absolute value of
|log2Ratio| ≥1 as the threshold to judge the DEGs. To obtain robust and reliable effects of Psy1 down-regulation on
gene transcription, only DEGs consistent across all three
transgenic lines were chosen for subsequent analysis. Gene
ontology (GO) annotation was conducted using the
Blast2GO program ( The GO
categorizations were displayed as three hierarchies, namely
biological process (BP), cellular component (CC) and molecular function (MF) by WEGO software [26]. DEGs were
To investigate subcellular localization of PSY1, the
cDNA sequence of Psy1 without the termination codon
was isolated from common wheat cultivar Jimai 22
(developed by the Crop Research Institute, Shandong
Academy of Agricultural Sciences) using primers, Psy1GFP-F (5′-GCCCAGATCAACTAGTATGGCCACCAC
CGTCACGCTGC-3′) and Psy1-GFP-R (5′-TCGAGAC
GTCTCTAGAGGTCTGGTTATTTCTCAGTG-3′), and
confirmed by sequencing. The cDNA of Psy1 was then
C-terminally fused to the green fluorescent protein
(GFP) gene in the pAN580 vector to create Psy1-GFP
under the control of the cauliflower mosaic virus
(CaMV) 35S promoter. The Psy1-GFP fusion and GFP
were transiently transformed into wheat protoplasts
following Zhang et al. [27]. Briefly, the stem and sheath
of 30 wheat seedlings were cut into approximately
0.5 mm strips, which were immediately transferred into
0.6 M mannitol for 10 min in the dark. After discarding
the mannitol, the strips were incubated in an enzyme
solution for 4–5 h in the dark with gentle shaking (60–
80 rpm). Then, an equal volume of W5 solution was
added, followed by vigorous shaking by hand for 10 s.
Protoplasts were released by filtering through 40 μm
nylon meshes into round bottom tubes with 3–5 washes
of the strips using W5 solution. The pellets were
collected by centrifugation at 1,500 rpm for 3 min, and
were then resuspended in MMG solution. Then, PEGmediated transfections were carried out [28]. Fluorescence
images were observed by a Zeiss LSM710 confocal laser
microscope (Carl Zeiss MicroImaging GmbH, Germany).
EMS mutagenesis
Two EMS-mutagenised common wheat populations
were constructed following Slade et al. [17] with minor
modifications. In brief, approximately 5,000 seeds of common wheat cultivars Jimai 22 and Jimai 20 (developed by
the Crop Research Institute, Shandong Academy of
Agricultural Sciences) were treated overnight with 1.2 %
EMS solution and surviving plants were grown to maturity. Seeds from the leading spikes of the M1 plants were
harvested and one grain from each plant was sown to
generate the M2 population (Jimai 20: 1,250 lines; Jimai
22: 1,240 lines). Genomic DNA was isolated from individual M2 plants for TILLING analysis. Twenty seeds from
each M2 line containing a mutation in the Psy1 gene
and wild type were grown under field conditions for
further analysis.
Zhai et al. BMC Plant Biology (2016) 16:228
Mutation screening by TILLING
DNA samples were extracted from individual M2 plants
of EMS-mutagenised populations derived from Jimai 20
and Jimai 22. DNA concentration was measured by a
NanoDrop-2000 spectrophotometer (Thermo Scientific)
and standardized. Equal amounts of DNA from individual plant samples were pooled eightfold and organized
into 96-well plates. The optimal target region for TILLING screening, considered as one of the most promising
for identifying mutations affecting protein function, was
defined by the program CODDLE (Codons Optimized to
Discover Deleterious Lesions; In conjunction with the CODDLE results,
homoeolog-specific primers were designed taking advantage of polymorphisms among the three homoeologs of
Psy1 in the hexaploid genome (Additional file 4: Table S4).
Primer specificities were validated using Chinese Spring
nulli-tetrasomic lines and by sequencing.
A fast and cost-effective method, mismatch-specific
endonuclease digestion of heteroduplexes followed by
non-denaturing polyacrylamide gels stained with silver,
was used for mutation detection, which has similar
sensitivity to traditional LI-COR screens [29]. Once a
positive individual was found, the amplified product was
sequenced to determine the accuracy of the mutation.
PARSESNP (Project Aligned Related Sequences and
Evaluate SNPs; />) was used to indicate the nature of each mutation. The
PARSESNP and SIFT (Sorting Intolerant from Tolerant;
programs were used to
predict the severity of each mutation. Mutations are predicted to have a severe effect on protein function if
PSSM scores are >10 and SIFT scores are <0.05 [30, 31].
Creation and characterization of F2 populations
To determine the impact of new Psy1 alleles on protein
function, homozygous M3 mutants carrying non-silent
(including truncation and missense) mutations were
backcrossed to corresponding wild type plants (Jimai 20
or Jimai 22) to reduce background noise. F1 plants were
self-pollinated and harvested separately. Two hundred
F2 seeds from each backcross and wild type were grown
under field conditions in Beijing during the 2013–14
cropping season, arranged in a randomized complete
block design. Seeds were sown in 2 m rows with 20
plants per row, 30 cm between rows and 10 rows per F2
population. Three genotypes (homozygous mutant, heterozygous mutant and wild-type genotype) in each F2
population were selected by sequencing. Spikes of five
biological replicates for each genotype were tagged at
anthesis. Immature grains were collected at 7-day intervals from 7 to 28 DPA for Psy1 expression analysis.
Mature grains were harvested for YPC assays. All F2
populations were conserved at the Crop Germplasm
Page 5 of 15
Resources Conservation Center, Chinese Academy of
Agricultural Sciences.
The impacts of new Psy1 alleles on YPC were assessed
by comparing the differences between homozygous and
heterozygous mutants with wild-type genotypes in each
F2 population. YPC was measured by the method
described above. All measurements were based on five
biological repeats. Wild-type genotypes in each F2 population were designated as the calibrator with its value set
to 1. The data are presented as means ± SE.
qRT-PCR was performed on cDNA from developing
grains of each genotype in each F2 population at 7, 14,
21 and 28 DPA to investigate the effect of mutations on
the expression pattern of the particular Psy1 gene and
its homoeologs. Briefly, total RNA was extracted from
pooled grains of five biological repeats per genotype.
Two sets of primers were designed by comparing coding
regions of the three Psy1 homoeologs. The first set of
primers amplifying all three homoeologs was used to
examine gene-specific expression. The second set, the
homoeolog-specific primers, was used to determine expression levels of each homoeolog (Additional file 3:
Table S3). The specificity of these primers was tested as
described above. The protocol for qRT-PCR was also the
same. For each sample three technical replicates were
performed. Relative expression was calculated using the
2-ΔΔCT method [20]. Relative expression levels of Psy1
and its homoeologs were normalized firstly to the transcript level of β-actin gene in the same sample and then
calculated relative to the value of wild-type genotypes at
28 DPA (set to 1) in each F2 population. Expression
analysis was performed only on F2 populations for the
mutants with significant phenotypic changes.
Functional domains and structural modeling of wheat
PSY1
Functional domains of PSY1 protein were predicted by the
NCBI’s Conserved Domain Database (CDD; http://
www.ncbi.nlm.nih.gov/Structure/cdd/cdd.shtml). To understand the effect of new Psy1 alleles on protein structure, the
three-dimensional structure of PSY1 was generated by the
SWISS-MODEL ( and visualized using Swiss-PdbViewer ( />Detection of alternative splicing variants
Splice junction mutations are speculated to have severe
effects on protein function because they can lead to
aberrant RNA splicing and subsequently altered or truncated protein translation [32]. Although no splice junction mutation was identified in this study, mutation sites
in M090122 and M092201 were adjacent to the splice site.
The mutation site in M090122 was localized at the 3′ end
of exon II and that in M092201 was at the second nucleotide from the 3′ end of exon V. Reverse transcription PCR
Zhai et al. BMC Plant Biology (2016) 16:228
was performed to investigate whether these mutations led
to alternative splicing. Briefly, total RNA were extracted
from homozygous mutant and wild type individuals, and
reverse transcribed into cDNA by the method described
above. The cDNA were amplified using the corresponding
primers (Additional file 5: Table S5), and PCR products
were analyzed by gel electrophoresis and sequenced.
Statistical analysis
Data are presented as means ± SE. Student’s t test was
used to assess the statistical significance of differences in
pairwise comparisons of transgenic lines and nontransformed controls, or between homozygous or heterozygous mutants and wild-type genotypes in each F2
population.
Results
Psy1 gene expression and YPC in grains of transgenic
lines
The 460 bp trigger fragment from Psy-A1 that was used
for the RNAi vector construction shared 90 % and 95 %
sequence similarity with Psy-B1 and Psy-D1, respectively.
Using the Agrobacterium-mediated transformation method
six positive, non-segregating transgenic lines, designated as
275-3A, 273-2A, 279-1A, 270-1A, 273-7A and 275-4A,
were obtained. They showed no differences in morphology
and development compared to non-transformed controls.
The effect of the transformed Psy1-hairpin on Psy1 expression was examined in six positive T3 transgenic lines
during grain development. At 7 DPA, qRT-PCR analyses
showed a significantly decreased transcript level of Psy1
in the transgenic line 275-3A (P <0.01), significantly
increased transcription levels in 273-2A and 273-7A
(P <0.05 and P <0.01, respectively), and slight changes
in the other lines, compared to non-transformed controls. Substantially decreased Psy1 expression levels of
54–76 % were found in all transgenic lines at 14 DPA
(P <0.01). At 21 and 28 DPA differences in expression
levels between the transgenic lines and controls were
very small (2–15 %), except for line 270-1A at 21
DPA and line 273-7A at 28 DPA (Fig. 3). Significantly
decreased YPC ranging from 26 to 35 % occurred in
all transgenic lines compared with non-transformed
controls (Fig. 2).
Page 6 of 15
lines, perhaps representing the reliable effects of Psy1
down-regulation on gene transcription (Additional file 7:
Table S7).
Categorization of GO terms of the 287 DEGs is shown
in Fig. 4. Metabolic process and cellular process were
the major categories annotated to the biological process
(BP); cell part and cell were the major categories annotated to the cellular component (CC); and catalytic activity and binding were the major categories annotated to
the molecular function (MF). Through pathway enrichment analysis, 199 of the 287 DEGs were assigned to 46
metabolic pathways (data not shown). The pathways
significantly associated with Psy1 down-regulation included carotenoid biosynthesis, diterpenoid biosynthesis,
various types of N-glycan biosynthesis, ubiquinone and
other terpenoid-quinone, glycolysis/gluconeogenesis, starch
and sucrose metabolism, fructose and mannose metabolism
and citrate cycle, photosynthesis, and carbon fixation in
photosynthetic organisms (Fig. 5). All candidate genes in
relevant pathways are listed in Additional file 8: Table S8.
PSY1 subcellular localization
Psy1-GFP was constructed and transiently expressed in
wheat protoplasts to investigate PSY1 subcellular localization.
Protoplasts allow us to observe the localization of transiently
Transcriptional profiling underlying Psy1 down-regulation
Totals of 1,128,107, 1,160,285, 1,192,915 and 1,228,928
unigenes were obtained for transgenic lines 273-2A,
275-3A, 279-1A and the control, respectively (Additional
file 6: Table S6). Comparison of the transcript abundances between transgenic lines and controls identified
948, 930 and 992 DEGs for 273-2A, 275-3A and 2791A, respectively (Additional file 6: Table S6). In total,
287 DEGs were consistent across all three transgenic
Fig. 4 Gene ontology classifications of differentially expressed genes
(DEGs) consistently present in all transgenic lines. Because a gene
can be assigned to more than one GO term, the sum of genes in
each category may exceed the number of DEGs (287). BP, Biological
process; CC, Cell component; MF, Molecular function
Zhai et al. BMC Plant Biology (2016) 16:228
Page 7 of 15
Fig. 5 Overview of major metabolic pathways associated with Psy1 down-regulation in transgenic lines. Genes that were 2-fold greater up- or
down-regulated are shown in red or blue, respectively. The number of candidate genes in a relevant pathway is indicated in brackets, and the
detail of candidate genes in each pathway is listed in Table S7. 1,3BPG, 3-phospho-D-glyceroyl phosphate; 3PG, 3-phospho-D-glycerate; FPP,
farnesyl diphosphate; G3P, glyceraldehyde 3-phosphate; GGPP, geranylgeranyl pyrophosphate; PEP, phosphoenolpyruvate; PSY, phytoene synthase;
ZDS, zeta-carotene desaturase
expressed PSY1 proteins, due to retain their tissue specificity
after isolation and thereby reflect in vivo conditions. GFP
alone was distributed evenly in the cytoplasm and nuclei
(data not shown), whereas the Psy1-GFP fusion proteins colocalized exclusively with autofluorescence signals of chlorophyll, indicating that PSY1 was localized in plastids (Fig. 6).
(between homozygous mutants and wild-type sibs),
whereas the mutation in Psy-D1 of M091217 significantly increased YPC by 34 %.
The expression profiles of Psy1 and its homoeologs in
grains of each genotype in the six F2 populations were
Identification of mutations in Psy1 by TILLING
Eighty two new Psy1 alleles were identified in the two
EMS-mutagenised populations, including three truncation, 26 missense and 53 silent mutations (Table 1;
Additional file 9: Table S9). As expected for alkylation of
guanine by EMS, the majority of mutations were G to A
(61.0 %) or C to T (31.7 %) transitions, with the exception of six mutations as follows: A to C (2), A to G, A to
T, T to C and T to G.
Two missense mutations (M090628 and M091151)
and three truncation mutations (M090158, M090950
and M091949) were predicted to have severe effects on
protein function based on SIFT score and PSSM values
(Table 2).
Characterization of new alleles of Psy1
Twenty-nine F2 populations were developed from
homozygous M3 mutants carrying non-silent (missense
and truncation) mutations and corresponding wild type
plants, and YPC assays were carried out to characterize
the effects of the non-silent mutations on protein function. As shown in Fig. 7 mutations in Psy-A1, namely
M090158, M090950, M091949, M090122 and
M091151, significantly reduced YPC by 9–29 %
Fig. 6 Subcellular localization of PSY1 in wheat protoplasts by confocal
microscopy. GFP (green), chlorophyll autofluorescence (red), bright-field,
and an overlay of green and red signals are shown. Bar, 10 μm
Zhai et al. BMC Plant Biology (2016) 16:228
Page 8 of 15
Table 1 Summary of non-silent mutations in Psy1 identified by TILLING
Gene
Psy-A1
M3 Plant
Cultivar
Exon\Intron
Nucleotide changea
Amino acid changeb
Codon change
Zygosityc
M091753
J22
Exon
C308T
A103V
GCA → GTA
Hom
M090158d
J20
Exon
C3201T
Q346*
CAG → TAG
Hom
M092432
J20
Exon
C3255T
L364F
CTT → TTT
Hom
M091887
J22
Exon
C335T
S112L
TCG → TTG
Hom
M091949
J22
Exon
C349T
Q117*
CAG → TAG
Hom
M090950
J22
Exon
G1224A
W172*
TGG → TAG
Hom
M091151
J22
Exon
G1230A
R174K
AGG → AAG
Hom
M090997
J22
Exon
G271A
E91K
GAG → AAG
Hom
M092152
J22
Exon
G3231A
E356K
GAG → AAG
Het
M091102
J22
Exon
G3554A
R397K
AGG → AAG
Hom
M090333
J20
Exon
G3605A
G414E
GGG → GAG
Het
M092889
J22
Exon
G371A
R124K
AGG → AAG
Hom
M090755
J20
Exon
G400A
G134R
GGG → AGG
Hom
M092383
J20
Exon
G412A
A138T
GCC → ACC
Het
M091295
J22
Exon
G436A
E146K
GAG → AAG
Hom
M092101
J22
Exon
G596A
E160K
GAG → AAG
Hom
M090122
J20
Exon
G629A
V171G
GTA → AGT
Hom
M092853
J22
Exon
T3169G
V335G
GTC → GGC
Het
Psy-B1
M091983
J22
Exon
G2073A
E244K
GAG → AAG
Het
Psy-D1
M092201
J20
Exon
C3792T
P370L
CCG → CTG
Het
M091755
J22
Exon
C4109T
P409S
CCT → TCT
Hom
M090628
J20
Exon
C4110T
P409L
CCT → CTT
Hom
M091169
J22
Exon
G1347A
D217N
GAC → AAC
Het
M091217
J22
Exon
G3609A
R309K
AGA → AAA
Hom
M090649
J20
Exon
G3761A
V360M
GTG → ATG
Hom
M090324
J20
Exon
G3779A
E366K
GAG → AAG
Het
M091365
J22
Exon
G4049A
D389N
GAC → AAC
Het
M092126
J22
Exon
G4071A
R396K
AGG → AAG
Hom
M090608
J20
Exon
G4097A
V405M
GTG → ATG
Het
a
the first letter indicates the wild type nucleotide, the number is its position from the start codon, and the last letter is the mutant nucleotide
b
the first letter indicates the wild type amino acid, the number is its position from the smethionine, and the last letter is the mutant amino acid
c
Hom, homozygous genotype; Het, heterozygous genotype
d
bold items, mutations severely affecting phenotype
e
*, termination mutation
Table 2 Mutations severely affecting protein function as predicted by the PARSESNP and SIFT programsa
Gene
Mutant
Cultivar
Nucleotide changeb
Amino acid changec
PSSM
SIFT
Psy-A1
M091151
J22
G1230A
R174K
16.2
0.03
Psy-D1
M090628
J20
C4110T
P409L
18
0.04
Psy-A1
M090158
J20
C3201T
Q346*
Psy-A1
M090950
J22
G1224A
W172*
Psy-A1
M091949
J22
C349T
Q117*
a
High PSSM (>10) and low SIFT scores (<0.05) predict mutations with severe effects on protein function. PSSM and SIFT scores are not reported for mutations that
produce premature termination codons
b
The first letter indicates the wild type nucleotide, the number is the position from the start codon, and the last letter is the mutant nucleotide
c
The first letter indicates the wild type amino acid, the number is the position from the methionine, and the last letter is the mutant amino acid
Zhai et al. BMC Plant Biology (2016) 16:228
Fig. 7 Relative yellow pigment content of different mutant genotypes
in F2 populations. F2 populations were derived from homozygous nonsilent (truncation and missense) mutants crossed with corresponding
controls (Jimai 20 or Jimai 22). Data are given as fold measures relative
to wild-type genotypes in each F2 population (set to 1). Five biological
replicates were performed for each comparison and the data are
presented as means ± standard error. Significant differences (Student’s t
test) between homozygotes and heterozygotes for the presence of the
mutation and wild-type genotypes in each F2 population are represented
by one or two asterisks: * P <0.05, ** P <0.01. Hom, homozygous mutants;
Het, heterozygous mutants; WT, wild-type genotypes
determined by qRT-PCR at 7, 14, 21 and 28 DPA (Fig. 8).
In three populations derived from truncation mutations in
Psy-A1 (M090158, M090950 and M091949), Psy-A1 expression levels in homozygous mutants were reduced to
11–48 % compared to wild-type sibs during grain development. Compensatory responses from the B and D subgenomes were found to begin at 14 or 21 DPA. For two
populations derived from missense mutations in Psy-A1
(M091151 and M090122), the Psy-A1 expression levels in
homozygous mutants were more than 33 % of that in
wild-type plants, and the compensatory response began at
14 or 28 DPA. For the population derived from the missense mutation in Psy-D1 of M091217, the expression
profiles of Psy1 and its homoeologs in homozygous mutants were significantly higher than that of wild-type genotypes during all grain development, except for 21 DPA.
Based on the NCBI’s CDD, four characteristic domains
were identified in PSY1 protein including aspartate rich regions (DXXXD; substrate-Mg2+-binding sites), a substrate
binding pocket, catalytic residues, and active site lid residues (Fig. 9). For three missense mutations significantly influencing YPC and gene expression, the mutation sites of
M090122 (V171I) and M091151 (R174K) were adjacent to
the 177DXXXD181 domain, and the mutation in M091217
(R309K) was close to the 302DXXXD306 domain. Threedimensional structure analysis showed that the mutation
site of M091217 was located at the entrance of the substrate binding pocket in the PSY-D1 protein (Fig. 10).
Alternative splicing
The cDNA of grains from homozygous mutants
M090122 and M092201 and wild type were amplified
Page 9 of 15
and sequenced to investigate the impact of the mutations
on pre-mRNA splicing. PCR results for M090122 revealed two products of different size, compared to only
the smaller one in wild type individuals (Fig. 11).
Sequences of the two transcripts showed that the larger
product included a 25 bp fragment of intron II, that
resulted in a frame-shift mutation causing a premature
termination codon at position 226 (data not shown); the
smaller fragment was the constitutive transcript. The
M092201 mutant did not produce alternative splicing
compared to wild type.
Discussion
Psy1-specific silencing
RNAi is a sequence-specific gene suppression system.
Previous studies indicated that nucleotide identity
between the trigger fragment and target gene is crucial
for successful gene silencing by RNAi [33]. It has been
suggested that effective gene silencing in higher plants
requires 88–100 % nucleotide identity, and 81 % or less
nucleotide identities are generally not sufficient for inducing strong and specific gene silencing [34]. In addition,
the presence of a continuous stretch of similarity covering at least 21 identical nucleotides between the trigger
fragment and target gene is required, although it may not
always be sufficient for efficient gene silencing [35, 36]. In
this study, the first exon of Psy-A1 (460 bp) was selected
as the trigger fragment; it shares 90 % and 95 % nucleotide
identity with Psy-B1 and Psy-D1, respectively. Additionally, there were also six contiguous stretches of identical
nucleotides longer than 21 nt. As expected, all three Psy1
homoeologs were simultaneously silenced, which was
proven by RNA-seq (Additional file 7: Table S7).
In grasses, PSY are encoded by three paralogous genes
(Psy1-3). The Psy1, Psy2 and Psy3 genes were located to
the group 7, 5 and 5 chromosomes, respectively [37]. To
determine the gene specificity of our RNAi construct,
the sequence similarities among these three genes were
analyzed. Psy3 shared 75.4 % nucleotide identity with
Psy1 within the 460 bp trigger fragment and had no contiguous stretches of identical nucleotides over 16 nt. The
sequence of the target region in Psy2 was not obtained,
but the nucleotide identity in the known region was only
74.4 % compared with Psy1 (data not shown). Therefore,
we inferred that the RNAi construct used in the study
specifically silenced Psy1 expression rather than Psy2
and Psy3. In contrast to Psy1, the RNA-seq revealed that
the expression levels of Psy2 and Psy3 were not significantly different between transgenic lines and controls
(data not shown).
Psy1 expression was not significantly reduced in most
transgenic lines at 7 DPA, (Fig. 3), because the Bx17
hardly expresses at this stage [38]. In contrast, Psy1 expression level was substantially decreased in all transgenic
Zhai et al. BMC Plant Biology (2016) 16:228
Page 10 of 15
Fig. 8 Expression analysis of Psy1 and its homoeologs in developing grains of three genotypes in each F2 population. a M090158. b M090950.
c M091949. d M090122. e M091151. f M01217. For each genotype, five biological repeats were sampled and pooled for RNA extraction and gene
expression analysis. Transcript levels are given as expression levels relative to the values of wild-type genotypes at 28 DPA (set to 1) after normalization
to β-actin level. Data are presented as means ± standard error from three technical replicates. Significant differences (Student’s t test)
between homozygous and heterozygous mutant individuals and wild-type genotypes in each F2 population are represented by one or
two asterisks: * P <0.05, ** P <0.01. Hom, homozygous mutants; Het, heterozygous mutants; WT, wild-type genotypes
lines at 14 DPA; this might be attributed to the highest expression level of Bx17 and higher expression of Psy1. In
the later developmental stages, the Bx17 expression was
still very high, whereas Psy1 expression was not reduced
distinctly in transgenic lines compared to controls, due to
the low expression level of Psy1 and the basic demand of
carotenoids for normal growth of plants.
The effect of Psy1 down-regulation
Quantitative timing analysis of Psy1 expression showed
that the RNAi effect was the greatest at 14 DPA, generating 54–76 % reductions compared to non-transformed
controls. As expected, all transgenic lines showed significant YPC reductions, confirming the importance of Psy1
for carotenoid accumulation in wheat grains.
In general, plants have the flexibility to cope with
enhancements or reductions of gene products by coordinating the transcriptional regulation network. Pleiotropic effects correlated with up- or down-regulation of
Psy genes were reported previously [39], indicating a
strong correlation between carotenoid biosynthesis and
core metabolism, such as photosynthesis, starch and
sucrose metabolism, glycolysis/gluconeogenesis, and the
citrate cycle [40–42]. In this study, some candidate genes
Zhai et al. BMC Plant Biology (2016) 16:228
Page 11 of 15
Fig. 9 Functional domains of homoeologous PSY1 protein sequences. Amino acid sequences of PSY1 were analyzed using the NCBI’s Conserved
Domain Database. Numbers above the alignment indicate the amino acid positions along the PSY-A1 protein. Framed, aspartate rich regions (DXXXD;
substrate-Mg2+-binding sites); open black circle, substrate binding pocket; filled circle, catalytic residues; line, active site lid residues; blue circle, missense
mutations; red circle, mutations resulting in significant yellow pigment content change, including truncation and missense mutations
involved in secondary metabolic pathways and core
metabolic processes were found to collectively participate in the adaptive process of Psy1 down-regulation
based on RNA-Seq analysis (Fig. 5; Additional file 8:
Table S8). In the carotenoid pathway, except for Psy1
down-regulation, up-regulation of the zeta-carotene
desaturase gene (Zds) might be attributed to feedback
from reduction of downstream products. Some genes
involved in various types of N-glycan biosynthesis,
ubiquinone and other terpenoid-quinone biosynthesis
and diterpenoid biosynthesis, were up-regulated in
transgenic lines. These secondary metabolic pathways
compete for FPP (farnesyl diphosphate) or GGPP (geranylgeranyl pyrophosphate) with carotenoid biosynthesis,
and therefore carotenoid biosynthesis reduction induces
more precursors flow into other pathways. Genes coding
enolase (EC 4.2.1.11), phosphoglycerate kinase (EC
2.7.2.3), glyceraldehyde 3-phosphate dehydrogenase (EC
Fig. 10 Graphical representation of PSY-D1 modeled by SWISS-MODEL. a Model of M091217 (R309K) superimposed with wild type. b Carbon
skeleton of arginine (R) and lysine (K). The alpha helices at the locations of the substrate binding pocket and catalytic site are shown in bright
colors (blue, red, yellow and purple); other helices are in grey. The carbon chain of conserved aspartate in aspartate rich regions (DXXXD) are
shown in red, and the carbon chains of R and K are in blue and yellow, respectively
Zhai et al. BMC Plant Biology (2016) 16:228
Page 12 of 15
Fig. 11 Alternative splicing in the M090122 mutant. a Reverse transcription PCR analysis showing alternative splicing in M090122. b Alignment of
cDNA from homozygous M090122 mutant and DNA sequence of wild type. The sequence traces indicate that the G629A mutation in M090122
caused an alternative splice junction site, located 25 nucleotides downstream of the normal splice junction. Mu, mutagenised line; WT, wild type;
M, molecular weight standard DL2000
1.2.1.12), fructose-bisphosphate aldolase (EC 4.1.2.13)
and triosephosphate isomerase (EC 5.3.1.1) were upregulated, which might favor the flow into gluconeogenesis since transgenic lines needed a lower flux through
and out of the glycolytic pathway for carotenoid biosynthesis. Enhancement of storage reserves synthesis, such
as fructose and mannose metabolism and starch and
sucrose metabolism, also proved this point. Additionally,
enhanced gluconeogenesis further induced photosynthesis, carbon fixation in photosynthetic organisms and
citrate cycle. These previously unrecognized YPCrelated-genes in core metabolism established a broader
basis for the molecular regulating carotenoid biosynthesis in wheat grains.
Dissection of Psy1 by TILLING
TILLING is a flexible strategy for exploring gene function and regulation, producing large series of mutated alleles that may affect protein function and generate
partial phenotypic changes or intermediate expression of
target genes. In this study, 29 non-silent (truncation and
missense) mutations in Psy1 genes in common wheat
were identified, providing a resource not only for functional analysis, but also for understanding the importance of different amino acids and regions regulating the
protein function, as well as to study compensatory
responses.
The severity of each non-silent mutation was predicted
by PARSESNP and SIFT, and YPC in each F2 population
was measured. However, severity prediction was not
always consistent with changes in phenotype. For example, the mutation in M090628 was predicted to have
a severe effect on protein function, whereas it showed
no significant phenotypic change. This might indicate
that the conserved sequence had no direct role in
controlling enzyme activity, since PARSESNP and SIFT
do not account for active or conserved domains, but
make predictions based on amino acid conservation and
properties after an alignment search in the protein
sequence database [30, 31].
Compared with missense mutations in Psy-A1, three
truncation mutations showed stronger effects on Psy-A1
expression by reducing Psy-A1 transcript levels in homozygous mutants to 11–48 % of that in wild-type genotypes during whole grain development (Fig. 8). These
reductions might be due to a quality control mechanism
preventing accumulation of non-functional or deleterious truncated proteins, known as Nonsense Mediated
mRNA Decay [43]. In wheat, significantly reduced RNA
levels have also been reported for multiple genes
containing premature termination codon mutations such
as HMW glutenin subunit [44], waxy gene [45], and
polyphenol oxidase gene [46].
TILLING is an efficient method to identify mutations
in genes of interest, but the mutant effect is often
masked by the presence of multiple copies of the same
genes in polyploids, such as common wheat. In this
study, the expression levels of three homoeologs were
measured to study compensatory processes. Unexpectedly, the expression of all three Psy1 homoeologs was
significantly reduced or increased together at 7 DPA,
except for Psy-B1 in M091949 and M091217 (Fig. 8). In
three truncation mutants, the compensatory responses
from B and D homoelogs started at 14 DPA for
M090158 and M090950 and at 21 DPA for M091949.
For missense mutations in M091151 and M090122, the
compensatory response began at 14 and 28 DPA, respectively. One possible reason for these phenomena
was that the expression of all three Psy1 homoeologs is
coordinately regulated under normal conditions, but
separately regulated under stress. Furthermore, we inferred that 14 DPA was an important stage for Psy1
expression regulation during wheat grain development
because most compensatory responses started at this
stage. More detailed investigations are needed to
substantiate these hypotheses. Compared with Psy-B1,
the expression level of Psy-A1 and Psy-D1 showed more
distinct changes, and it seems that they were more sensitive to expression regulation. RNA-seq data also showed
that the order of down-regulation level among three
homoeologs was Psy-D1 > Psy-A1 > Psy-B1 in transgenic
lines (Additional file 7: Table S7).
The nucleotide change (G3609A) in M091217 resulted in
substitution of arginine by lysine at position 309 (R309K).
Zhai et al. BMC Plant Biology (2016) 16:228
The three-dimensional structure of PSY1 showed that this
mutation was adjacent to the entrance of the substrate
binding pocket in the PSY-D1 protein, and was possibly
easier for substrate binding due to a shorter carbon chain
(R to K) resulting in increased carotenoid accumulation
(Fig. 10). This mutation might coordinately induce expression of all three Psy1 homoeologs, although Psy-B1 showed
less changes (Fig. 8). Mutations in gene coding regions have
potential to alter plant metabolism in ways other than
changing the level of target gene products. For example, a
mutated site may change the enzyme-substrate affinity,
alter enzyme regulatory domains, or interfere with proper
subunit or other protein-protein interactions. The aspartate
rich region DXXXD is a conserved domain within isoprenoid synthases and forms an active site to bind phosphate
groups of a substrate [47]. In this study, all missense mutants with severe effects on YPC were close to the DXXXD
domain, indicating that these regions are very important for
PSY1 function. Previous studies showed that sequence variations affecting the catalytic efficiency of the PSY enzyme
were as subtle as a single amino acid [48]. Therefore, we
infer that these mutations may affect the affinity of PSY1
for phosphate groups of a substrate and further influence
carotenoid accumulation.
Alternative splicing
Sequencing analysis of cDNA indicated that the G629A
mutation in M090122 caused an alternative splice junction site, located 25 nucleotides downstream of the
normal splice junction (Fig. 11). This mechanism was
previously reported in plants and explained by local
scanning of the spliceosome to select the best intron
splice site based on sequence context [49]. The mutation
resulted in a frame shift and a premature termination
codon at position 226. We assume that the alternative
splicing in M090122 might decrease the content of functional PSY1 protein and further reduce carotenoid biosynthesis. Alternative splicing of Psy1 regulating enzyme
activity and carotenoid accumulation was also reported
in wheat and Hordeum chilense [50, 51].
Molecular breeding
Mutants identified by TILLING are not involved in genetic modification and can be introduced into breeding
programs. The use of mutagenesis in plant breeding is
generally considered to have contributed to the release of
more than 2,250 crop cultivars with improved yield and
quality traits [52]. Therefore, mutants identified in this
study will be useful as breeding germplasm for wheat
quality improvement. For example, mutants M090158,
M090950, M091949 and M090122 with significantly reduced YPC could be used in improvement of wheat genotypes for Chinese style foods such as steamed bread and
white Chinese noodles where a bright whiteness is
Page 13 of 15
preferred. Meanwhile, M091217 with higher YPC could
be useful for improving nutrition because carotenoids are
important for human health. Furthermore, these mutants
come from elite wheat cultivars Jimai 20 or Jimai 22 and
are potentially useful without further pre-breeding to
remove undesirable agronomic traits.
Conclusion
The Psy1 function and genetic regulation in common
wheat were extensively analyzed using a complementary
reverse genetics approach. The RNAi-mediated downregulation of Psy1 resulted in remarkable reduction in
YPC, confirming the important impact of Psy1 on carotenoid accumulation in wheat grains. Based on RNA-Seq and
bioinformatics analysis, a series of candidate genes involved in both core metabolic processes and secondary
metabolic pathways communicated and worked collaboratively to adapt to the Psy1 down-regulation. The TILLING
identified a suite of mutations in Psy1 and provided a more
in-depth insight into the gene function, genetic regulation,
structure-function relationship, as well as the compensatory response. The aspartate rich region DXXXD, a conserved domain among isoprenoid synthases, was identified
as an important region influencing PSY1 function in
wheat, and conserved nucleotides adjacent to the domain
influenced YPC by regulating gene expression, enzyme
activity or alternative splicing. Moreover, the compensatory response played a vital role in gene expression during
gain development and 14 DPA was considered as a key
regulation node. The findings achieved in the present
study would be helpful to further disclose the molecular
basis and genetic regulation of carotenoid synthesis in
wheat grains and could eventually facilitate the genetic improvement of wheat quality in the future.
Additional files
Additional file 1: Table S1. Primers used for the RNAi vector
construction and positive transgenic line detection. (DOCX 16.7 kb)
Additional file 2: Table S2. Culture media used in this study for callus
induction and differentiation. (DOCX 16.7 kb)
Additional file 3: Table S3. Primers developed for qRT-PCR analysis.
(DOCX 17.5 kb)
Additional file 4: Table S4. Homoeolog-specific primers developed for
mutation detection by TILLING. (DOCX 17.9 kb)
Additional file 5: Table S5. Primers designed for the detection of
alternative splicing. (DOCX 16.6 kb)
Additional file 6: Table S6. Transcriptome details for three transgenic
lines with the most significantly reduced YPC and non-transformed
controls. (DOCX 18 kb)
Additional file 7: Table S7. Details of the differentially expressed genes
(DEGs) consistent in all three transgenic lines. (XLSX 82.6 kb)
Additional file 8: Table S8. Major metabolic pathways and candidate
genes associated with Psy1 down-regulation. (XLSX 10.1 kb)
Additional file 9: Table S9. Summary of silent mutations in Psy1
identified by TILLING. (XLSX 11.7 kb)
Zhai et al. BMC Plant Biology (2016) 16:228
Abbreviations
DEGs: Differentially expressed genes; DPA: Days post anthesis; EMS: Ethyl
methanesulfonate; GFP: Green fluorescent protein; GO: Gene ontology;
NCBI: National Center for Biotechnology Information; PARSESNP: Project
Aligned Related Sequences and Evaluate SNPs; Psy1: Phytoene synthase 1;
qRT-PCR: Quantitative real-time PCR; RNAi: RNA interference; RNA-Seq: RNA
sequencing; SIFT: Sorting Intolerant from Tolerant; TILLING: Targeting
Induced Local Lesions IN Genomes; YPC: Yellow pigment content
Page 14 of 15
5.
6.
7.
8.
Acknowledgements
We thank Prof. R. A. McIntosh, Plant Breeding Institute, University of Sydney,
for reviewing this manuscript.
Funding
This work was funded by the National Natural Science Foundation of China
(31461143021, 31260327, 31371623), Gene Transformation Projects
(2016ZX08009-003, 2016ZX08002003-003), Beijing Municipal Science and
Technology Project (D151100004415003), and National Key Project
(2016YFD0101802).
Availability of data and material
Details of the differentially expressed genes (DEGs) consistent in all three
transgenic lines at Additional file 7: Table S7.
Data information for candidate genes and metabolic pathways associated
with Psy1 down-regulation at Additional file 8: Table S8.
Data for mutations in Psy1 identified by TILLING at Table 1 and Additional
file 9: Table S9.
Authors’ contributions
SNZ performed the experiment and wrote the paper. GYL, GQS and YLL
constructed the RNAi transgenic lines. JMS developed the EMS-mutagenised
populations. YWS, JHL and HQL did the field trials. ZHH and XCX designed
the experiment and wrote the paper. All authors read and approved the final
manuscript.
9.
10.
11.
12.
13.
14.
15.
16.
Competing interests
The authors declare that they have no conflict of interest.
Consent for publication
Not applicable.
17.
Ethics approval and consent to participate
Not applicable.
18.
19.
Author details
1
Institute of Crop Science, National Wheat Improvement Center, Chinese
Academy of Agricultural Sciences (CAAS), 12 Zhongguancun South Street,
Beijing 100081, China. 2Crop Research Institute, Shandong Academy of
Agricultural Sciences, 202 Gongye Bei Road, Jinan, Shandong 250100, China.
3
State Key Laboratory of Plant Cell and Chromosome Engineering, Institute
of Genetics and Developmental Biology, Chinese Academy of Sciences,
Beijing 100101, China. 4International Maize and Wheat Improvement Center
(CIMMYT) China Office, c/o CAAS, 12 Zhongguancun South Street, Beijing
100081, China.
20.
21.
22.
Received: 8 July 2016 Accepted: 6 October 2016
23.
References
1. Cuttriss AJ, Cazzonelli CI, Wurtzel ET, Pogson BJ. Carotenoids. In: Rébeillé F,
Douce R, editors. Biosynthesis of Vitamins in Plants. Amsterdam: Elsevier;
2011. p. 1–36.
2. Yeum KJ, Russell RM. Carotenoid bioavailability and bioconversion. Annu
Rev Nutr. 2002;22:483–504.
3. Harjes CE, Rocheford TR, Bai L, Brutnell TP, Kandianis CB, Sowinski SG,
Stapleton AE, Vallabhaneni R, Williams M, Wurtzel ET, Yan JB, Buckler ES.
Natural genetic variation in lycopene epsilon cyclase tapped for maize
biofortification. Science. 2008;319:330–3.
4. Fraser PD, Bramley PM. The biosynthesis and nutritional uses of carotenoids.
Prog Lipid Res. 2004;43:228–65.
24.
25.
26.
27.
Baublis A, Decker EA, Clydesdale FM. Antioxidant effect of aqueous extracts
from wheat based ready-to-eat breakfast cereals. Food Chem. 2000;68:1–6.
Zhang W, Dubcovsky J. Association between allelic variation at the phytoene
synthase 1 gene and yellow pigment content in the wheat grain. Theor
Appl Genet. 2008;116:635–45.
Gallagher CE, Matthews PD, Li F, Wurtzel ET. Gene duplication in the
carotenoid biosynthetic pathway preceded evolution of the grasses. Plant
Physiol. 2004;135:1776–83.
Li F, Vallabhaneni R, Wurtzel ET. PSY3, a new member of the phytoene
synthase gene family conserved in the Poaceae and regulator of abiotic
stress-induced root carotenogenesis. Plant Physiol. 2008;146:1333–45.
He XY, Zhang YL, He ZH, Wu YP, Xiao YG, Ma CX, Xia XC.
Characterization of phytoene synthase 1 gene (Psy1) located on
common wheat chromosome 7A and development of a functional
marker. Theor Appl Genet. 2008;116:213–21.
Flavell RB, Bennett MD, Smith JB, Smith DB. Genome size and proportion of
repeated nucleotide sequence DNA in plants. Biochem Genet. 1974;12:257–69.
Lawrence RJ, Pikaard CS. Transgene-induced RNA interference: a strategy for
overcoming gene redundancy in polyploids to generate loss-of-function
mutations. Plant J. 2003;36:114–21.
Travella S, Klimm TE, Keller B. RNA interference-based gene silencing as an
efficient tool for functional genomics in hexaploid bread wheat. Plant
Physiol. 2006;142:6–20.
Sestili F, Janni M, Doherty A, Botticella E, D’Ovidio R, Masci S, Jones HD,
Lafiandra D. Increasing the amylose content of durum wheat through
silencing of the SBEIIa genes. BMC Plant Biol. 2010;10:144.
Becker D, Wieser H, Koehler P, Folck A, Mühling KH, Zörb C. Protein
composition and techno-functional properties of transgenic wheat with
reduced α-gliadin content obtained by RNA interference. J Appl Bot Food
Qual. 2012;85:23.
Dong ZY, Feng B, Liang H, Rong CW, Zhang KP, Cao XM, Qin HJ, Liu X,
Wang T, Wang DW. Grain-specific reduction in lipoxygenase activity
improves flour color quality and seed longevity in common wheat. Mol
Breeding. 2015;35:150.
Bleeker PM, Spyropoulou EA, Diergaarde PJ, Volpin H, De Both MTJ, Zerbe P,
Bohlmann J, Falara V, Matsuba Y, Pichersky E, Haring MA, Schuurink RC.
RNA-seq discovery, functional characterization, and comparison of
sesquiterpene synthases from Solanum lycopersicum and Solanum
habrochaites trichomes. Plant Mol Biol. 2011;77:323–36.
Slade AJ, Fuerstenberg SI, Loeffler D, Steine MN, Facciotti D. A reverse
genetic, nontransgenic approach to wheat crop improvement by TILLING.
Nat Biotechnol. 2005;23:75–81.
Stemple DL. TILLING–a high-throughput harvest for functional genomics.
Nat Rev Genet. 2004;5:145–50.
Nadolska-Orczyk A, Przetakiewicz A, Kopera K, Binka A, Orczyk W. Efficient
method of Agrobacterium-mediated transformation for triticale (X.
Triticosecale Wittmack). J. Plant Growth Regul. 2005;24:2–10.
Livak KJ, Schmittgen TD. Analysis of relative gene expression data using
real-time quantitative PCR and the 2−ΔΔCT Method. Methods. 2001;25:
402–8.
Zhai SN, He ZH, Wen WE, Jin H, Liu JD, Zhang Y, Liu ZY, Xia XC. Genomewide linkage mapping of flour color-related traits and polyphenol oxidase
activity in common wheat. Theor Appl Genet. 2016;129:377–94.
Zhou XH, Wang K, Lv DW, Wu CJ, Li JR, Zhao P, Lin ZS, Du LP, Yan YM,
Ye XG. Global analysis of differentially expressed genes and proteins in
the wheat callus infected by Agrobacterium tumefaciens. PLoS ONE.
2013;8:e79390.
Li H, Durbin R. Fast and accurate short read alignment with BurrowsWheeler transform. Bioinformatics. 2009;25:1754–60.
Langmead B, Trapnell C, Pop M, Salzber SL. Ultrafast and memory-efficient
alignment of short DNA sequences to the human genome. Genome Biol.
2009;10:25–34.
Li B, Dewey CN. RSEM: accurate transcript quantification from RNA-Seq data
with or without a reference genome. BMC Bioinformatics. 2011;12:323.
Ye J, Fang L, Zheng HK, Zhang Y, Chen J, Zhang ZJ, Wang J, Li ST, Li RQ,
Bolund L, Wang J. WEGO: a web tool for plotting GO annotations. Nucleic
Acids Res. 2006;34:293–7.
Zhang Y, Su J, Duan S, Ao Y, Dai JR, Liu J, Wang P, Li YG, Liu B, Feng DR,
Wang JF, Wang HB. A highly efficient rice green tissue protoplast system for
transient gene expression and studying light/chloroplast-related processes.
Plant Methods. 2011;7:30–8.
Zhai et al. BMC Plant Biology (2016) 16:228
28. Yoo SD, Cho YH, Sheen J. Arabidopsis mesophyll protoplasts: a versatile cell
system for transient gene expression analysis. Nat Protoc. 2007;2:1565–72.
29. Uauy C, Paraiso F, Colasuonno P, Tran RK, Tsai H, Berardi S, Comai L,
Dubcovsky J. A modified TILLING approach to detect induced mutations in
tetraploid and hexaploid wheat. BMC Plant Biol. 2009;9:115.
30. Ng PC, Henikoff S. SIFT: predicting amino acid changes that affect protein
function. Nucleic Acids Res. 2003;31:3812–4.
31. Taylor NE, Greene EA. PARSESNP: a tool for the analysis of nucleotide
polymorphisms. Nucleic Acids Res. 2003;31:3808–11.
32. Slade AJ, McGuire C, Loeffler D, Mullenberg J, Skinner W, Fazio G, Holm A,
Brandt KM, Steine MN, Goodstal JF. Development of high amylose wheat
through TILLING. BMC Plant Biol. 2012;12:69.
33. Wesley SV, Helliwell CA, Smith NA, Wang MB, Rouse DT, Liu Q, Gooding PS,
Singh SP, Abbott D, Stoutjesdijk PA, Robinson SP, Gleave AP, Green AG, et
al. Construct design for efficient, effective and high-throughput gene
silencing in plants. Plant J. 2001;27:581–90.
34. Holzberg S, Brosio P, Gross C, Pogue GP. Barley stripe mosaic virus induced
gene silencing in a monocot plant. Plant J. 2002;30:315–27.
35. Miki D, Itoh R, Shimamoto K. RNA silencing of single and multiple members
in a gene family of rice. Plant Physiol. 2005;138:1903–13.
36. McGinnis K, Murphy N, Carlson AR, Akula A, Akula C, Basinger H, Carlson M,
Hermanson P, Kovacevic N, McGill MA, Seshadri V, Yoyokie J, Cone K, et al.
Assessing the efficiency of RNA interference for maize functional genomics.
Plant Physiol. 2007;143:1441–51.
37. Dibari B, Murat F, Chosson A, Gautier V, Poncet C, Lecomte P, Mercier I,
Bergès H, Pont C, Blanco A, Salse J. Deciphering the genomic structure,
function and evolution of carotenogenesis related phytoene synthases in
grasses. BMC Genomics. 2012;13:221.
38. Shewry PR, Underwood C, Wan YF, Lovegrove A, Bhandari D, Toole G, Mills
ENC, Denyer K, Mitchell RAC. Storage product synthesis and accumulation
in developing grains of wheat. J Cereal Sci. 2009;50:106–12.
39. Decourcelle M, Perez-Fons L, Baulande S, Steiger S, Couvelard L, Hem S, Zhu
CF, Capell T, Christou P, Fraser P. Combined transcript, proteome, and
metabolite analysis of transgenic maize seeds engineered for enhanced
carotenoid synthesis reveals pleotropic effects in core metabolism. J Exp
Bot. 2015;66:3141–50.
40. Xu Q, Yu KQ, Zhu AD, Ye JL, Liu Q, Zhang JC, Deng XX. Comparative
transcripts profiling reveals new insight into molecular processes regulating
lycopene accumulation in a sweet orange (Citrus sinensis) red-flesh mutant.
BMC Genomics. 2009;10:540.
41. Enfissi EMA, Barneche F, Ahmed I, Lichtlé C, Gerrish C, McQuinn RP,
Giovannoni JJ, Lopez-Juez E, Bowler C, Bramley PM. Integrative transcript
and metabolite analysis of nutritionally enhanced DE-ETIOLATED1
downregulated tomato fruit. Plant Cell. 2010;22:1190–215.
42. Pan ZY, Zeng YL, An JY, Ye JL, Xu Q, Deng XX. An integrative analysis of
transcriptome and proteome provides new insights into carotenoid
biosynthesis and regulation in sweet orange fruits. J Proteomics. 2012;75:
2670–84.
43. Baker KE, Parker R. Nonsense-mediated mRNA decay: terminating erroneous
gene expression. Curr Opin Cell Biol. 2004;16:293–9.
44. Zhu Y, Li Y, Chen Y, Li H, Liang H, Yue S, Zhang A, Zhang X, Wang D,
Jia X. Generation and characterization of a high molecular weight
glutenin 1Bx14-deficient mutant in common wheat. Plant Breed.
2005;124:421–7.
45. Saito M, Nakamura T. Two point mutations identified in emmer wheat
generate null Wx-A1 alleles. Theor Appl Genet. 2005;110:276–82.
46. Sun YW, He ZH, Ma WJ, Xia XC. Alternative splicing in the coding
region of Ppo-A1 directly influences the polyphenol oxidase activity in
common wheat (Triticum aestivum L.). Funct. Integr. Genomic.
2011;11:85–93.
47. Pandit J, Danley DE, Schulte GK, Mazzalupo S, Pauly TA, Hayward CM,
Hamanaka ES, Thompson JF, Harwood Jr HJ. Crystal structure of human
squalene synthase A key enzyme in cholesterol biosynthesis. J Biol Chem.
2000;275:30610–7.
48. Welsch R, Arango J, Bär C, Salazar B, Al-Babili S, Beltrán J, Chavarriaga P,
Ceballos H, Tohme J, Beyer P. Provitamin A accumulation in cassava
(Manihot esculenta) roots driven by a single nucleotide polymorphism in a
phytoene synthase gene. Plant Cell. 2010;22:3348–56.
49. Smith CJW, Chu TT, Nadal-Ginard B. Scanning and competition between
AGs are involved in 3′ splice site selection in mammalian introns. Mol Cell
Biol. 1993;13:4939–52.
Page 15 of 15
50. Howitt CA, Cavanagh CR, Bowerman AF, Cazzonelli C, Rampling L, Mimica
JL, Pogson BJ. Alternative splicing, activation of cryptic exons and amino
acid substitutions in carotenoid biosynthetic genes are associated with
lutein accumulation in wheat endosperm. Funct Integr Genomic. 2009;9:
363–76.
51. Rodríguez-Suárez C, Atienza SG, Pistón F. Allelic variation, alternative splicing
and expression analysis of Psy1 gene in Hordeum chilense Roem. et Schult.
PLoS ONE. 2011;6:e19885.
52. Ahloowalia BS, Maluszynski M, Nichterlein K. Global impact of mutationderived varieties. Euphytica. 2004;135:187–204.
Submit your next manuscript to BioMed Central
and we will help you at every step:
• We accept pre-submission inquiries
• Our selector tool helps you to find the most relevant journal
• We provide round the clock customer support
• Convenient online submission
• Thorough peer review
• Inclusion in PubMed and all major indexing services
• Maximum visibility for your research
Submit your manuscript at
www.biomedcentral.com/submit