Association of SSR markers with functional traits from heat stress in diverse tall fescue accessions
Bạn đang xem bản rút gọn của tài liệu. Xem và tải ngay bản đầy đủ của tài liệu tại đây (1.1 MB, 13 trang )
Sun et al. BMC Plant Biology (2015) 15:116
DOI 10.1186/s12870-015-0494-5
RESEARCH ARTICLE
Open Access
Association of SSR markers with functional traits
from heat stress in diverse tall fescue accessions
Xiaoyan Sun1,2, Zhimin Du1, Jin Ren1, Erick Amombo1, Tao Hu1* and Jinmin Fu1*
Abstract
Background: Heat stress is a critical threat to tall fescue in transitional and warm climate zones. Identification of
association between molecular markers and heat tolerance-related functional traits would promote the efficient
selection of heat tolerant tall fescue cultivars. Association analysis of heat tolerance-related traits was conducted in
100 diverse tall fescue accessions consisting of 93 natural genotypes originating from 33 countries and 7 turf-type
commercial cultivars.
Results: The panel displayed significant genetic variations in growth rate (GR), turfgrass quality (TQ), survival rate
(SR), chlorophyll content (CHL) and evapotranspiration rate (ET) in greenhouse and growth chamber trials. Two
subpopulations were detected in the panel of accessions by 1010 SSR alleles with 90 SSR markers, but no obvious
relative kinship was observed. 97 and 67 marker alleles associated with heat tolerance-related traits were identified
in greenhouse trial and growth chamber trial (P < 0.01) using mix linear model, respectively. Due to different
experimental conditions of the two trials, 2 SSR marker alleles associated with GR and ET were simultaneously
identified at P < 0.01 level in two trials in response to heat stress.
Conclusion: High-temperature induced great variations of functional traits in tall fescue accessions. And the
identified marker alleles associated with functional traits could provide important information about heat tolerance
genetic pathways, and be used for molecular assisted breeding to enhance tall fescue performance under heat
stress.
Keywords: Association mapping, Tall fescue, Population structure, High-temperature stress, Functional traits
Background
Tall fescue (Festuca arundinacea Schreb.) is a major
cool-season grass species from the family Poaceae.
Native to Northern Europe, North Africa, Middle East,
Central Asia, and Siberia, tall fescue is most widely utilized as forage and turfgrass attributed to its adaptability,
yield, persistence, and other ecosystem services such as
soil improvement, recreation, protection, and carbon sequestration. Tall fescue is a self-incompatible allohexaploid (2n = 6x = 42) out-crossing species containing three
genomes (P, G1, and G2) with a genome size of approximately 5.27-5.83 × 10⁶ kb [1].
Heat stress limits the growth and development of tall
fescue in transitional and warm climatic regions. High
* Correspondence: ;
1
Key Laboratory of Plant Germplasm Enhancement and Specialty Agriculture,
Wuhan Botanical Garden, Chinese Academy of Science, Wuhan 430074Hubei,
P.R. China
Full list of author information is available at the end of the article
summer temperature of 30 to 35°C could constrain
growth, reduce turf quality, induce leaf withering, and
inhibit photosynthesis [2], which would pose severe
effects on global climate change. While effective agronomic
measures, including heat acclimation, soil temperature reduction, and growth regulators application, could enhance
heat tolerance of tall fescue. Heat tolerant cultivars would
be key alternative in alleviation of the negative influences
of abiotic stress on plant breeding programs [3]. However,
plant heat tolerance is a complex quantitative trait, involving multiple regulatory mechanisms, signal transduction
pathways, and metabolic pathways. Therefore, a study on
genetic and molecular basis for heat tolerance in plants
would be necessary. Detailed study in plant physiological
responses to heat stress and identification of molecular
markers linked to heat tolerance would enhance the efficiency of traditional breeding programs to developing heat
tolerant cultivars.
© 2015 Sun et al.; licensee BioMed Central. This is an Open Access article distributed under the terms of the Creative
Commons Attribution License ( which permits unrestricted use, distribution, and
reproduction in any medium, provided the original work is properly credited. The Creative Commons Public Domain
Dedication waiver ( applies to the data made available in this article,
unless otherwise stated.
Sun et al. BMC Plant Biology (2015) 15:116
The quantitative inheritances of heat tolerance and
interaction between gene expression and environment
make challenges to our knowledge of genetic basis of
heat tolerant traits of plant. During last two decades,
molecular marker has applied to insight into complex
traits in plant. Many studies on quantitative trait locus
(QTLs) mapping have been conducted to dissect numerous vital agronomical and morphological traits under
abiotic stress. The results have improved the efficiency
of conventional crop breeding via marker-assisted selection (MAS) in some crop species e.g. rice, maize, barley,
soybean, and chickpea [4-8]. However, many linkage
mapping based on QTLs studies presented modest and
unreliable results due to several factors. First, mappingbased cloning of QTL is time-consuming and costly for
construction of populations. Secondly, the restricted
number of recombination events per chromosome during mapping population development limits the resolution of genetic map [9]. In addition, QTL mapping
could not exploit the extensive genetic variation of natural germplasm resources. On the contrary, association
mapping could exploit all recombination events and mutations including historical and evolutionary recombination in natural populations with unobserved ancestry
[10]. Association mapping has been widely applied to
explore the genetic basis of complex quantitative traits
in plant species, and reported under favorable conditions
like drought [11-14]. For example, a candidate gene,
ZmDREB2.7 associated with drought stress, was identified to be effective in imparting plant tolerance to
drought stress in maize [13]. In turfgrass species, a few
studies on association mapping have been carried out
involving flowering time, leaf length, submergence tolerance, salinity tolerance, and drought tolerance in perennial
ryegrass [15-17]. Four single nucleotide polymorphisms
from LpLEA3, LpFsSOD, and Cu-ZnSOD have been associated with drought tolerance traits in diverse perennial
ryegrass accessions [14]. However, there was limited information on the association between marker genes and heat
tolerance of plants [8].
Simple sequence repeats (SSRs) or microsatellites are
widely distributed in all eukaryotic genomes. They are
powerful tools for dissecting cultivar fingerprinting, genetic diversity assessment, evolutionary study, linkage
map construction, and marker assisted breeding [18-20].
Alternatively, the SSR markers were developed for allohexaploid tall fescue, an out-crossing species with high
intra-specific polymorphism, utilized for genomic mapping, identification of variety, population genetic analysis
and diversity evaluation of germplasm [21-25]. Recently,
SSR markers have been applied in trait and marker association of plants, such as kernel size and milling quality
in wheat [26], oil, starch, and protein concentration in
maize [27], submergence tolerance in perennial ryegrass
Page 2 of 13
[17]. However, the application of association mapping in
detecting links between markers with functional traits
such as heat tolerance in tall fescue is undocumented.
The objective of this study was to identify marker-trait
associations for phenotypic and physiological traits
under heat conditions. It was hypothesized that tall fescue accessions had high diversity in high temperature response and the population structure would influence
individual functional traits associated with heat tolerance. A set of 100 diverse tall fescue accessions originating from different geographical regions was grown in
two heat environmental conditions in the greenhouse
and controlled growth chambers. The population structure, relative pairwise kinship, and marker-trait association (MTA) by mixed linear model were statistically
analyzed based on SSR markers.
Results
Heat stress effects and functional traits variation
In tall fescue heat stress imposed leaf yellowing and wilting, limited plant growth, and even death. Turfgrass quality (TQ), survival rate (SR), chlorophyll content (CHL),
and growth rate (GR) decreased with prolonged heat
stress in both trials, but the severity of decline varied with
accession and duration. Significant accession and treatment time effects under heat stress were observed on GR,
TQ, CHL, and SR in both trials (Table 1). However, no
significant time effect for evapotranspiration rate (ET) in
growth chamber trial was detected. There was also no significant interaction effect for functional traits between
grass accessions and treatment time.
With prolonged heat stress at 1-3 weeks, the mean,
maximum, and minimum values decreased in two trials
(Table 2). Under heat stress, the average growth rate decreased from 0.24 g d-1 at initial time to 0.05 g d-1 at 14
WOT, turfgrass quality reduced from 6.55 to 2.56, survival
rate decreased from 99.65% to 46.66%, chlorophyll content
decreased from 2.35 mg g-1 FW to 1.47 mg g-1 FW, and
evapotranspiration rate decreased from 61.55 g d-1 to
10.64 g d-1, respectively in greenhouse trial. Most of the
functional traits decreased except for ET, which increased
after one week of stress treatment, and then drastically
dropped. In growth chamber trial, all functional traits displayed similar trend, whereby the average GR dropped
from 0.11 g d-1 at initial time to 0.03 g d-1 at two WOT,
TQ from 7.50 to 3.01, SR from 99.75% to 52.50%, CHLT
from 2.03 mg g-1 FW to 1.77 mg g-1 FW, and ET from
22.82 g d-1 to 18.93 g d-1, respectively. After two weeks,
heat stress significantly reduced GR by 79.17% in greenhouse and 72.73% in growth chamber trials compared with
their relative controls (the time before heat stress). The decline levels of TQ, SR, and ET were lower than that of GR.
Significant correlations between survival rate with
evapotranspiration rate, turfgrass quality, and turfgrass
Sun et al. BMC Plant Biology (2015) 15:116
Page 3 of 13
Table 1 Mean squares of variance for evapotranspiration rate (ET), growth rate (GR), turf quality (TQ), chlorophyll
content (CHL), and survival rate (SR) of 100 tall fescue accessions on different times of heat treatment
Sources
Greenhouse trial
Growth chamber trial
ET
GR
TQ
CHL
SR
ET
GR
TQ
CHL
SR
Accession (A)
1725.3**
1828.9**
755.5**
519.5**
578.7**
10693.3**
17087.7**
1313.1**
2127.2**
1135.2**
Time (T)
2229801.4**
189804.5**
128139.4**
30165.8**
57682.3**
7400.5ns
299505.0**
73169.6**
29394.0**
96450.8**
ns
2214.4ns
3555.4ns
168.3ns
731.3ns
161.2ns
ns
A*T
ns
483.5
453.8
**mean significant at P < 0.01, and
ns
ns
111.3
166.0
ns
90.2
mean no significant.
quality with evapotranspiration rate were found at two
time of heat stress that the values had been standard to
relative control in greenhouse trial, and relative values of
SR of two weeks under heat stress had significant relationship with chlorophyll content (Table 3). Meanwhile,
there were significant correlations between turfgrass
quality with GR, CHL, ET and SR in growth chamber
trail. There was significant correlation between CHL and
SR, ET and GR, however there was no relationship between ET and SR in growth chamber trail (Table 4).
High correlations were identified for all functional traits
between the two sample times under heat stress in
both trials, with the highest correlation for ET (r = 0.86,
P < 0.01) in greenhouse trial, and SR (r = 0.768, P < 0.01)
in growth chamber trial.
Population structure, relative kinship
A total of 1010 SSR alleles were amplified from 90
SSR markers by genotyping 100 tall fescue accessions
(Additional file 1 Table S1). The allele numbers of SSR
marker varied from 3 to 27 alleles per marker with an
average of 11.22 alleles per locus. For the co-dominant
SSR marker transit to dominant marker in this study,
the genetic diversity of the 100 tall fescue accessions
was at a relative lower level, in which average of Nei’s
genetic diversity was 0.255, and average of polymorphism information content was 0.211.
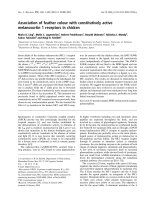
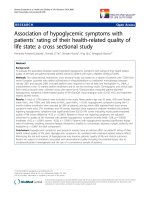
According to STRUCTURE analysis results based on
Bayesian clustering approach model, a significant population structure was detected among the 100 accessions.
The results were consistent with those from the preliminary runs, in which the average probability of the data
likelihoods for the population structure in the panel
of accessions were increased following the increase
of K (Figure 1A). Therefore, the likely number of subpopulations was identified using the Delta method. The
optimal number of groups was determined by the maximum likelihood, and k was set at 2 implying two
Table 2 Descriptive statistics for growth rate (GR), turfgrass quality (TQ), survival rate (SR), evapotranspiration rate
(ET), chlorophyll content (CHL) under heat stress in two trials
Trait
GR-1a (g/d)
Greenhouse trial
Growth chamber trial
Minimum
Maximum
Mean
Std.
Minimum
Maximum
Mean
Std.
0.04
15.29
0.24
0.8
0.03
0.25
0.11
0.04
GR-2b (g/d)
0.01
0.41
0.11
0.05
0.01
0.19
0.06
0.03
GR-3c (g/d)
0.00
0.24
0.05
0.03
0.00
0.07
0.03
0.02
TQ-1a
3.00
8.50
6.55
0.93
6.00
9.00
7.50
0.58
TQ-2b
2.00
7.00
4.72
1.14
2.33
7.67
5.54
1.15
c
TQ-3
0.00
6.00
2.56
0.88
1.00
6.17
3.91
1.24
CHL-1a ( mg.g-1.Fw )
1.39
6.22
2.35
0.55
1.32
3.20
2.03
0.41
CHL-2b ( mg.g-1.Fw )
0.70
3.08
1.76
0.44
1.26
3.05
2.05
0.44
CHL-3c (mg.g-1.Fw)
0.09
3.11
1.47
0.46
0.28
3.43
1.77
0.55
a
SR-1 (%)
90.00
100.00
99.65
1.33
98.33
100.00
99.75
0.60
SR-2b (%)
35.00
95.00
71.92
9.27
36.67
95.00
77.78
13.07
SR-3c (%)
5.00
75.00
46.66
16.49
6.67
86.67
52.5
16.08
ET-1a (g/d)
23.50
97.00
61.55
11.38
8.37
47.12
22.82
6.93
ET-2 (g/d)
30.00
142.00
84.84
10.99
6.96
49.66
21.17
7.70
ET-3c (g/d)
1.00
48.00
10.64
5.80
4.13
33.17
18.93
6.62
b
1a sampling time before heat treatment.
2b sampling time after 7d of heat treatment.
3c sampling time after 14d of heat treatment.
Sun et al. BMC Plant Biology (2015) 15:116
Page 4 of 13
Table 3 Pearson correlations coefficients among functional traits of different time in greenhouse trial
GR-1a
GR-2b
TQ-1a
TQ-2b
a
1
b
0.684**
1
a
-0.129
-0.209*
1
b
-0.002
-0.085
0.698**
1
a
0.060
-0.025
0.231*
0.276**
GR-1
GR-2
TQ-1
TQ-2
ET-1
b
ET-2
a
CHL-1
b
CHL-2
a
SR-1
SR-2
CHL-2b
0.283
0.850**
1
-0.100
-0.080
0.097
0.141
-0.130
-0.086
1
0.155
-0.030
0.015
0.444**
1
0.146
0.104
-0.328
-0.361
-0.011
-0.031
*
-0.197
**
0.278
**
0.731
**
0.602
**
0.568
**
0.699
SR-1a
SR-2b
1
0.280
0.045
b
CHL-1a
-0.006
**
**
ET-2b
0.059
**
**
ET-1a
**
0.315
**
0.333
**
0.322
**
0.313
*
0.197
**
0.265
1
0.644**
1
*significant at P < 0.05, **significant at P < 0.01.
1a the value at 7 d of heat stress relative the initial value before heat stress.
2b the reduction value at 14d of heat stress relative the initial value.
Abbreviations: TQ-turf quality, ET- evapotranspiration rate, Chl-chlorophyll content. SR-survival rate, GR- Growth rate.
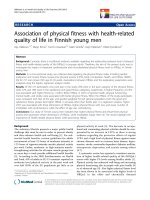
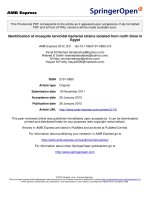
structural groups (G1 and G2) were identified in the
panel (Figure 1B). The population structure matrix (Q)
identified at k = 2 was applied to define the membership
probability for assigning accessions to subpopulation
when the value was >0.7 (Additional file 2 Table S2).
However, a few of wild accessions were obscure, such
as 4 (Q1 = 0.542), 55 (Q2 = 0.578), 62 (Q1 = 0.553),
and 96 (Q2 = 0.583). Most of value of accessions (80%)
were >0.8. G1 that was the most diverse group contained
74 accessions of mixed origins, including all commercial
cultivars (8 accessions) and the majority of wild accessions form European (25/32), U.S. (28/30), Asia (8/20),
and South America (3/3) (Figure 2). G2 contained 26 accessions that mainly collected majorly from North Africa
(5/6, Tunisia, Algeria, and Morocco), Asia (12/20, China,
Iran, Turkey, Israel), European (7/32).
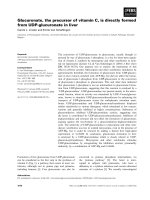
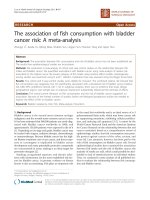
There was no obvious kinship (K) that detected based
on 90 SSR markers in the panel of populations (Figure 3).
More than 55.3% of the pair-wise kinship estimates
were zero while approximately 89% of estimates were
between 0 and 0.05. Less than 5% of estimates were >0.1,
indicating that the familial relationships minimum among
samples, and would not cause further complexity in association analysis.
Association analysis and evaluation of association model
Combined with all SSR alleles and three traits including
turfgrass quality, growth rate and leaf chlorophyll
content in growth chamber trial, associations were performed to detect the effects of Q and K for controlling
false associations. Owing to the complexity and population structure in out panel, the simple model that
Table 4 Pearson correlations coefficients among functional traits of different time in growth chambers trial
GR-1a
GR-2b
TQ-1a
TQ-2b
ET-1a
GR-1a
1
GR-2b
0.608**
a
**
0.327**
1
*
0.243
0.444**
0.686**
0.184
**
0.251
0.323**
1
**
0.159
0.417**
0.688**
TQ-1
0.316
b
TQ-2
a
ET-1
b
ET-2
ET-2b
CHL-1a
CHL-2b
SR-1a
1
0.262
*
1
0.085
0.315
CHL-1
-0.036
0.109
0.119
0.181
0.036
0.054
1
CHL-2b
0.031
0.230*
0.361**
0.403**
0.015
0.121
0.525**
0.059
*
**
**
-0.044
-0.016
0.264
0.587**
1
**
-0.022
0.001
0.182
0.606**
0.768**
a
a
SR-1
b
SR-2
-0.022
SR-2b
0.246
0.193
0.373
**
0.300
0.365
0.326
1
**
*significant at P < 0.05, **significant at P < 0.01.
1a the value at 7 d of heat stress relative the initial value before heat stress.
2b the reduction value at 14d of heat stress relative the initial value.
Abbreviations: TQ-turf quality, ET- evapotranspiration rate, Chl-chlorophyll content. SR-survival rate, GR- Growth rate
1
1
Sun et al. BMC Plant Biology (2015) 15:116
Page 5 of 13
Figure 3 Distribution of pair-wise relative kinship estimates between
100 tall fescue accessions.
(Additional file 3 Table S3). The more stringent model
was performed, and the less spurious associations were
identified. So the results from Q + K model by MLM
would be showed and discussed.
Marker allele-trait associations
Figure 1 Calculation of true K of tall fescue accessions and (A) Evolution
of the average logarithm probability of the data likelihoods (LnP(D)) for
tall fescue genotypes; (B) Magnitude of Δk for each K value according
to Evanno et al. [58].
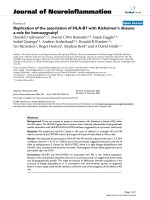
overlooked Q and K was not performed. For any trait,
the P values from the three models were close to the
expected P value (Figure 4). However, the model of Q
showed a different distribution with the other models
for turfgrass quality and chlorophyll content. On the
other hand, the K and Q + K model displayed similar
distribution of P values, and the identified associations
(P < 0.01) showed the high similarity in both models
In MLM model with Q and K, a total of 97 SSR alleles
were associated with five heat-relative traits at two
time points (P < 0.01) in greenhouse trial, while that in
growth chamber trial resulted in 67 SSR loci that were
strongly associated with the 5 traits (P < 0.01) (Table 5,
and Additional file 4 Table S4). In greenhouse trial, 15
alleles of marker NAF057 that amplified 22 alleles
showed the association with ET at two time points by
using Q + K model. The similar results also occurred in
marker NFA87 associated with GR-1, marker NFA155
related with TQ-1 in growth chamber trial. Moreover,
many marker alleles could be associated with a functional
trait, and one marker allele was associated with more than
one trait. For example, SSR marker alleles (NAF036-194,
NAF013-250, NAFG17-136, NAFG023-207, and NAF138211) were associated with SR and TQ at two sampling
times under heat stress in greenhouse trial. Comparing
with the same association alleles in two trials, only 2
Figure 2 Population structure analysis of 100 tall fescue accessions. Numbers on the x-axis indicate the accession and those on the y-axis show
the group membership.
Sun et al. BMC Plant Biology (2015) 15:116
Page 6 of 13
Figure 4 Quantile-quantile plots of estimated –log10 (P) from association analysis using three models in three traits: a turfgrass quality, b growth
rate, c leaf chlorophyll content. The black line is the expected line under the null distribution. The blue line represents the observed P values
using GLM with Q model; the red line represents the observed P values using MLM model with K; the yellow line represents the observed P values
using MLM model with Q and K.
marker alleles showed similar associations with traits
(Table 6). NFA87-418 that located the linkage group 3B
was associated with GR-2, and NFA91-152 was associated
with ET-2 in both trials by MLM analysis.
Discussion
Heat responses of tall fescue
Heat stress is a major factor that limits growth of coolseason turfgrass on a global scale. Turfgrass survive under
high temperature through tolerance or escape mechanisms, which involve many phenotypic and physiological
characteristics including growth-restricted, higher photosynthesis rate, stay-green, cell membrane thermal stability,
and earliness [28]. High temperature decreased turf quality, caused leaf water deficiency and yellowing, constrained
growth, and reduced photosynthesis. So, leaf wilting, turfgrass quality, growth rate, evorpotranspiration rate, and
chlorophyll content provided convenient and more efficient measurements for studying turfgrass responding
mechanism under unfavorable conditions, which have
been intensively applied for screening heat-tolerant germplasm of turfgrass [29-31].
In our trials, tall fescue accessions under heat stress
exhibited varying degree of negative effects based on
ANOVA analysis. Relatively low TQ, high leaf wilting,
reduced CHL and severe water loss characteristics presented the damage level of heat stress of tall fescue.
Large variations in these functional traits of accessions
from different geographic locations and significant correlations between functional traits would provide the
potential for selecting heat tolerant accessions and
evaluating reliable SSR marker by association analysis
between marker and functional traits. However, heat tolerance mechanisms of tall fescue would be different in
Table 5 Significant marker-trait associations identified for different traits by Q + K model of MLM
Trial
Greenhouse
Trait
Growth chamber trial
Greenhouse trial
Number of
markers
P-value range
Phenotypic
variation (%)
Number of markers
P-value range
GR-1
22
3.93 × 10⁻⁴-0.0096
7.23-17.38
11
3.06 × 10⁻⁴-0.0093
7.09-13.93
GR-2
7
6.31 × 10⁻⁵-0.0069
7.77-21.86
2
0.0038-0.0057
13.22-14.34
TQ-1
8
0.0030-0.0096
7.11-12.62
8
1.57 × 10⁻⁴-0.0093
7.03-14.09
TQ-2
2
7.51 × 10⁻⁴-0.0087
7.20-12.17
4
0.0030-0.0075
9.06-10.10
CHLT-1
5
8.59 × 10⁻⁴-0.0099
7.06-15.51
17
0.0025-0.0094
8.80-12.99
CHLT-2
6
0.0024-0.0078
8.14-13.94
4
0.0049-0.0073
10.38-11.27
-4
Phenotypic
variation (%)
SR-1
2
0.0011-0.0073
8.77-17.22
8
8.09 × 10 -0.0090
7.15-15.46
SR-2
4
0.0028-0.0065
8.90-13.92
3
0.0089-0.0099
7.66-10.99
-4
ET-1
5
0.0039-0.0057
10.49-13.52
20
7.29 × 10 -0.0089
7.25-15.17
ET-2
6
0.0028-0.0085
7.36-12.48
20
2.86 × 10⁻⁴-0.0092
7.17-17.06
Abbreviations: TQ-turf quality, ET- evapotranspiration rate, Chl-chlorophyll content. SR-survival rate, GR- Growth rate.
Sun et al. BMC Plant Biology (2015) 15:116
Page 7 of 13
Table 6 Same marker allele-trait associations with percentage of functional traits after 7 and 14 d of heat stress relative to initial condition of tall fescue accessions for both trials by Q + K model at P < 0.01
Marker
allels
LGa
NFA87-418
NFA91-152
Greenhouse trial
Growth chamber
Trait
marker_F
marker_p
markerR2
Trait
marker_F
marker_p
markerR2
3B
GR-2
5.9196
0.0038
0.1434
GR-2
5.9196
1.88 E-04
0.1916
NA
ET-2
4.9308
0.0092
0.1001
ET-2
5.1261
0.0077
0.1046
LGa mean the locus of linkage groups of genetic linkage map of tall fescue according to Sara et al. [21].
Abbreviations: ET- evapotranspiration rate, GR- Growth rate.
the two trials. In growth chamber trial, heat tolerant accessions maintained relatively high growth rate and good
turfgrass quality. Simultaneously, heat-sensitive accessions presented lost water rapidly, curled leaves and even
died. Meanwhile, in the greenhouse trial, heat tolerant
accessions maintained good turfgrass quality and appearance by restraining growth. Similarly heat-sensitive
accessions experienced yellowing of leaves and withering. The probable explanation for variations in tolerance
mechanisms under heat stress were due to the different
stress conditions including soil properties and temperature
[32]. In the greenhouse trial the roots temperature was
buffered because of properties of soil. But flasks with roots
were directly exposed to heat stress in the chamber trial
due to utilizing the nutrition solution, which made the
turfgrass in flask to be more sensitive to high temperature
than in the greenhouse trial. In addition, both trials displayed highly significant correlations in most of the functional traits. This indicated that heat tolerant traits had
mutual influence, and these traits could provide adequate
parameters for evaluating the heat tolerance in the field.
Tall fescue accessions from different collection areas indicated diversity in phenotypic and physiological characteristics [33]. However the trend and level of heat damage of
the accessions were roughly consistent in two time points.
Therefore, heat tolerant tall fescue accessions would be effectively selected according the phenotypic traits when
heat stress conducted early days.
Population structure
Tall fescue accessions native to Europe and North
Africa, were introduced to North and South America in
the late 1800s. They eventually became a prominent forage
grass in 1940s in the United States where many commercial
cultivars were produced through selective breeding [34].
Tall fescue samples were collected from more than 40 cities
representing diverse geographical origins. So in view of the
geographical origins, local adaptation, and breeding history
of genotypes in association mapping panel, the nonindependent samples would often encompass both population structure and familiar relatedness [35,36]. In our study,
the Bayesian clustering approach model based analysis
divided the panel of samples into two sub-populations. The
most of the accessions from European, North America,
and all commercial cultivars were separated into the main
subpopulation. The wild accessions from North Africa
and Asia were separated into the second subpopulation.
The division rule cannot be simple explained geographically due to overlapping of several accessions from the
same region (European and Asia) in two groups, which indicated regional breeding objectives, the probable different
evolutionary paths and methods of ecological adaptation
in morphology and agronomic characteristics of ecogeographic races would be considered [37,38].
Presence of population structure could make some allele frequencies significantly differ between subpopulations, which would lead to spurious association (false
positives) of markers with traits [39]. Flint-Garcia et al.
[40] presented that 33 to 35% of variation of phenotypic
traits about flowering time in a diverse maize panel
would be attributed to population structure. Therefore,
if subpopulation structure is not taken into account,
spurious associations may be identified at other loci that
were differentially distributed among subpopulations.
Moreover, spurious associations cannot be controlled
entirely by GLM model. This is because the Q matrix
can only carry a rough dissection of population differentiation. Therefore, a unified mixed-model approach
for association mapping that incorporates the pairwise
kinship (K matrix) and Q matrix to correct multiple
levels of relatedness have been developed. This would be
a powerful approach for improving accuracy of association in many cases [40,41]. Kang [42] demonstrated
that the distribution of P values ideally should follow a
uniform distribution with less deviation from the expected P value. In our panel, SSR marker-trait associations were performed for three traits using the Q, K,
and Q + K models, and all the three showed a good fit
for P values. However, the models showed the different
effects of controlling the population structure for different traits. K model was more superior to the Q model,
but similar to the Q + K model. This is consistent with
some previous studies [41,43]. The K matrix could capture the relatedness between each possible pair of individual in panel. The Q matrix considers a few axes only
[44]. Consequently, no vivid familiar relatedness (from
the recent co-ancestry) has been detected in the panel.
Therefore a model that would test for complex quantitative traits would be necessary for improving the accuracy of association.
Sun et al. BMC Plant Biology (2015) 15:116
Marker allelic effects on functional traits
Little is known about the association of SSR loci with
heat tolerance related traits in plant species. In our study
97 marker-trait associations (MTAs) in greenhouse trial
and 67 MTAs were identified for five heat tolerant traits
at two time points (P < 0.01). A total of 13 MTAs in
greenhouse trial and 29 MTAs in growth chamber trial
were identified in present study for growth rate. High
temperature would affect pollen viability, fertilization
and seed development leading to yield losses. A large
number of MTAs for yield and yield related traits under
unfavorable conditions were reported in many crop species [7,8,13]. Furthermore, most of marker NAF057
amplifying 22 alleles were associated with ET in greenhouse trial, which implied the marker may be linked
with a crucial gene that is necessary for regulating water
loss and transpiration cooling under heat stress [45].
Similar results were observed between survival rate and
turfgrass quality in greenhouse trial, suggesting survival
rate, turfgrass quality and evapotranspiration rate are
vital functional traits reflecting heat tolerance of tall fescue and might be regulated by genetically linked homologous genes. Therefore, these associated markers and
identified genotypes with favorable alleles can be deployed after validation for molecular marker breeding to
develop heat tolerant in tall fescue.
It is interesting to found that many marker alleles presented significant association with single trait, or associations with more than one trait. For instance, 5 associations
were associated with SR and TQ in greenhouse trial, which
would be considered to be pleiotropic or co-localized
MTAs [8]. These co-localized or pleiotropic associations
may be beneficial to detect some important genomic regions or genes for heat tolerance related traits. Furthermore, the markers associated with more than one trait
may be made effectively use of improving more than one
trait by marker assisted selection.
For screening heat tolerant accessions by phenotypic
and physiological traits, our experimental population is
relative small, which influence the power of association
analysis. Yan et al. [46] showed that association study with
a set of 500 individuals would supplyan 80% probability of
detecting a gene that explains 3% or more of the phenotypic variation, and increasing the number of population
could be more substantial effect on the power of MTAs
than increasing the density of markers in genome-wide association (GWS). More reliable markers could be identified for developing elite heat tolerant tall fescue cultivars
through marker assisted selection under various conditions: first if higher density DNA polymorphism databases
would have been evenly distributed in all genome chromosomes. And secondly larger mapping populations and
phenotypic traits under more sites of heat stress would
have been used for association mapping.
Page 8 of 13
A large challenge for association analysis for complex
quantitative traits in plant is large number of loci identified with small effects in some plant species such as
barley, maize, wheat and rice. In our study by MLM
analysis, the explained variation (Marker R2) for the
identified associations were low to modest, ranging from
7.03% (turfgrass quality)-19.21% (turfgrass quality) in greenhouse trial, and 7.06% (leaf chlorophyll content) -21.86%
(growth rate) in growth chamber trial, respectively. The
explained variation by marker-trait associations (MTAs)
for abiotic stress related traits in association analysis of
plant species is changeable. Thudi et al. (2014) used DArT,
SNP, and SSR markers to study 300 accessions of chickpea
for drought tolerance related root traits, heat tolerance,
yield and yield component traits cross 6 environments,
and showed that phenotypic variance explained of MTAs
ranged from low (4.14%) to very high (96.55%). However,
Varshney et al.[47] studying a diverse barley panel at a dry
and wet location for drought tolerance related traits,
found that explained variation for all of identified MTAs
was rather low, ranging from 0.1% to 6.7%. Some other
studies on GWA analysis in barley also showed that
MTAs contributing large phenotypic variation are highly
heritable, and MTAs of explained variation >10% seem
hard to be identified for the complex quantitative traits
like drought tolerance in association analysis [6,48]. Large
effect QTL may be due to the inbreeding nature of some
species, while out-crossing plants such as tall fescue and
maize may have very large number of genes contributing a
very small amount to a quantitative trait [46].
Associations identified in our study were not only
small, but also little consistent across environments like
barley or wheat. In the two trials of our study, there
were only two associated SSR alleles were identified in
two trials at low threshold, -Log (P-value) ≥2.0 by MLM
analysis, which showed influence of environment on
heat tolerance related traits that would be low heritability. The observed differences of marker-trait associations
in both trials may be due to the different experimental
conditions of heat stress, including temperature, heat intensity, duration, and matrix cultivated, which lead to
the variation of phenotypic, physiologic and biochemical
characteristics in response to heat stress, and even trigger different genetic pathways and mechanisms of heat
tolerance. In greenhouse trial, the temperature of greenhouse often exceeded 45°C in summer, and reached
50°C at the noon, which restrained growth of tall fescue
and caused severe thermal damage. Most tall fescue
accessions halted growth, withered rapidly, and the
leaves yellowed after 2 or 3 day of heat stress. However,
the growth chambers controlled the temperature at
35°C moderate high temperature. The extreme high
temperature would induce specific membrane damage,
expression of HSP [49], and alteration of activity of
Sun et al. BMC Plant Biology (2015) 15:116
enzymes, which was not prevalent at moderate heat
stress [50]. Simultaneously, immersing grasses into nutrient solution in growth chamber trial made the roots
that are more sensitive to heat stress than leaves to be
directly exposed to high temperature and severe damage
[51,52]. Therefore, many heat sensitive tall fescue accessions presented dehydration wilting and even death in
growth chamber trials. Specifically, many factors resulted
in the differences of phenotypic and physical traits when
tall fescue accession responded to heat stress, which
made a few SSR alleles associated with functional traits
to be simultaneously identified. The observation that
the majority of the SSR alleles associated with heat
tolerant-related traits could only be identified in a specific condition of heat stress indicated that tall fescue is
very sensitive to variation of high temperature. The similar conditions had also reported in association analysis
for drought tolerance related traits of barley, wheat,
maize, and chickpea [7,8,13,46]. So identified markers
may be not suitable for direct application in markerassisted selection (MAS) programme for developing
more stable heat tolerant tall fescue varieties or cultivars.
Vast studies including complex crosses and QTLs mapping with well chosen parents on the basis of results obtained in our study for verifying effectiveness of marker
alleles are necessary for breeding heat tolerance cultivars
by marker assisted selection.
Conclusion
In summary, we initial focus on association mapping
analysis of heat tolerance-related functional traits in
tall fescue. Five quantitative traits GR, TQ, SR, CHL
and ET showed high diversity and significant mutual
correlations in response to heat stress in tall fescue. Two
subpopulations were detected in the panel of accessions,
but no obvious relative kinship was observed. But
for any trait, the K model controlling relative kinship
showed the similar distribution of P value and associations with Q + K model that controlling both population
structure and relative kinship in our study. So model
testing is necessary to reduce the spurious associations.
By mixed linear model (Q + K) as the best model for association analysis, 97 associations in greenhouse trial
and 67 associations in chamber trial were identified for
five heat tolerant traits at two time points (P < 0.01). It is
necessary for tall fescue selection breeding because these
markers would enhance efficiency of identifying heat tolerant accessions bringing desirable alleles. However, only
two SSR alleles associated with GR and ET were identified due to the different environments between two
trials. And inadequate samples and limited markers were
utilized in our study which might have weakened the
reliability and effectiveness of associated SSR markers.
Hence, it was necessary to confirm the associated
Page 9 of 13
marker locus by genotypes F2 grasses and phenotype F3
progeny, or QTL mapping with a high resolution linkage
mapping in the next step. Simultaneously, for identification of more effective markers or genes by association
analysis, further research need to focus on selecting candidate genes regulating heat tolerance of tall fescue or
developing a large amount of single nucleotide polymorphism for genotyping larger association population.
Methods
Plant materials and growth conditions
100 diverse accessions of tall fescue were employed in
this study, including 93 accessions obtained from the
United States Department of Agriculture-Agricultural
Research Service (USDA-ARS) and 7 turf-type commercial cultivars obtained from the seed industry (Table 7).
The collection of accessions was based on geographical
locations for maximizing genotypic diversity. All accessions were confirmed to be hexaploid by flow cytometry
(data not shown). This study was conducted at Wuhan
Botanical Garden, Chinese Academy of Science, beginning
in 2012. A single seed from each accession was sown in
petri dishes with a layer of filter paper soaked in water
and kept in dark at 22°C for germination. After one week,
the accessions were transplanted into plastic pots (15 cm
deep, 11 cm wide) containing a mixture of sand and soil
(1:1, v/v) in a greenhouse with temperature ranging from
20°C to 26°C, 1000-1500 μmol photons m-2 s-1, 14 h
photoperiod of natural sunlight, and 76% average relative
humidity. Plants were irrigated daily to maintain sufficient
water supply conditions, fertilized weekly with halfstrength Hoagland’s solution [53], and mowed to 7 cm
canopy height once a week. Each accession was propagated through tillers multiple times for genetic uniformity.
Heat treatment and experimental design
Two trails were conducted. One was processed in the
greenhouse in June, 2012, the other in growth chambers
repeated in August, September, and October 2012,
respectively.
1. Greenhouse trail:
All 100 accessions were transferred into a natural
greenhouse in June 8th to July 14th, 2012 after growing
in the controlled greenhouse for 30 d. The maximum
temperatures varied from 39°C to 51°C during 21 d of
heat treatment. Each accession had three replications
with same genotypes, and all plots were arranged in a
completely randomized block design. The greenhouse
had a photosynthetically active radiation (PAR) of 10002000 μmol s-1 m-2 of natural sunlight. Grasses were irrigated daily until water could freely drain from the holes
under the plots.
Sun et al. BMC Plant Biology (2015) 15:116
Page 10 of 13
Table 7 Origin and grouping information of tall fescue accessions used in this research
IDa
PI number
Origin
Qb
IDa
PI number
Origin
Qb
1
Justice
Cultivar
1
51
PI 438521
Japan
1
2
PI 527504
France
1
52
PI 442490
Belgium
1
3
PI 531230
USA
1
53
PI 469244
USA
1
4
PI 595072
Romania
1
54
PI 499494
China
1
5
PI 596701
USA
1
55
PI 499495
China
2
6
PI 598491
Netherlands
1
56
PI 174210
Turkey
2
7
PI 598493
Romania
1
57
PI 200339
Israel
2
8
PI 636532
Tunisia
2
58
PI 203728
Uruguay
1
9
PI 636597
USA
1
59
PI 208679
Algeria
2
10
PI 636601
France
1
60
PI 208681
Algeria
2
11
PI 538006
USA
1
61
PI 211032
Afghanistan
1
12
PI 538330
USA
1
62
PI 224975
South Africa
1
13
PI 577082
Yugoslavia
1
63
PI 231563
Portugal
2
14
PI 578717
USA
1
64
PI 234881
Switzerland
2
15
PI 578718
USA
1
65
PI 234883
Switzerland
1
16
PI 578724
USA
1
66
PI 235036
Sweden
1
17
PI 583747
USA
1
67
PI 235125
Netherlands
1
18
PI 583822
USA
1
68
PI 249738
Greece
1
19
PI 655104
USA
2
69
PI 257742
Sweden
1
20
PI 655112
USA
1
70
PI 269894
Pakistan
1
21
PI 655113
USA
2
71
PI 274617
Poland
2
22
PI 423090
Spain
2
72
PI 283281
UK
1
23
PI 422638
France
1
73
PI 283304
Denmark
1
24
PI 502373
Russian
1
74
PI 311044
Romania
2
25
PI 504538
Greece
1
75
PI 314685
Russian
2
26
PI 577094
Switzerland
1
76
PI 380844
Iran
2
27
PI 505833
Kazakhstan
2
77
PI 388897
Japan
1
28
PI 508603
Argentina
1
78
PI 388898
Japan
1
29
PI 578719
USA
1
79
PI 578714
USA
1
30
PI 512305
Portugal
1
80
PI 601106
USA
1
31
PI 512315
Spain
1
81
PI 601227
USA
1
32
PI 547396
Iran
1
82
PI 601447
USA
1
33
PI 559374
USA
1
83
PI 608024
USA
1
34
PI 561430
USA
1
84
PI 608025
USA
1
35
PI 574522
USA
1
85
PI 619025
China
2
36
PI 577081
Yugoslavia
1
86
PI 632516
USA
1
37
PI 598496
Hungary
1
87
PI 608787
USA
1
38
PI 598574
Kazakhstan
2
88
PI 600739
USA
1
39
PI 598930
Italy
1
89
PI 600801
USA
1
40
PI 598860
Morocco
2
90
3rd Millennium
Cultivar
1
41
PI 610909
Morocco
1
91
Stone wall
Cultivar
1
42
PI 610933
Italy
1
92
Davinci
Cultivar
1
43
PI 610951
Morocco
2
93
Pixie
Cultivar
1
44
Pure Gold
Cultivar
1
94
PI 184041
Yugoslavia
1
Sun et al. BMC Plant Biology (2015) 15:116
Page 11 of 13
Table 7 Origin and grouping information of tall fescue accessions used in this research (Continued)
45
PI 618971
China
2
95
PI 255874
Poland
1
46
PI 618973
China
2
96
PI 283287
Czechoslovakia
2
47
PI 619005
China
2
97
PI 578713
USA
1
48
PI 440345
Russian
2
98
PI 608808
USA
1
49
PI 423045
Spain
2
99
Grand II
Cultivar
1
50
PI 427127
Chile
1
100
Smirna
Cultivar
1
a
ID number representing accessions used in this research.
Q identified population structure groups in this research.
b
2. Growth chamber Experiment
The trial was repeated three times in growth chamber in
August, September and October 2012. 100 accessions
were transformed into 250 mL Erlenmeyer flask wrapping
with aluminum foil, containing half-strength Hoagland’s
solution and 0.1 μmol magnesium oxide to provide additional oxygen after 30 d growing in controlled greenhouse. Grasses with 7-10 tillers were sealed with parafilm
to prevent water escaping from gaps. Before heat treatment, all flasks of grasses were pre-incubated 10 d. Two
growth chambers during experimental period were controlled in 14 photoperiod, 70% ± 10% relative humidity,
and approximately average 450 μmol photons m-2 s-1.
Every other day all flasks were exchanged layers and
half-strength Hoagland solution added. This trail included an unheated control (25/16°C, day/night) and
heat stress (38/30°C, day/ night) treatment sustaining
15 d. The heat treatment was subjected in different
chambers for each replication.
Growth and physiological measurements
Many growth and physiological traits were measured before and after heat stress interval 7 d in two trails, including turf grass quality (TQ), survival rate (SR), leaf
chlorophyll content (CHL), evapotranspiration rate (ET)
and growth rate (GR) . Turf quality was evaluated visually using a scale of 0 (yellow, brown or dead) to 9
(optimum greenness, uniformity, cover) based on density, texture, turf color, and smoothness. Survival rate was
also assessed by visual rate using a ratio between survival
canopy and total plant. Every 7 d leaves of pots were cut
at 7 cm canopy height, were collected, immediately
killed at 105°C 30 min, dried at 70°C in an oven for
72 h. Growth rate was calculated as dry weight per
growth day. Evapotranspiration rate was measured by
weight loss of the plant plot every 24 h and the relative
transproation was normalized according to a method described by Hu et al. [54]. Leaf chlorophyll content was
measured using the method described by Hiscox and
Israelstam [55].
Data was collected from the non-heat and heat treatment across all accessions of tall fescue from two trails to
examine the efficiency and consistency. The percentage of
reduction of all traits, calculated as [(control value or initial value -heat value)/ control or initial value] × 100, was
used to indicated the grass heat tolerance. The main treatment effect, variance analysis (ANOVA) and correlation
between growth and physiological traits were performed
using SPSS18.0 (IBM Corporation, New York, USA).
DNA isolation and SSR analysis
Young leaves of each accession were collected for DNA isolation using a cetyltrimethyl ammonium bromide (CTAB)
method [56]. A set of 90 published genome-wide SSR
markers [21,57] mapped in 22 linkage groups in tall fescue
were analyzed in all accessions (Additional file 1 Table S1).
All forward primer sequence of markers were labeled with
four fluorescent dyes of different colors [FAM (blue), HEX
(green), TAMRA (yellow), and ROX (red)]. Each 10 μL
PCR reaction in 96 microplates consisted of 1 × supplied
Taq-buffer, 2.5 mM MgCl2, 200 μM dNTPs, 0.2 mM of
each primer pair, 0.5 U of Taq DNA polymerase, and 30 ng
of template DNA. PCR reaction was started at 95°C for
10 min; followed by 25 cycles of 50 s at 95°C, 50 s at 68°C
with a decrease of 0.6°C in each consequent cycle, 60 s at
72°C; then ran for 15 cycles at 95°C for 50 s, 54°C for 50 s,
72°C for 60 s; and a final extension step 72°C for 10 min.
All PCR reactions were used a touch-down program in a
96-well My Cycler thermal cycler (Bio-Rad Inc., Hercules,
CA, USA). The PCR amplified fragments were separated by
an ABI 3730 DNA Sequence (Applied Biosystems Inc., Foster City, CA, USA). Alleles were scored by GeneMarker 1.5
software (Soft Genetics, LLC, State College, PA, USA) and
checked twice manually for accuracy. If more than one
fragment were amplified by a primer in accession and appeared differently in other accessions, they were scored as
different loci. For allohexaploid genome of F. arundinacea,
band scores of SSR loci were entered into a binary matrix
as presence (1) or absence (0) following Sara et al. [21]. All
confirmed polymorphic alleles were applied for population
structure and kinship analysis.
Population structure and relative kinship
As a result of labeling all SSR markers as dominant in
each genotype, no information on marker linkage could
Sun et al. BMC Plant Biology (2015) 15:116
be obtained in population structure model. A Bayesian
model-based clustering method carried out in STRUCTURE 2.0.1 software [58] was employed to determine
population structure (Q) and division accessions into
subpopulation. The basis of the clustering method is that
it prevented admixture of correlated allele frequencies,
therefore the allocation of individual genotype to K
subpopulations is in such a way that Hardy-Weinberg
and linkage equilibrium is valid within populations. The
structure was run ten times by setting pre-defined k (the
number of population groups) ranging from 1 to 15
using admixture models with 10,000 MCMC (Markov
Chain Monte Carlo) replications and 10,000 burn-in
time for each run. Population based on the maximum
likelihood was determined by the probability of data
likelihood LnP(D) in the output and an ad hoc statistic
△K based on the second-order rate of change in LnP(D)
between successive K values [58]. 15 independent runs
were operated 100 000 iterations of each run after burnin of 100 000 for a value of K setting from one to five.
Then SPAGeDi software [59] was applied to evaluating
relative pairwise kinship (K) by 90 SSR markers, and
then the pairwise kinship matrix (100 × 100) was produced by the Loiselle coefficient [60]. All negative kinship values between the individuals were assigned to
zero, according to Yu et al. [41].
Model testing and association mapping
Based on the differences in the regime of heat treatment
(density, duration time and matrix cultivated plant), the
functional traits of heat tolerant in two trials were used
for identifying association with SSR loci, respectively.
Turfgrass quality, growth rate and leaf chlorophyll content in growth chamber trial were selected to perform
marker-trait associations. Three models were used to access the effects of relative kinship (K) and population
structure (Q) for marker-trait associations. The Q model
was performed using general linear model (GLM). The
K and K + Q models were performed using MLM in
TASSEL 2.0.1 software [58]. The quantile- quantile plots
of estimated –log10 (P) were drawn using the observed
P values from SSR alleles-trait associations and the expected P values assuming that there was no associations
identified between marker and trait. The significant
threshold for marker-trait associations was set at P < 0.01.
Additional files
Additional file 1: Supplementary Table S1. List of the amplified
information of polymorphism SSR markers.
Additional file 2: Supplementary Table S2. The values of membership
probability for assigning tall fescue accessions to subpopulation when
the k = 2.
Page 12 of 13
Additional file 3: Supplementary Table S3. The associated marker
alleles with five traits at two time points by Q model, K model and Q + K
model in growth chambers trial (P < 0.01).
Additional file 4: Supplementary Table S4. The associated marker
alleles with five functional traits at two sampling times by Q + K model in
greenhouse trial and growth chambers trial, respectively (P < 0.01).
Abbreviations
CHL: Chlorophyll content; ET: Evapotranspiration rate; FW: Fresh leave weight;
GLM: General linear model; GR: Growth rate; GWS: Genome-wide association;
MAS: Marker-assisted selection; MLM: Mixed linear model; MTA: Marker-trait
association; SR: Survival rate; SSR: Simple sequence repeat; TQ: Turfgrass quality.
Competing interests
The authors declare that they have no competing interests.
Authors’ contributions
XYS performed the experiments and wrote the manuscript. JR and ZMD
analyzed the data. JMF and TH conceived and designed the experiments. EA
and TH helped to draft the manuscript and revise the manuscript. All authors
read and approved the final manuscript.
Acknowledgement
This research was supported by the General Program (Grant #: 31071822;
31470363) from the National Natural Science Foundation of China, the
National High Technology Research and Development Program
(No.2011AA100209-2) from “863” plan of China, and the Special Fund of
Industrial (Agriculture) Research (No.200903001) for Public Welfare of
China. We thank the United States Department of Agriculture––Agricultural
Research Service (USDA-ARS) for contributing germplasm from their collection.
Author details
1
Key Laboratory of Plant Germplasm Enhancement and Specialty Agriculture,
Wuhan Botanical Garden, Chinese Academy of Science, Wuhan 430074Hubei,
P.R. China. 2The Key Laboratory of Horticultural Plant Genetic and
Improvement of Jiangxi, Institute of Biology and Resources, Jiangxi Academy
of Sciences, Nanchang 330096, China.
Received: 10 March 2015 Accepted: 17 April 2015
References
1. Seal AG. DNA variation in Festuca. Heredity. 1983;50:225–36.
2. Wang JZ, Cui LJ, Wang Y, Li JL. Growth, lipid peroxidation and
photosynthesis in two tall fescue cultivars differing in heat tolerance.
Biologic Plantarum. 2009;53(2):237–42.
3. Tester M, Langridge P. Breeding technologies to increase crop production
in a changing world. Science. 2010;327:818–22.
4. Hattori Y, Nagai K, Furukawa S. The ethylene response factors SNORKEL1 and
SNORKEL2 allow rice to adapt to deep water. Nature. 2009;460:1026–30.
5. Konishi S, Izawa T, Lin SY. An SNP caused loss of seed shattering during rice
domestication. Science. 2006;312:1392–06.
6. Korff V, Wang MH, Léon J, Pillen K. AB-QTL analysis in spring barley: II
Detection of favourable exotic alleles for agronomic traits introgressed
from wild barley (H. vulgare ssp. spontaneum). Theor Appl Genet.
2006;112:1221–31.
7. Rahman H, Pekic S, Lazic-Jancic V, Quarrie SA, Shah SM, Pervez A, et al.
Molecular mapping of quantitative trait loci for drought tolerance in maize
plant. Genet Mol Res. 2011;10(2):889–901.
8. Mahendar T, Hari DU, Abhishek R. Genetic dissection of drought and heat
tolerance in chickpea through genome-wide and candidate gene-based
association mapping approaches. Plos one 2014, doi:10.1371/journal.pone.
0096758
9. Gupta PK, Rustgi S, Kulwal PL. Linkage disequilibrium and association
studies in higher plants: present status and future prospects. Plant Mol Biol.
2005;57(4):461–85.
10. Thornsberry JM, Goodman MM, Doebley J, Kresovich S, Nielsen D, Buckler
ES. Dwarf8 polymorphisms associate with variation in flowering time. Nature
Genetic. 2001;28:286–9.
Sun et al. BMC Plant Biology (2015) 15:116
11. Aranzana MJ, Kim S, Zhao K. Genome-wide association mapping in Arabidopsis
identifies previously known flowering time and pathogen resistance genes.
PLoS Genet. 2005;1(5), e60.
12. Huang X, Wei X, Sang T, Zhao Q, Feng Q. Genome-wide association studies
of 14 agronomic traits in rice landraces. Nat Genet. 2010;42:961–7.
13. Liu SX, Wang XL, Wang HW, Xin HB. Genome-wide analysis of ZmDREB
genes and their association with natural variation in drought tolerance ant
seedling stage of Zea mays L. Plos Genetics. 2013;9(9), e1003790.
14. Yu X, Bai G, Liu S. Association of candidate genes with drought tolerance
traits in diverse perennial ryegrass accessions. J Exp Bot. 2013;64(6):1537–51.
15. Auzanneau J, Huyghe C, Escobar-Gutiérrez AJ, Julier B, Gastal F, Barre P.
Association study between the gibberellic acid insensitive gene and leaf
length in a Lolium perenne L. synthetic variety. BMC Plant Biol. 2011;11:183.
16. Tang JC, Camberato JJ, Yu XQ, Luo N, Bian SM, Jiang YW. Growth response,
carbohydrate and ion accumulation of diverse perennial ryegrass accessions
to increasing salinity. Sci Hortic. 2013;154:73–81.
17. Yu X, Bai G, Luo N. Association of simple sequence repeat (SSR) markers
with submergence tolerance in diverse populations of perennial ryegrass.
Plant Sci. 2011;180(2):391–8.
18. Cipriani G, Spadotto A, Jurman I, Di Gaspero G, Crespan M, Meneghetti S,
et al. The SSR-based molecular profile of 1005 grapevine (Vitis vinifera L.)
accessions uncovers new synonymy and parentages, and reveals a large
admixture amongst varieties of different geographic origin. Theor Appl Genet.
2010;121:1569–85.
19. Garris A, Tai T, Coburn J, Kresovich S, McCouch S. Genetic structure and
diversity in Oryza sativa L. Genetics. 2005;169:1631–8.
20. This P, Jung A, Boccacci P, Borrego J, Botta R, Costantini L, et al.
Development of a standard set of microsatellite reference alleles for
identification of grape cultivars. Theor Appl Genet. 2004;109(7):1448–58.
21. Saha MC, Mian R, Zwonitzer JC. An SSR-and AFLP-based genetic linkage
map of tall fescue (Festuca arundinacea Schreb.). Theor Appl Genet.
2005;110(2):323–36.
22. Xu WW, Sleper DA, Chao S. Genome mapping of polyploid tall fescue ( Festuca
arundinacea Schreb) with RFLP markers. Theor Appl Genet. 1995;91:947–55.
23. Hand ML, Cogan NO, Forster JW. Molecular characterisation and
interpretation of genetic diversity within globally distributed germplasm
collections of tall fescue (Festuca arundinacea Schreb.) and meadow fescue
(F. pratensis Huds.). Theor Appl Genet. 2012;124:1127–37.
24. Romina C, Beatriz R, Elba P. Genetic diversity in a world germplasm
collection of tall fescue. Genet Mol Biol. 2013;36(2):237–42.
25. Tehrani MS, Mardi M, Sahebi J, Catalán P, Díaz-Pérez A. Genetic diversity and
structure among Iranian tall fescue populations based on genomic-SSR and
EST-SSR marker analysis. Plant Syst Evol. 2009;282:57–70.
26. Breseghello F, Sorrells ME. Association mapping of kernel size and milling
quality in wheat (Triticum aestivum L.) cultivars. Genetics. 2006;172:1165–77.
27. Zhang J, Lu XQ, Song XF, Yan JB, Song TM. Mapping quantitative trait loci
for oil, starch, and protein concentrations in grain with high-oil maize by
SSR markers. Euphytica. 2008;162:335–244.
28. Wahid A, Gelani S, Ashraf M, Foolad MR. Heat tolerance in plants: an
overview. Environ Exp Bot. 2007;61:199–223.
29. Jansen M, Gilmer F, Biskup B. Simultaneous phenotyping of leaf growth and
chlorophyll luorescence via GROWSCREEN FLUORO allows detection of
stress tolerance in Arabidopsis thaliana and other rosette plants. Funct Plant
Biol. 2009;36:902–14.
30. Moffatt JM, Sears RG, Paulsen GM. Wheat high temperature tolerance
during reproductive growth. I. Evaluation by chlorophyll fluorescence.
Crop Sci. 1990;30:881–5.
31. Petkova V, Denev I, Cholakov D, Porjazov I. Field screening for heat tolerant
common bean cultivars (Phaseolus vulgaris L.) by measuring of chlorophyll
fluorescence induction parameters. Hortic Sci. 2007;111:101–6.
32. Sun XY, Hu LX, Xie Y, Fu JM. Evaluation of genotypic variation in heat
tolerance of tall fescue by functional traits. Euphytica. 2014;199(3):247–60.
33. Majidi MM, Mirlohi A, Amini F. Genetic variation, heritability and correlations
of agro-morphological traits in tall fescue (Festuca anndinacea Schreb.).
Euphytica. 2009;167:323–31.
34. Boller B, Posselt U, Veronesi F. Fodder Crops and Amenity Grasses [M]//
Handbook of Plant Breeding. New York: Spring Science Business Media; 2010.
35. Yu J, Buckler ES. Genetic association mapping and genome organization of
maize. Curr Opin Biotechnol. 2006;17:155–60.
36. Devlin B, Roeder K. Genomic control for association studies. Biometrics.
1999;55:997–1004.
Page 13 of 13
37. Burner DM, Balasko JA, O’Brien PM. Attributes of tall fescue germplasm of
diverse geographic origin. Crop Sci. 1988;28(3):459–62.
38. Robson MJ, Jewiss OR. A comparison of British and North African varieties
of tall fescue (Festuca arundinacea). III. Effects of light, temperature and
day length on relative growth rate and its components. J Appl Ecol.
1968;5:191–204.
39. Ersoz ES, Yu J, Buckler ES. Applications of linkage disequilibrium and
association mapping in maize. In: Kriz AL, Larkins BA, editors. Molecular
Genetic Approaches to Maize Improvement. New York, NY: Springe-Verlag;
2009. p. 173–95.
40. Price AL, Patterson NJ, Plenge RM, Weinblatt ME, Shadick NA, Reich D.
Principal components analysis corrects for stratification in genome-wide
association studies. Nat Genet. 2006;38:904–9.
41. Yu J, Pressoir G, Briggs W, Bi I, Yamasaki M, Doebley J, et al. A unified
mixed-model method for association mapping that accounts for multiple
levels of relatedness. Nature Genetic. 2006;38:203–8.
42. Kang HM, Zaitlen NA, Wade CM, Kirby A, Heckerman D, Daly MJ, et al.
Efficient control of population structure in model organism association
mapping. Genetics. 2008;178(3):1709–23.
43. Yang X, Yan JB, Trushar S, Marilyn L, Zheng Y. Genetic analysis and
characterization of a new maize association mapping panel for quantitative
trait loci dissection. Theor Appl Genet. 2010;121:417–31.
44. Myles S, Peiffer J, Brown PJ, Ersoz ES, Zhang ZW, Costich DE, et al.
Association mapping: critical considerations shift from genotyping to
experimental design. Plant Cell. 2009;21:2194–202.
45. Bonos SA, Murphy JA. Growth response and performance of Kentucky
Bluegrass under summer stress. Crop Sci. 1999;39:770–4.
46. Yan J, Warburton M, Crouch J. Association mapping for enhancing maize
(Zea mays L.) genetic improvement. Crop Sci. 2011;51:433–49.
47. Varshneya RK, Paulo MJ, Grando S, Graner A. Genome wide association
analyses for drought tolerance related traits in barley (Hordeum vulgare L.).
Field Crop Res. 2012;126:171–80.
48. Wang M, Jiang N, Jia T, Leach L, Cockram J, Waugh R, et al. Genome-wide
association mapping of agronomic and morphologic traits in highly structured populations of barley cultivars. Theor Appl Genet. 2011. doi:10.1007/
s00122-011-1697-2.
49. Vierling RA, Nguyen HT. Heat shock protein gene expression in diploid
wheat genotypes differing in thermal tolerance. Crop Sci. 1992;32:370–7.
50. Stone PJ, Nicolas ME. A survey of the effects of high temperature during
grain filling on yield and quality of 75 wheat cultivars. Aust J Agr Res.
1995;46:475–92.
51. Huang BR, Liu XZ, Fry JD. Effects of high temperature and poor soil aeration on
root growth and viability of creeping bentgrass. Crop Sci. 1998;38:1618–22.
52. Xu QZ, Huang BR. Effects of differential air and soil temperature on
carbohydrate metabolism in creeping bentgrass. Crop Sci. 2000;40:1368–74.
53. Hoagland DR, Arnon DI: The water-culture method for growing plants
without soil. Circular. Circular. Calif Agric Exp Circ 1950, pp 247.
54. Hu T, Li HY, Zhang XZ, Luo HJ, Fu JM. Toxic effect of NaCl on ion
metabolism, antioxidative enzymes and gene expression of perennial
ryegrass. Ecotoxicol Environ Saf. 2011;77:2050–6.
55. Hiscox JD, Israelstam GF. A method for the extraction of chlorophyll from
leaf tissue without maceration. Can J Bot. 1979;57:1332–4.
56. Doyle JJ, Doyle JL. Isolation of plant DNA from fresh tissue. Focus. 1990;12:13–5.
57. Saha MC, Cooper JD, Mian MAR. Tall fescue genomic SSR markers:
development and transferability across multiple grass species. Theor Appl
Genet. 2006;113(8):1449–58.
58. Evanno G, Regnaut S, Goudet J. Detecting the number of clusters of
individuals using the software STRUCTURE: a simulation study. Mol Ecol.
2005;14:2611–20.
59. Hardy OJ, Vekemans X. SPAGeDi: a versatile computer program to analyze
spatial genetic structure at the individual or population levels. Mol Ecology
Notes. 2002;2:618–20.
60. Loiselle BA, Sork VL, Nason J, Graham C. Spatial genetic structure of a
tropical understory shrub, Psychotria officinalis (Rubiaceae). Am J Bot.
1995;82:1420–5.