báo cáo hóa học: " Association of physical fitness with health-related quality of life in Finnish young men" doc
Bạn đang xem bản rút gọn của tài liệu. Xem và tải ngay bản đầy đủ của tài liệu tại đây (307.67 KB, 8 trang )
RESEARC H Open Access
Association of physical fitness with health-related
quality of life in Finnish young men
Arja Häkkinen
1,2*
, Marjo Rinne
3
, Tommi Vasankari
3,4
, Matti Santtila
5
, Keijo Häkkinen
6
, Heikki Kyröläinen
6
Abstract
Background: Currently, there is insufficient evidence available regarding the relationship between level of physical
fitness and health-related quality of life (HRQoL) in younger adults. Therefore, the aim of the present study was to
investigate the impact of measured cardiovascular and musculoskeletal physical fitness level on HRQoL in Finnish
young men.
Methods: In a cross-sectional study, we collected data regarding the physical fitness index, including aerobic
endurance and muscle fitness, leisure-time physical activity (LTPA), bod y composition, health, and HRQoL (RAND
36) for 727 men [mean (SD) age 25 (5) years]. Associations between HRQoL and the explanatory parameters were
analyzed using the logistic regression analysis model.
Results: Of the 727 participants who took part in the study, 45% were in the poor category of the physical fitness,
while 37% and 18% were in the satisfactory and good fitness categories, respect ively. A higher frequency of LTPA
was associated with higher fitness (p < 0.001). Better HRQoL in terms of general health, physical functioning,
mental health, and vitality were associated with better physical fitness. When the HRQoL of the study participants
were compa red with that of the age- and gender-weighted Finnish general population, both the good and
satisfactory fitness groups had higher HRQoL in all areas other than bodily pain. In a regression analysis, higher
LTPA was associated with three dimensions of HRQoL, higher physical fitness with two, and lower number of
morbidities with all dimensions, while the effect of age was contradictory.
Conclusions: Our study of Finnish young men indicates that higher physical fitness and leisure-time physical
activity level promotes certain dimensions of HRQoL, while morbidities impair them all. The results highlight the
importance of health related physical fitness while promoting HRQoL.
Background
The sedentary lifestyle presents a major public health
challenge that must be met in order to prevent obesit y
and thus e nhance health and well-being [1]. For sub-
stantial health benefits, current guidelines for adults
recommend at least 2.5 hours of m oderate-intensity or
1.25 hours of vigorous-intensity aerobic physical activity
per week. Futher, moderate- or high-intensity muscle-
strengthening activities for all major muscle groups two
or more days a week provide additional health benefits
[2]. According to the 2005 Eurobarometer on Health
and Food, 41% of adults in EU-15 countries reported no
moderate level physical activity in the past week and
over half (59%) of the EU population get little or no
physical activity at work [3]. The decrease in occupa-
tional and commuting physical activities should be com-
pensated by an increase in LTPA as the re is strong
evidence regarding the protective effects of regular
LTPA and a high level of physical fitness against major
chronic diseases such as coronary heart disease, hyper-
tension, stroke, noninsulin-dependent diabetes mellitus,
osteoporosis, depression, and anxiety among others
[4-7].
A systematic review has reported a consistent associa-
tion of higher health-related quality of life (HRQoL)
scores with higher PA lev els among healthy adults [1].
Physical activ ity has enhanced well-b eing and incre asing
physical functioning also in people with poor health [8]
or of advanced age [9]. Also higher physical fitness level
has been shown to be associated with higher levels of
HRQoL in the older and chronically diseased
* Correspondence:
1
Department of Physical Medicine and Rehabilitation, Central Hospital,
Jyväskylä, Finland
Häkkinen et al. Health and Quality of Life Outcomes 2010, 8:15
/>© 2010 Häkkinen et al; licensee BioMed Central Ltd. This is an Open Access article distributed under the terms of the Creative
Commons Attribution License ( which permits u nrestricted use, distribution, and
reproduction in any medium, provided the original work is properly cited.
populations [10-12]. However, there is insufficient evi-
dence regarding the relationship between physical fitness
level and HRQoL in younger adults. One recent study
has reported associations bet ween cardiorespiratory fit-
ness and HRQoL in young males in United States navy.
They found a positive relationsh ip between submaximal
fitness test and mental and physica l components of
HRQoL [13]. There is still limited evidence on relati on-
ships of objectively measured fitness and individual
domains of HRQoL. Therefore, the aim of the present
study was to investigat e the impact of measured cardio-
vascular and musculoskeleta l physical fitness level on
HRQoL in Finnish young men.
Methods
The study participants were enrolled from April 2008 to
November 2008 during eighth refresher course orga-
nized in different counties around the c ountry; thus,
they geographically represent the entire country. Of
1,155 i nvited reservists, 922 participated in the courses
and 845 men volunteered for the present study. During
the analysis phase, a further 118 participants were
excluded bec ause they had missed physical fitness tests
(if any of the endurance or muscle fitness test results
were missing, the physical fitness index [PFI] could not
be calculated). Thus, the final study group consisted of
727 men wi th mean (SD) age of 25 (5) years. The parti-
cipants signed a written consent form indicating that
they were aware of the risks and benefits of the study.
The study was approved by the ethical committees of
the University of Jyväskylä and the Central Finland
Health Care District, as well as the Headquarters of the
Finnish Defence Forces.
Measurements
HRQoL
In public health and in medicine, the concept of health-
related quality of life refers to a person’s or group’sper-
ceived physical and mental health over time. In this
study HRQoL data were collected using the Finnish
Rand 36-item health survey 1.0, which was developed
from the original 36-Item Short Form Health Survey
(SF-36) [14]. RAND-36 measures eight dimensions: gen-
eral health, physical functioning, role limitation physical,
role limitation emotional, vitality, mental health, social
functioning, and bodily pain. There is a 0-100 range in
each subscale, with higher scores indicating higher
HRQoL. The reliability and validity of the scale has
reported to be good (Cronbach’s alpha coefficients for 8
dimensions varied between 0.80 a nd 0.94), but ceiling
effects were detected for physical functioning, role lim-
itation physical and social functioning dimensions and
floor effect for role limitation physical, role limitation
emotional dimensions [14]. The age- and sex-weighted
Finnish general population was used as a reference
study group [14].
Physical fitness index (PFI)
Oxygen uptake (VO
2
max) was indirectly measured using
a bicycle ergometer test (Ergo line 800 S, Ergoselect 100
K or 200 K, Bitz, Germany) [15]. The handlebars and
seats were individually adjusted. After a 5-min warm up,
the test began with a power output of 75 W, which was
increased by 25 W after every other minute. The pedal-
ling rate of 60 rpm was maintained throughout the test.
The heart rate (HR) was recorded continuously (Polar
Vantage N V or S610, S710 or S810 , Kempele, Finland).
The test was terminated at volitional exhaustion, includ-
ing a decrease in the pedalling rate to be low 50 rpm.
Predicted VO
2
max was determined from the HR and
power (Fitware, Mikkeli, Finland), as follows: VO
2
max
(ml·kg
-1
·min
-1
) = [(P
max
* 12.48) + 217]/body mass,
where Pmax is maximal power. The test-retest repeat-
ability was r = 0.89 and 0.96 for women and men,
respectively [16].
Muscle fitness was measured by four consecutive
tests: grip strength, push-ups, sit-ups, and repeated
squats [14]. Before testing commenced, supervisors
demonstrated the technically correct way to perform
each test; they also controlled the performance techni-
que of each person. Isometric grip strength was mea-
sured in a sitting position (90° e lbow angle) by a
dynamometer (Saehan Corporation, Masan, South
Korea). The test was repeated twice separately for both
hands; the best results for the right and left hands were
averaged for the outcome [17]. Sit-ups, which measure
performan ce of abdominal and hip-flexor muscles, were
done with each subject lying supine on the floor with
his hands behind the neck and directing his elbows for-
ward. The knees were flexed at an angle of 90°, the legs
were slightly apart, and the assistant supported the
ankles. During the movement, the each subject lifted his
upper body and touched his elbows to the knees. Push-
ups, which measure performance of arm- and shoulder-
extensor muscles, were started from the lowest face-
down position. Each subject’s hands were kept
shoulder-wide and level. The fingers were directed for-
ward, and the legs were kept parallel and close to each
other.Duringthemovement,thearmswerefully
extended and the torso was straightly tensed. In the sec-
ond phase, the torso was lowered down to an elbow
angle of 90°. Repetitive squats measure the strength of
thekneeextensors.Thesubject was standing with feet
just inside shoulder width apart and squat was p er-
formed until the thighs were horizontal. The results of
the push-ups, sit-ups, and repeated squats were
expressed as the number of correctly performed repeti-
tions within 60 s. The recovery time between each of
the tests was 5-10 min.
Häkkinen et al. Health and Quality of Life Outcomes 2010, 8:15
/>Page 2 of 8
In PFI calculations the absolute results for each mus-
cle fitness test were scored to corresponding fitness
categories from poor (1.0-1.9) to excellent (5.0-5.9). The
total muscle fitness index was the sum of 4 muscle fit-
ness tests. Finally PFI was determined utilizing an
adjusted nomogram” where aerobic fitness and muscle
fitness are equally important (50 and 50%). Accordingly,
the PFI also had five different categories: excellent (5.0-
5.9), good (4.0-4.9), satisfactory (3.0-3.9), fair (2.0-2.9),
and poor (1.0-1 .9). For statistical analyses, the PFI was
categorized as poor (combination of categories fair and
poor), satisfactory, or good (go od and excellent) [ 17].
The reference values are based on the results of 3635
civilians and include 5 year age-specific categories [18].
These VO2max and muscle fitness tests have been used
during this past decade (2000-2009) in the Finnish
Defense Forces in order to follow-up the fitness compo-
nents of professional soldiers and reservists and, in addi-
tion, to find out the general population based trends in
fitness changes.
LTPA
The frequency and intensity of week ly LTPA was deter-
mined from responses to a single question with six cate-
gories: (1) no physical a ctivity at all , (2) some physical
activity without feeling out of breath or sweating, (3)
physical activity with feeling out of breath or sweating
once a week, (4) physical activity with feeling out of
breath or sweating twice a week, (5) physical activity
with feeling out of breath or sweating three times a
week, and (6) physical activity with feeling out of breath
or sweating at least four times a w eek. In the analysis,
the p articipants were recorded to three groups accord-
ing their physical activity level: low (combination of
LTPA categories 1 and 2), moderate (categories 3 and
4), or high (categories 5 and 6) [16].
Health examination
Height and weight were measured while the participants
were wearing lightweight clothing. Body mass index
(BMI) was classified in five categories: severe obesity,
≥35.0; obesity, 30.0-34.9; overweight, 25.0-29.9; normal
19.0-24.9; and underweight, ≤18.9. Body fat and lean
mass percentages were recorded using the eight-polar
bioimpedance method with multifrequency current
(InBody 720; Biospace Company, Seoul, Korea). Bioim-
pedance was performed in t he postabs orbt ive state after
a 12-hour overnight fast and the day preceding the mea-
surement day was a rest day from intensive exercise. For
men th e test-retest reliability of the device has shown to
be high (ICC 0.9995) and no significant mean (SD) dif-
ference was found for body fat between two trials [20.98
(8.88)% and 21.00 (8.83)% [18].
Alcohol and tobacco product use was determined by a
questionnaire. In addition, a number of self-reported
morbidities that had been diagnosed by medical doctors
were discovered by asking the respondents if they had
pulmonary or h eart disease, hypertension, infla mmatory
joint disease, or musculoskeletal disease. Self- perceived
general health was assessed using a visual analogue
scale, and self-perceived physical fitness compared to
age mates was asked using five categories (highly lower,
somewhat lower, equal, somewhat better, highly better).
Statistics
The results are provided as means with standard devia-
tion (SD) or 95% confidence level (CI). The normality of
variables was evaluated by Kolmogorov-Smirnoff test
and by means of histograms. The statistical significance
of characteristics among the groups was evaluate d by
analysis of variance (ANOVA). If the variables did not
fill normality assumptions, Kruskal-Wallis nonpara-
metric test with appropriate pair-wise comparisons or
chi-square test was used. The Finnish population values
for the eight dimensions were weighted to match the
age distribution of the study population. Associations
between HRQoL and the explanatory parameters (age,
LTPA, BMI, tobacco use, and morbidities) were ana-
lyzed using the logistic regression analysis mod el. Before
regression analysis Spearman’s Rank correlation coeffi-
cient was used to give an indication of the magnitude of
association (collinearity) between explanatory variables
andtheywereconsideredhighly associated if their cor-
relation coefficient was greater than 0.7.
Results
When the participants w ere grouped according their
objectively measured physical fitness indices (PFI) 45%
of them belong to the poor, 37% to the satisfactory and
18% to the good fitness category. The mean (SD) PFIs
were 2.44 (0.35), 3.43 (0.28), and 4.61 (0.47), respec-
tively. T he mean (SD) age of all of the participants was
25 (5) years (range 20-47). Mean (SD) BMI was 25 (4)
(range 16.8-43.1); 60% of the participants had a normal
BMI, 31% were overweight, and 9% were obese. Men in
higher PFI categories had a lower BMI and a lower pro-
portion of body fat (Table 1). The correlation between
BMI and body fat was 0.81 (0.79 to 0.84). The lean body
mass proportion did not differ among the PFI groups.
The proportion of tobacco use increased with decreas-
ing PFI. Self-perceived general he alth was lower in the
poor PFI group. The number of other morbidities did
not differ among the groups. The most commonly
reported morbidities were musculoskeletal disease (n =
171), pulmonary or heart disease (n = 45), and hyperten-
sion (n = 34).
In the poor objectively measured PFI group, 45% of
the participants g rade d their self-perceived physical fit-
ness as lower c ompared to age mates, while 9% graded
it as higher (Table 1). In the good PFI group, the
Häkkinen et al. Health and Quality of Life Outcomes 2010, 8:15
/>Page 3 of 8
respective pro portions were 1% and 67%. A higher fre-
quency of LTPA was associated with a higher PFI. The
correlation between P FI and LTPA was 0.49 (95% CI
0.44-0.55).
A higher HRQoL score in the general health, physical
functioning, vitality and mental h ealth, dimensions was
associated with a higher PFI (Table 2). When the
HRQoL of the participants was compared with that of
the age- and gender-weighted Finnish population both
the good and the satisfactory PFI participants had a
higher HRQoL than the general population in all of the
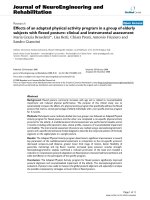
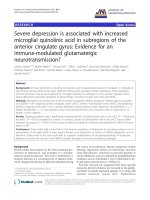
dimensions except for bodily pain (Figure 1). In the
poor physical fitness group, role limitation physical,
mental health and social functioning dimensions were
on a higher level compared to the general population.
Regression analysis re vealed that a lower number of
morbidities was related to a higher HRQoL in all eight
dimensions (Table 3). Both higher PFI and LTPA wer e
associated with general health and physical functioning
and higher LTPA with the vitality dimension. Lower age
was associated with better physical functioning, while
higher age with bet ter role limitation emotional, vitality,
and mental health.
Discussion
Results of the p resent study showed in a relatively large
sample of Finnish men that higher PFI was associated
with more favorable s cores in the general health, physi-
cal functioning, mental hea lth, and vit ality dimensions
of HRQoL. The importance of PFI was supported by
our finding that the good and satisfactory PFI groups
had a higher HRQoL score in all of the dimensions
except for bodily pain, comp ared to the reference values
of the age- and gender-weighted Finnish population.
The lack of difference in the bodily pain dimension may
reflect the fact that the number of morbidities did not
differ among the fitness categories. Previous studies
have shown that cardiorespiratory fitness is associated
with physical functioning in 40-65-year-old participants
with diabetes [19] and 40-60-year-old Finnish men
Table 1 Sample characteristics by physical fitness index
Variable Physical fitness index P-value between
the groups
Poor
(n = 328)
Satisfactory
(n = 271)
Good
(n = 128)
Age in years, mean (SD) 25 (3) 25 (5) 27 (7) 0.29
Weight, kg, mean (SD) 85 (15) 78 (10) 73 (9) < .0.001
Height, cm, mean (SD) 180 (6) 180 (6) 179 (6) 0.19
Body mass index, n (%) < .0.001 *
<19 8 (3) 8 (3) 3 (2)
19-24.9 138 (42) 173 (64) 106 (83)
25-29.9 127 (39) 79 (29) 18 (14)
≥30 53 (16) 11 (4) 1 (1)
Body fat, mean (SD) 21.3 (6.9) 16.1 (5.7) 12.0 (4.5) < 0.001
Lean body mass, mean (SD) 65.9 (8.2) 65.3 (7.1) 64.3 (6.6) 0.19
Alcohol users ≥ once a week, n (%) 219 (67) 175 (65) 74 (58) 0.20
Tobacco users, n (%) 161 (49) 85 (32) 20 (16) < 0.001
Snuff users, n (%) 12 (4) 20 (7) 4 (3) 0.062
Self perceived general health, mean(SD) 25 (19) 21 (18) 18 (15) < 0.001
Self-reported morbidities, n (%) 110 (33) 82 (30) 40 (31) 0.72 *
Self perceived physical fitness compared to age mates, n (%) < 0.001 *
Highly lower 6 (2) 3 (1) 0(0)
Somewhat lower 141 (43) 23 (9) 2 (1)
Equal 152 (46) 128 (47) 41 (32)
Somewhat better 27 (8) 96 (35) 61 (48)
Highly better 2 (1) 21 (8) 24 (19)
Self-reported leisure time physical activity, n (%) < 0.001
Low 159 (48) 53 (20) 8 (6)
Moderate 134 (41) 109 (40) 44 (34)
High 36 (11) 108 (40) 76 (59)
ANOVA or it’s nonparametric equivalent Kruskall-Wallis-test
* Chi-square
Häkkinen et al. Health and Quality of Life Outcomes 2010, 8:15
/>Page 4 of 8
working in blue-coll ar o ccupations [6]. When we
repeated regression analysis of our study group and
entered VO
2
max and muscle fitness index separately in
the model, instead of combined PFI, VO
2
max was asso-
ciated with ge neral health perception and muscle fitness
index was associated with physical functioning and gen-
eral health perception (data not shown). A recent study
including healthy 18-49 years old men from United
States navy showed a positive relationship between sub-
maximal exercise test and mental and physical health
components of HRQoL [13].
The results presented here provide support for earlier
findings of c ross-sectional studies, which showed that
higher levels of LTPA were associated with certain
HRQoL dimensions [20-22]. Vuillemin et al. (2005)
reported that in men, LTPA was related to all of the
other dim ensions except for emotional role functioning
[20].Wendel-Vosetal.(2004)showedthatmeeting
recommended levels of physical activity (at least 30 min-
utes of moderate LTPA per d ay) was associated w ith
higher HRQoL scores in all dimension [22]. When inter-
preting our results and the results of others, it is impor-
tant to note that some participants may under- or
overestimate the intensity of their LTPA. In the present
study, over half of the participants in the poor PFI cate-
gory reported that their LTPA was moderate or high,
Table 2 Health related quality of life (RAND-36) in 727 Finnish young men according to their physical fitness index
(PFI)
PFI-groups P-value between the groups*
Low
Mean (95% Cl)
Satisfactory
Mean (95% Cl)
High
Mean (95% Cl)
General health perception 70.0 (67.4 to 72.5) 74.5 (72.4 to 76.7) 74.2 (72.2 to 76.3) < 0.001
Physical functioning 95.2 (94.0 to 96.3) 95.5 (94.6 to 96.4) 97.6 (96.3 to 98.9) < 0.001
Role limitation physical 93.9 (91.1 to 96.8) 92.4 (89.1 to 95.8) 91.9 (88.9 to 94.7) 0.98
Role limitation emotional 87.9 (83.6 to 92.2) 89.5 (85.4 to 93.6) 93.9 (90.8 to 97.0) 0.78
Vitality 68.5 (65.6 to 71.5) 74.5 (72.2 to 76.7) 71.3 (69.3 to 73.3) 0.034
Mental health 78.8 (76.5 to 81.1) 81.179.0 to 83.1) 78.6 (76.8 to 80.4) 0.029
Social functioning 90.9 (88.4 to 93.5) 88.8 (86.4 to 91.1) 92.8 (90.9 to 94.7) 0.32
Bodily pain 80.6 (77.7 to 83.4) 81.6 (79.3 to 83.9) 79.3 (76.8 to 81.8) 0.35
* Kruskall-Wallis test
Figure 1 Health-related quality of life dimensions (SF-36) of Finnish young men compared to age-match ed male population.(means
with 95 percent confidence intervals). Line shows age adjusted values of general population.
Häkkinen et al. Health and Quality of Life Outcomes 2010, 8:15
/>Page 5 of 8
while some of the participants in the good PFI category
reported that it was low. Some respondents may not
perceive their activity as sufficiently moderate or vigor-
ous, and may have underestimated their LTPA level.
Likewise, some respondents may have misreported their
PA levels to reflect the socially desirable nature of PA
participation; thus, they may have overestimated their
LTPA level [23]. However, we found that both self-
reported LTPA levels and measured PFIs were asso-
ciated with the general health perception and physical
functioning dimension. Our finding that LTPA was also
associated with vitality dimension is supported by a
review by Puetz (2006) showing that people who are
physically active in their leisure time have about a 40%
reduced risk of experiencing feelings of low energy and
fatigue compared to sedentary people [24].
InthegoodPFIgroup,wefoundthattheproportion
of body fat was lower than in the low PFI group. How-
ever, the amount of lean body mass did not differ
among the PFI groups, although BMI increased with
decreasing PFI. BMI was not associated with HRQoL.
Further,whenthepercentageofbodyfatwasentered
into the regression model instead of BMI, the only sta-
tistically significant association we found was that a high
body fat percent age was associated wit h the better men-
tal health dimension (data not shown). The findings of
previous studi es of the effect of body weight on HRQoL
are controversial. S ome studies have reported that obese
adolescents have a poorer HRQo L tha n lean individuals
[25]. On the other hand, in accord ance with our results,
other studies did not find a s ignificant relationship
between B MI and HRQo L [26]. These confounding
results of different studies may be partly explained by
differences in the gender, sample size, age, and range of
BMI of the participants. Furthermore, it is possible for a
healthy, well-trained muscular individual with very low
body fat to be classified as obese using the BMI formula.
However, higher body fatne ss and lower physical fitness
has re ported to be associ ated with metabolic risk factors
even in late adolescent college students thus increa sing
the risk of chronic diseases later in life [27].
Morbidities were an important explanatory variable of
the impairments found in all eight HRQoL dimensions.
The diseases that were reported decreased the physical,
mental, and social functioning of the participants. A
previous study showed that musculoskeletal pain has a
negative effect on the HRQoL of elderly people living in
Turkey [28]. A German study found that general prac-
tice patients with chronic diseases had impaired quality
of life, particularly with regard to physical health [29].
The i ndependent effects of the morbidities on HRQoL
varied depending upon the type of chronic disease:
HRQoL appeared to be more affected by diseases such
as depression, back pain, osteoarthritis of the knee, and
cancer than by hypertension and diabetes [30]. Asymp-
tomatic status and health risks such as hypertension or
MBO were reported to be less likely to affect quality of
life [29,31], while study participants were more con-
scious of and thus affected by p hysical medical symp-
toms leading to a discernable limitation in performance
[32,33].
In Finland a universal male conscription is in place,
under which all men above 18 years of age serve for 6, 9
or 12 months, these reservists which are invited to the
refresher courses represent rather well Finnish young
men. Some of the reservists f rom which we drew our
study participants were unable to attend the courses
because of personal or social reasons or health condi-
tions, or because they were living abroad. Thus, a limita-
tion of the present study is that we do not know the
characteristics of those reservists who did not enter the
courses. It was previousl y suggested that males may
underestimate problems of functional cap acity and pai n
on quest ionnaires [32,34], which may also have affected
the data regarding our study participants. The range of
the age was 20-47 years. Increasing age does not neces-
sarily cause a reduction in the quality of life, but it may
shift the emphasis of it as shown with t he present data.
Although 32% of the participants had self-report ed
Table 3 Logistic regression analysis of eight HRQoL dimensions (RAND-36).
General health
perception
Physical
functioning
Role limitation
physical
Role limitation
emotional
Vitality Mental
health
Social
functioning
Bodily pain
Age 0.98 (0.94 to 1.01) 0.96(0.92 to
0.99)*
1.00(0.95 to 1.04) 1.05(1.00 to 1.10)* 1.08(1.03 to
1.12)*
1.05(1.01 to
1.09)*
1.02(0.98 to
1.06)
0.98(0.94 to
1.01)
PFI 1.63 (1.27 to 2.09)* 1.56(1.19 to
2.05)*
1.05(0.77 to 1.43) 1.09(0.84 to 1.42) 1.15(0.91 to
1.45)
1.01(0.80 to
1.28)
1.09(0.87 to
1.37)
1.09(0.86 to
1.39)
LTPA 1.27 (1.12 to 1.43)* 1.28(1.12 to
1.46)*
0.99(0.85 to 1.16) 1.03(0.90 to 1.17) 1.12(1.00 to
1.26)*
1.01(0.90 to
1.14)
1.05(0.93 to
1.17)
1.08(0.96 to
1.22)
BMI 1.01 (0.96 to 1.06) 0.98(0.93 to
1.03)
1.01(0.95 to 1.08) 1.01(0.96 to 1.07) 1.04(0.99 to
1.09)
1.02(0.97 to
1.07)
1.05(1.00 to
1.10)
1.00(0.96 to
1.06)
Morbidities 0.47 (0.33 to 0.65)* 0.30(0.21 to
0.43)*
0.39(0.26 to 0.59)
*
0.60(0.42 to 0.85)* 0.61(0.44 to
0.84)*
0.62(0.45 to
0.86)*
0.56(0.41 to
0.77)*
0.24(0.17 to
0.34)*
Only those variables are shown which were entered into model.
Häkkinen et al. Health and Quality of Life Outcomes 2010, 8:15
/>Page 6 of 8
morbidities, the ceiling effect was over 15% in 5 out of 8
dimensions of HRQoL (physical functioning, role limita-
tion physical, role limitation emotional, social function-
ing and bodily pain). However, although this is a cross-
secti onal study, the s trength of thi s study is that partici-
pants’ subjective perspectives on physical fitness and
health were accompanied by objective measurements of
maximal aerobic capacity and muscle endurance, mak-
ing the findings more accurate and dependable.
Conclusions
The present study on Finnish young adult men showed
that higher physical fitness and leisure-time physical
activity level promotes certain dimensions of HRQoL,
and the higher number of morbidities impairs all of
them. Because physical fitness was associated with the
young men’s HRQoL and health and, thus, their value
to the present and future labour force, feasible methods
to promote PA levels and thereby HRQoL in young
men should be pursued.
Acknowledgements
This work was supported by The Scientific Committee for National Defense
Author details
1
Department of Physical Medicine and Rehabilitation, Central Hospital,
Jyväskylä, Finland.
2
Department of Health Sciences, University of Jyväskylä,
Jyväskylä, Finland.
3
UKK-Institute for Health Promotion Research, Tampere,
Finland.
4
The National Institute for Health and Welfare, Helsinki, Finland.
5
Defence Command, Personnel Division, Finnish Defence Forces, Finland.
6
Department of Biology of Physical Activity, University of Jyväskylä, Jyväskylä,
Finland.
Authors’ contributions
The authors of this manuscript state that all of them have contributed
substantially to manuscript preparation. All authors read and approved the
final manuscript.
Competing interests
The authors declare that they have no competing interests.
Received: 8 July 2009
Accepted: 29 January 2010 Published: 29 January 2010
References
1. Bize R, Johnson JA, Plotnikoff RC: Physical activity level and health-related
quality of life in the general adult population: a systematic review. Prev
Med 2007, 45:401-15.
2. US Department of Health and Human Services. Physical activity
guidelines for Americans. 2008 />Accessed 4 July 2009.
3. Eurobarometer on Health and Food. 2005 />datapage.asp?id=4695.
4. Fogelholm M, Männistö S, Vartiainen E, Pietinen P: Determinants of energy
balance and overweight in Finland 1982 and 1992. Int J Obes Relat Metab
Disord 1996, 20:1097-1104.
5. Penedo FJ, Dahn JR: Exercise and well-being: A review of mental and
physical health benefits associated with physical activity. Curr Opin
Psychiatry 2005, 18:189-193.
6. Sorensen LE, Pekkonen MM, Mannikko KH, Louhevaara VA, Smolander J,
Alen MJ: Associations between work ability, health-related quality of life,
physical activity and fitness among middle-aged men. Appl Ergon 2008,
39:786-791.
7. Weyer SKB: Physical exercise and psychological health. Sport Med 1994,
17:108-116.
8. McAuley E, Bane SM, Rudolph DL, Lox CL: Physique anxiety and exercise
in middle-aged adults. J Gerontol B Psychol Sci Soc Sci 1995, 50:P229-35.
9. Rejeski WJ, Mihalko SL: Physical activity and quality of life in older adults.
J Gerontol A Biol Sci Med Sci 2001, 56(Spec No 2):23-35.
10. Lavie CJ, Milani RV: Disparate effects of improving aerobic exercise
capacity and quality of life after cardiac rehabilitation in young and
elderly coronary patients. J Cardiopulm Rehabil 2000, 40:235-40.
11. Rejeski WJ, Lang W, Neiberg RH, Van Dorsten B, Foster GD, Maciejewski ML,
Rubin R, Williamson DF, Look AHEAD Research Group: Correlates of health-
related quality of life in overweight and obese adults with type 2
diabetes. Obesity 2006, 14:870-83.
12. Shibata A, Oka K, Nakamura Y, Muraoka I: Recommended level of physical
activity and health-related quality of life among japanese adults. Health
Qual Life Outcomes 2007, 5:64.
13. Sloan RA, Sawada SS, Martin CK, Church T, Blair SN: Associations between
Cardiorespiratory Fitness and Health-Related Quality of Life Health. Qual
Life Outcomes 2009, 7:47.
14. Aalto A-M, Aro S, Aro A, Mähönen M: Rand 36-item health survey 1,0.
Suomenkielinen versio terveyteen liittyvästä elämänlaadun kyselystä.
Kyselylomake ja käyttöohjeet. Abstract in English Helsinki, Finland: Stakes
1995.
15. Fogelholm M, Malmberg J, Suni J, Santtila M, Kyröläinen H, Mäntysaari M:
Waist circumference and BMI are independently associated with the
variation of cardio-respiratory and neuromuscular fitness in young adult
men. Int J Obes (Lond)
2006, 30:962-969.
16. Fogelholm M, Malmberg J, Suni J, Santtila M, Kyröläinen H, Mäntysaari M,
Oja P: International Physical Activity Questionnaire: Validity against
fitness. Med Sci Sports Exerc 2006, 38:753-60.
17. Kyröläinen H, Häkkinen K, Kautiainen H, Santtila M, Pihlainen K, Häkkinen A:
Physical fitness, BMI and sickness absence in male military personnel.
Occup Med (Lond) 2008, 58:251-256.
18. Kyröläinen H, Häkkinen A, Kautiainen H, Santtila M, Pihlainen K, Häkkinen K:
Puolustusvoimien palkatun henkilöstön fyysistä suorituskykyä mittaavan
testimenetelmän viitearvoluokittelun ja kuntoindeksin validointitutkimus.
Fyysisen kunnon, painoindeksin ja sairauspoissaolojen väliset yhteydet.
Pääesikunta, Koulutusosasto 2006, ISBN 951-25-1677-2.
19. Bennett WL, Ouyang P, Wu AW, Barone BB, Stewart KJ: Fatness and fitness:
How do they influence health-related quality of life in type 2 diabetes
mellitus?. Health Qual Life Outcomes 2008, 6:110.
20. Vuillemin A, Boini S, Bertrais S, Tessier S, Oppert JM, Hercberg S, Guillemin F,
Briancon S: Leisure time physical activity and health-related quality of
life. Prev Med 2005, 41:562-569.
21. Brown DW, Balluz LS, Ford ES, Giles WH, Strine TW, Moriarty DG, Croft JB,
Mokdad AH: Associations between short- and long-term unemployment
and frequent mental distress among a national sample of men and
women. J Occup Environ Med 2003, 45:1159-1166.
22. Wendel-Vos GC, Schuit AJ, Tijhuis MA, Kromhout D: Leisure time physical
activity and health-related quality of life: Cross-sectional and
longitudinal associations. Qual Life Res 2004, 13:667-677.
23. Brown DW, Balluz LS, Giles WH, Beckles GL, Moriarty DG, Ford ES,
Mokdad AH, behavioral risk factor surveillance system (BRFSS): Diabetes
mellitus and health-related quality of life among older adults. findings
from the behavioral risk factor surveillance system (BRFSS). Diabetes Res
Clin Pract 2004, 65:105-115.
24. Puetz TW: Physical Activity and Feelings of Energy and Fatigue:
Epidemiological Evidence. Sports Med 2006, 36:767-80.
25. de Beer M, Hofsteenge GH, Koot HM, Hirasing RA, Delemarre-van de
Waal HA, Gemke RJ: Health-related-quality-of-life in obese adolescents is
decreased and inversely related to BMI. Acta Paediatr 2007, 96:710-714.
26. Kruger J, Bowles HR, Jones DA, Ainsworth BE, Kohl HW, Health-related
quality of life, BMI and physical activity among US adults (>/= 18 years):
National physical activity and weight loss survey, 2002. Int J Obes (Lond)
2007, 31:321-327.
27. Sacheck JM, Kuder JF, Economos CD: Physical Fitness, Adiposity and
Metabolic Risk Factors in Young College Students. Med Sci Sports Exerc
2009.
28. Cavlak U, Yagci N, Bas Aslan U, Ekici G: A new tool measuring health-
related quality of life (HRQOL): The effects of musculoskeletal pain in a
group of older Turkish people. Arch Gerontol Geriatr 2008.
Häkkinen et al. Health and Quality of Life Outcomes 2010, 8:15
/>Page 7 of 8
29. Wang HM, Beyer M, Gensichen J, Gerlach FM: Health-related quality of life
among general practice patients with differing chronic diseases in
Germany: Cross sectional survey. BMC Public Health 2008, 8:246.
30. Rijken M, van Kerkhof M, Dekker J, Schellevis FG: Comorbidity of chronic
diseases: effects of disease pairs on physical and mental functioning.
Qual Life Res 2005, 14:45-55.
31. Schwartz CE, Sprangers MA: Methodological approaches for assessing
response shift in longitudinal health-related quality-of-life research. Soc
Sci Med 1999, 48:1531-1548.
32. Häkkinen A, Kukka A, Onatsu T, Järvenpää S, Heinonen A, Kyröläinen H,
Tomas-Carus P, Kallinen M: Health-related quality of life and physical
activity in persons at high risk for type 2 diabetes. Disabil Rehabil 2008.
33. Cummins R, Lau A, Stokes M: HRQOL and subjective well-being:
Noncomplementary forms of outcome measurement. Expert Rev
Pharmacoecon Outcomes Res 2004, 4:413-420.
34. Wingard DL: The sex differential in morbidity, mortality, and lifestyle.
Annu Rev Public Health 1984, 5:433-458.
doi:10.1186/1477-7525-8-15
Cite this article as: Häkkinen et al.: Association of physical fitness with
health-related quality of life in Finnish young men. Health and Quality of
Life Outcomes 2010 8:15.
Submit your next manuscript to BioMed Central
and take full advantage of:
• Convenient online submission
• Thorough peer review
• No space constraints or color figure charges
• Immediate publication on acceptance
• Inclusion in PubMed, CAS, Scopus and Google Scholar
• Research which is freely available for redistribution
Submit your manuscript at
www.biomedcentral.com/submit
Häkkinen et al. Health and Quality of Life Outcomes 2010, 8:15
/>Page 8 of 8