The additive effects of GS3 and qGL3 on rice grain length regulation revealed by genetic and transcriptome comparisons
Bạn đang xem bản rút gọn của tài liệu. Xem và tải ngay bản đầy đủ của tài liệu tại đây (2.41 MB, 13 trang )
Gao et al. BMC Plant Biology (2015) 15:156
DOI 10.1186/s12870-015-0515-4
RESEARCH ARTICLE
Open Access
The additive effects of GS3 and qGL3 on
rice grain length regulation revealed by
genetic and transcriptome comparisons
Xiuying Gao1†, Xiaojun Zhang1,2†, Hongxia Lan1, Ji Huang1, Jianfei Wang1* and Hongsheng Zhang1*
Abstract
Background: Grain length, as a critical trait for rice grain size and shape, has a great effect on grain yield and
appearance quality. Although several grain size/shape genes have been cloned, the genetic interaction among these
genes and the molecular mechanisms of grain size/shape architecture have not yet to be explored.
Results: To investigate the genetic interaction between two major grain length loci of rice, GS3 and qGL3, we developed
two near-isogenic lines (NILs), NIL-GS3 (GS3/qGL3) and NIL-qgl3 (gs3/qgl3), in the genetic background of 93–11 (gs3/qGL3)
by conventional backcrossing and marker-assisted selection (MAS). Another NIL-GS3/qgl3 (GS3/qgl3) was developed by
crossing NIL-GS3 with NIL-qgl3 and using MAS. By comparing the grain lengths of 93–11, NIL-GS3, NIL-qgl3 and NIL-GS3/
qgl3, we investigated the effects of GS3, qGL3 and GS3 × qGL3 interaction on grain length based on two-way ANOVA.
We found that GS3 and qGL3 had additive effects on rice grain length regulation. Comparative analysis of primary panicle
transcriptomes in the four NILs revealed that the genes affected by GS3 and qGL3 partially overlapped, and both loci
might be involved in brassinosteroid signaling.
Conclusion: Our data provide new information to better understand the rice grain length regulation mechanism and
help rice breeders improve rice yield and appearance quality by molecular design breeding.
Keywords: Additive effect, Grain length, GS3, qGL3, Rice, Transcriptome, Brassinosteroid
Background
When breeding cereal crops, the choice of a larger grain
can increase the yield of crop varieties when other yieldrelated traits remain relatively stable. Among the three
key components of rice yield (grain weight, panicles per
plant and grain number per panicle), grain weight has
high heritability [1]. Rice grains display a comparatively
geometric shape, which can be broken down into grain
length (GL), grain width (GW) and grain thickness (GT).
These size/shape traits combined with grain density can
explain the rice grain weight trait effectively.
Through linkage and association mapping, many quantitative trait loci (QTLs) for grain size/shape have been
identified in different mutants or natural populations [2].
* Correspondence: ;
†
Equal contributors
1
State Key Laboratory of Crop Genetics and Germplasm Enhancement/
Jiangsu Collaborative Innovation Center for Modern Crop Production,
Nanjing Agricultural University, Nanjing 210095, China
Full list of author information is available at the end of the article
Only a small portion of these loci have been cloned, including GS3 [3–5], GL3.1/qGL3 [6, 7] and TGW6 [8] for
grain length, and GW2 [9], GW5/qSW5 [10, 11], GS5 [12]
and GW8 [13] for grain width. Some grain size/shape
QTLs, such as gw8.1 [14], GW6 [15], qGL7 [16], qGL7-2
[17], GS7 [18] and qSS7 [19], were also mapped to a narrow chromosome region. Additionally, several small (or
short) seed phenotype causal genes were identified by
map-based cloning, including D1 [20–22], BU1 [23], SRS1
[24], SRS3 [25], SRS5 [26], and SG1 [27].
There are few reports about the genetic interaction of
these characterized genes [2]. Yan et al. (2011) found
genetic interactions between GS3 and qSW5. The effect
of qSW5 on seed length was masked by GS3 alleles, and
the effect of GS3 on seed width was masked by qSW5 alleles. No significant QTL interaction was observed between the two major grain width genes, GW2 and
qSW5/GW5, suggesting that they might work to regulate
grain width in independent pathways [28]. GS7 was effective in the presence of the GS3 non-functional A-
© 2015 Gao et al. This is an Open Access article distributed under the terms of the Creative Commons Attribution License
( which permits unrestricted use, distribution, and reproduction in any medium,
provided the original work is properly credited. The Creative Commons Public Domain Dedication waiver (http://
creativecommons.org/publicdomain/zero/1.0/) applies to the data made available in this article, unless otherwise stated.
Gao et al. BMC Plant Biology (2015) 15:156
allele and ineffective when combined with the functional
GS3 C-allele [18]. However, how these genes work together or interact with others has not been deeply explored. The genetic interaction between two major grain
length QTLs, GS3 and qGL3, also remains unclear. At
least four different alleles for GS3 were identified by Mao
et al. (2010): GS3-1 (Zhenshan 97), GS3-2 (Nipponbare),
GS3-3/gs3 (Minghui 63) and GS3-4 (Chuan 7). GS3-1 and
GS3-2 are functional short grain alleles, and GS3-4 is a
stronger functional extra-short grain forming allele. GS3-3
has a premature termination, resulting in a non-functional
long grain allele. At the cellular level, GS3 controls grain
size largely by modulating the longitudinal cell number in
grain glumes. Its organ size regulation domain in the Nterminus is necessary and sufficient for it to function as a
negative regulator and act as a dominant allele [3]. One of
its homologs in the rice genome, DENSE AND ERECT
PANICLE1, also functions as a negative regulator of rice
grain length [29, 30]. Recently, its homolog in Arabidopsis, AGG3, was shown to be an atypical heterotrimeric
GTP-binding protein (G-protein) γ-subunit that positively
regulated organ size [31, 32]. Another major grain-length
locus, GL3.1/qGL3, was map-based cloned and characterized by two independent groups [6, 7]. GL3.1/qGL3
encodes a putative protein phosphatase (OsPPKL1) containing two Kelch domains. Transgenic studies showed
that the Kelch domains functioned as a negative regulator
and were essential for the biological function of OsPPKL1.
At the cellular level, qGL3 functions by negatively modulating the longitudinal cell number in grain glumes.
In this study, we focused on the genetic interaction between two major grain length QTLs, GS3 and qGL3.
The functional and non-functional alleles of GS3 and
qGL3 were individually or simultaneously placed in the
genetic background of 93–11 (an indica rice cultivar) to
evaluate their genetic interaction. To understand these
interactions at the molecular level, we analyzed the transcriptomes of young panicles (3–6 cm, glume development stage) of the NILs combining different alleles of
GS3 and qGL3 through microarray assays. Our work
could be helpful to better understand the genetic and
molecular mechanisms of grain length regulation and
molecular design rice breeding.
Results
The additive effects of GS3 and qGL3 on grain length
Functional GS3 and non-functional qgl3 were introduced
into the 93–11 genetic background (genotype gs3/qGL3)
to generate NIL-GS3 (genotype GS3/qGL3) and NILqgl3 (genotype gs3/qgl3), respectively. By crossing NILGS3 with NIL-qgl3, and marker-assisted selection (MAS),
we created a third line, NIL-GS3/qgl3 (genotype GS3/
qgl3). The grain lengths of these three NILs and their recurrent parent 93–11 with different allele combinations of
Page 2 of 13
GS3 and qGL3 were analyzed (Fig. 1a). We applied a
two-way analysis of variance (ANOVA) for grain length
(four NILs) and genotype (GS3 and qGL3), and observed significant additive effects on grain length for
GS3 × qGL3 (P = 1.27 × 10⁻⁸), qGL3 (P = 3.71 × 10⁻¹³), and
GS3 (P = 4.4 × 10⁻¹⁵) (Table 1). Considering NIL-GS3
(GS3/qGL3) as the control background, the loss of GS3 increased the grain length from 8.5 mm (GS3/qGL3) to
10.2 mm (gs3/qGL3), the loss of qGL3 increased the grain
length from 8.5 mm (GS3/qGL3) to 11.2 mm (GS3/qgl3),
and the loss of both increased the grain length from
8.5 mm (GS3/qGL3) to 12.2 mm (gs3/qgl3). Loss of qGL3
increased grain length more in the functional GS3
background (~2.7 mm) than in the non-functional gs3
background (~2.0 mm). Similarly, loss of GS3 increased
grain length more in the functional qGL3 background
(~1.7 mm) than in the non-functional qgl3 background
(~1.0 mm) (Table 2). According to these data, we concluded that GS3 and qGL3 had additive effects larger
than genetic interaction on rice grain length regulation
and that the effects of qGL3 were stronger (Table 1).
The genetic interactions between GS3 and qGL3 on the
expression levels of commonly regulated genes
Based on the microarray data, by comparing the differentially expressed genes in gs3/qGL3 vs. GS3/qGL3,
GS3/qgl3 vs. GS3/qGL3, and gs3/qgl3 vs. GS3/qGL3, we
found that seven genes were commonly up-regulated
by > 1.5-fold (Fig. 1C, D and Table 3) and 37 genes were
down-regulated by < 0.67-fold (Fig. 1c, d). Using gene
expression levels (in 93–11 and its three NILs) and
genotype (GS3 and qGL3) as the main factors, we applied a two-way ANOVA to the datasets from all four
microarrays to identify the seven up-regulated genes significantly affected by GS3 and qGL3 (Table 3). There
were significant GS3 × qGL3 interactions for the expression levels of the seven up-regulated genes with P-values
< 0.05, except for Os03g40400 and Os04g59000 (Table 3).
Based on two-way ANOVA analysis, we found a significant genetic interaction between GS3 and qGL3 according to the expression levels of the genes down-regulated
by GS3 and qGL3 (Additional file 1: Table S7). Interestingly, the effects of GS3 and qGL3 on grain length was
additive, on the expression levels of the commonly regulated genes it showed significant genetic interaction.
Among the seven genes up-regulated (>1.5-fold) by
both gs3 and qgl3 (Fig. 1d), we found some encoded receptor protein kinases that might operate in the same
signaling pathways to increase grain length in rice and
explain the additive effects of gs3 and qgl3. Another
commonly up-regulated gene, Os11g44880, was found to
encode a kinesin-4, whose homolog, SRS3 (kinesin-13),
was reported to positively regulate rice grain length [25].
Among the genes commonly down-regulated by gs3 and
Gao et al. BMC Plant Biology (2015) 15:156
Page 3 of 13
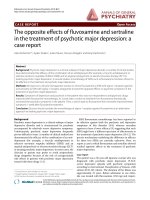
Fig. 1 Grains and plants of the NILs and comparison of their expression profiles. a Grains of the three NILs and their genetic background, 93–11.
Scale bar, 10.0 mm. b Plants of three NILs and their genetic background, 93–11. Scale bar, 20.0 cm. c Venn diagram of the genes from different
comparisons; red numbers indicate up-regulation, black indicates down-regulation. d Expression profiles of the genes commonly regulated by the
comparisons gs3/qGL3 vs. GS3/qGL3, GS3/qgl3 vs. GS3/qGL3 and gs3/qgl3 vs. GS3/qGL3
To reveal the genes affected by gs3 and qgl3, we compared the transcriptomes of the primary panicles of 93–
11 (gs3/qGL3) and its three NILs through microarray
analysis. Compared with the NIL-GS3 (GS3/qGL3) background, 92 genes were up-regulated by > 1.5-fold and
546 genes were down-regulated by < 0.67-fold in 93–11
(gs3/qGL3) (Fig. 1c). Comparing the transcriptomes of
NIL-GS3/qgl3 (GS3/qgl3) with those of NIL-qgl3 (gs3/
qgl3) and NIL-GS3 (GS3/qGL3) as well as 93–11 (gs3/
qGL3), we found that 11 genes were up-regulated
(Additional file 1: Table S1) and 15 genes were downregulated (Additional file 1: Table S2). Among the 11
Table 1 qGL3 × GS3 interactions resolved by two-way ANOVA
for grain length
Table 2 Grain length of the genetic background 93–11 and its
three NILs
qgl3 (Fig. 1d), we found that gs3 and qgl3 down-regulated a
gene (Os07g43670) encoding a ribonuclease T2 family
domain-containing protein by 46- and 34-fold, respectively.
Profiling of gene up- and down-regulation and gene
ontology analysis of DEGs in different genotypes
Trait
GL
Variation
SS
MS
df
F
NIL Name (Genotype)
P-value
−13
Grain length (mm)
ΔGrain length (mm)
qGL3
5.43
5.43
1
7407.29
3.71 × 10
NIL-GS3 (GS3/qGL3)
8.5 ± 0.18
–
GS3
16.45
16.45
1
22452.51
4.4 × 10⁻¹⁵
93-11 (gs3/qGL3)
10.2 ± 0.14
~1.7
qGL3 × GS3
0.39
0.39
1
537.57
1.27 × 10⁻⁸
Error
0.0058
0.0007
8
qGL3 × GS3, qGL3-by-GS3 interaction; SS, MS, df, F, and P-values are from
two-way ANOVA
NIL-GS3/qgl3 (GS3/qgl3)
11.2 ± 0.15
~2.7
NIL-qgl3 (gs3/qgl3)
12.2 ± 0.15
~3.7
Data are presented as means ± standard error. Δ Grain length shows the
difference in grain length compared with NIL-GS3
Gao et al. BMC Plant Biology (2015) 15:156
Page 4 of 13
Table 3 qGL3 × GS3 interactions resolved by two-way ANOVA for the expression level of commonly up-regulated genes
MSU_Gene_Symbol
Variation
SS
MS
df
F
P value
LOC_Os11g44880
qGL3
2285
2285
1
104.14
7.29 × 10−06
GS3
3436
3436
1
156.61
1.56 × 10−06
qGL3 × GS3
2001
2001
1
91.23
1.19 × 10−05
LOC_Os03g40400
LOC_Os03g64050
LOC_Os01g59990
LOC_Os04g59000
LOC_Os01g60280
LOC_Os03g40020
Error
176
22
8
qGL3
452326
452326
1
325.25
9.17 × 10−08
GS3
86328
86328
1
62.08
4.87 × 10−05
qGL3 × GS3
85
85
1
0.06
0.810638
Error
11126
1391
8
qGL3
9804786
9804786
1
196.20
6.55 × 10−07
GS3
5377938
5377938
1
107.61
6.45 × 10−06
qGL3 × GS3
871662
871662
1
17.44
0.003095
Error
399791
49974
8
qGL3
45189064
45189064
1
750.84
3.39 × 10−09
GS3
24588257
24588257
1
408.55
3.75 × 10−08
qGL3 × GS3
3695841
3695841
1
61.41
5.07 × 10−05
7.46
0.025761
Error
481476
60185
8
qGL3
4655
4655
1
GS3
23058
23058
1
36.98
0.000296
qGL3 × GS3
3165
3165
1
5.08
0.05433
Error
4989
624
8
qGL3
5192
5192
1
170.59
1.12 × 10−06
GS3
3204
3204
1
105.27
7 × 10−06
qGL3 × GS3
3152
3152
1
103.57
7.45 × 10−06
Error
243
30
8
qGL3
57233
57233
1
719.34
4.02 × 10−09
GS3
13718
13718
1
172.41
1.08 × 10−06
qGL3 × GS3
19992
19992
1
251.27
2.51 × 10−07
Error
637
80
8
qGL3 × GS3, qGL3-by-GS3 interaction; SS, MS, df, F, and P-values are from two-way ANOVA
commonly up-regulated genes, one gene (Os03g27530)
showed 18.7-fold induction under the NIL-GS3 (GS3/
qGL3) background and 41.4-fold induction under the
NIL-qgl3 (gs3/qgl3) background. It encoded a putative
serine carboxypeptidase of the peptidase S10 family
(Additional file 1: Table S1). Furthermore, we analyzed
the genes commonly up- and down-regulated by
qgl3 in both the NIL-qgl3 (gs3/qgl3) and NIL-GS3
(GS3/qGL3) backgrounds and found 33 up-regulated
genes and 30 down-regulated genes (Additional file 1:
Tables S3 and S4). By comparing the transcriptomes of
the panicles of NIL-qgl3 (gs3/qgl3) and NIL-GS3 (GS3/
qGL3), we found that 249 genes were up-regulated by >
1.5-fold and 237 were down-regulated by < 0.67-fold
(Fig. 1c). Among these, we found a down-regulated
gene, Os03g63970, encoding a GA20 oxidase involved
in the GA pathway. We also discovered that some genes
involved in BR signaling were differentially expressed, such
as a glycogen synthase kinase (CGMC_GSK) family gene
(Os05g04340) (Additional file 1: Table S6). The number of
down-regulated genes was higher than the number of upregulated genes for 93–11 and its three NILs.
To determine the identities of the differentially expressed
genes (DEGs), we categorized them based on their known
functions using gene ontology (GO) classifications. The
DEGs between combination I (GS3/qGL3 vs. gs3/qGL3
and GS3/qgl3 vs. gs3/qgl3), combination II (GS3/qGL3 vs.
GS3/qgl3 and gs3/qGL3 vs. gs3/qgl3) and combination III
(GS3/qGL3 vs. gs3/qgl3) were used to analyze the GO
pathways. These genes were associated with diverse biological, molecular and cellular functions, as shown in
Tables 4, 5 and 6. This functional grouping primarily serves
to facilitate data visualization. The functional classifications
of the DEGs regulated by gs3 were mainly associated
Gao et al. BMC Plant Biology (2015) 15:156
Page 5 of 13
Table 4 Significant functions of DEGs regulated by gs3
GO term
Description
Input
BG/Ref
p-value
FDR
GO: 0008152
Metabolic process
5
7746
0.018
0.018
GO: 0005488
Binding
8
8681
5.90E-05
0.00018
GO: 0003824
Catalytic activity
7
8329
0.00052
0.00078
GO terms, such as “biological process”, “molecular function” and “cellular
component”, were identified using AGRIGO ( />index.php) with default significance levels (FDR < 0.05). Input, gene number in
input list; BG/Ref, gene number in BG/Ref
with metabolic processes, catalytic activity, and binding
(Table 4). The gene Os03g27530, which is also called
OsSCP16, was associated with the GO:0008152 and
GO:0003824 classifications. Its homolog in Arabidopsis
thaliana is BRS1, which might participate in the BR
signaling pathway. Interestingly, we also found this
gene in combination III. The DEGs regulated by qgl3
were mainly associated with metabolic processes, cell
parts, catalytic activity, and binding (Table 5). According
to q-PCR verification, the gene Os02g56310 encoding a
calcium-dependent protein kinase was tremendously upregulated in NIL-qgl3 (gs3/qgl3), NIL-GS3/qgl3 (GS3/qgl3)
and 93–11 compared with NIL-GS3 (GS3/qGL3). Ca2+
sensor protein kinases are prevalent in most plant species
including rice. OsCPK31, which also encodes a calciumdependent protein kinase, played a significant role in the
grain filling process and eventually reduced the crop duration in overexpression plants [33]. The DEGs regulated
by both gs3 and qgl3 were associated with 51 GO terms,
which included the GO terms of gs3 and qgl3 (Table 6). Of
these GO terms in Table 6, many transcripts encoded proteins involved in cellular metabolic process such as NBARC domain containing protein, F-box domain containing
protein, zinc ion binding proteins and calcium-dependent
protein kinase isoform AK1. In addition to genes associated with cellular metabolic process, genes associated with
Leucine-Rich-Repeat (LRR) family protein and the calcium/calmodulin depedent protein kinases were annotated
with the GO term “signal transduction”. Os03g27530 and
Os02g56310 were also among the DEGs regulated by gs3
and qgl3. In addition, Os07g05880 encoding F-box domain
and kelch repeat containing protein, overlapping
Table 5 Significant functions of DEGs regulated by qgl3
GO term
Description
Input
BG/Ref
p-value
FDR
GO:0008152
Metabolic process
12
7746
1.00E-05
0.00012
GO:0005488
Binding
13
8681
4.20E-06
3.50E-05
GO:0003824
Catalytic activity
10
8329
0.00083
0.0035
GO:0043169
Cation binding
5
2582
0.0037
0.0076
GO:0043167
Ion binding
5
2584
0.0037
0.0076
GO terms, such as “biological process”, “molecular function” and “cellular
component”, were identified using AGRIGO ( />index.php) with default significance levels (FDR < 0.05). Input, gene number in
input list; BG/Ref, gene number in BG/Ref
expression of rice F-box protein encoding genes during
floral transition as well as panicle and seed development [34]. These results indicated that gs3 and qgl3
might participate in the same or parallel signaling pathways to regulate grain length.
Metabolic pathways, cellular response and cell regulation
analysis for DEGs
To identify genes related to metabolic reconfiguration in
the different combinations, the MapMan tool was used
to select and display the significantly regulated metabolic
pathways. From our results, the up- and down-regulated
genes were classified into 36 BINs.
By MapMan analysis of the DEGs regulated by gs3, we
found that most of the genes associated with the cell
wall, lipids, light reactions and secondary metabolism
showed down-regulation (Fig. 2a). Some genes related to
the cell wall were down-regulated by gs3, implying that
down-regulation of these cell wall-related genes may
negatively regulate cell wall formation. In our regulation overview, protein degradation and receptor kinases were the most frequent categories (Fig. 2d). In
the hormone metabolism BIN, it was found that
Os03g08500 was related with ethylene synsesis. Using
the cell regulation and cell response overview function
of MapMan, we found that genes related to protein
degradation, biotic/abiotic stress, enzyme families, and
transport were highly induced (Fig. 2c). In the protein
degradation BIN, four up-regulated genes (Os03g28990,
Os03g39230, Os03g27530 and Os03g37950) and one
down-regulated gene (Os07g05880) were involved in it.
Os03g27530 was in the protein degradation BIN and might
participate in the BR signaling pathway. Os03g28990
encoding a von Willebrand factor type A (vWA) domain containing protein might regulate rice vegetative
growth and development. However, in the cellular response overview we only found one gene (Os03g28190)
related with biotic stress (Fig. 2b). DEGs associated
with the cell wall, lipids, light reactions and secondary
metabolism showed up-regulation, while some genes
associated with the cell wall, lipids, and ascorbate and
glutathione metabolism were down-regulated by qgl3
(Fig. 3a). In the cellular response and cell regulation
overview, genes related to hormones (auxin signal
transduction), biotic/abiotic stress, RNA regulation of
transcription, protein degradation, receptor kinase signaling, the cell cycle and protein modification were the most
abundant (Fig. 3b, c). We further investigated three
genes that were in the cell cycle BIN, Os02g55720,
Os02g52360 and Os04g28420, all of which were upregulated by qgl3. Os02g55720 encoded a kind of cyclin
related to grain size regulation [6]. Os04g28420 encoded a
kind of peptidyl-prolyl isomerase, which was up-regulated
17.97-fold by qgl3 under the NIL-gs3/qgl3 background
Gao et al. BMC Plant Biology (2015) 15:156
Page 6 of 13
Table 6 Significant functions of DEGs regulated by both gs3 and qgl3
GO term
Description
Input
BG/Ref
p-value
FDR
GO:0050896
Response to stimulus
16
1462
1.90E-13
2.10E-11
GO:0006950
Response to stress
13
885
1.50E-12
8.50E-11
GO:0009987
Cellular process
28
8160
1.50E-11
5.60E-10
GO:0008152
Metabolic process
24
7746
1.20E-08
3.40E-07
GO:0044238
Primary metabolic process
21
6775
1.90E-07
4.30E-06
GO:0065007
Biological regulation
12
2280
1.00E-06
1.90E-05
GO:0007165
Signal transduction
7
604
1.70E-06
2.80E-05
GO:0044237
Cellular metabolic process
19
6475
2.40E-06
3.40E-05
GO:0008219
Cell death
6
429
3.50E-06
4.00E-05
GO:0016265
Death
6
429
3.50E-06
4.00E-05
GO:0016310
Phosphorylation
8
1080
7.60E-06
6.80E-05
GO:0009719
Response to endogenous stimulus
5
277
7.30E-06
6.80E-05
GO:0019538
Protein metabolic process
12
2770
7.50E-06
6.80E-05
GO:0006796
Phosphate metabolic process
8
1206
1.70E-05
0.00013
GO:0006793
Phosphorus metabolic process
8
1206
1.70E-05
0.00013
GO:0006468
Protein amino acid phosphorylation
7
887
2.00E-05
0.00014
GO:0043687
Post-translational protein modification
8
1236
2.00E-05
0.00014
GO:0043170
Macromolecule metabolic process
16
5520
2.60E-05
0.00016
GO:0044267
Cellular protein metabolic process
10
2166
3.00E-05
0.00018
GO:0006464
Protein modification process
8
1359
3.90E-05
0.00023
GO:0043412
Macromolecule modification
8
1406
5.00E-05
0.00027
GO:0044260
Cellular macromolecule
14
4801
9.40E-05
0.00049
GO:0050789
Regulation of biological process
9
2112
0.00015
0.00073
GO:0016043
Cellular component organization
5
618
0.00031
0.0015
GO:0050794
Regulation of cellular process
8
1964
0.00048
0.0022
GO:0009058
Biosynthetic process
10
3129
0.0006
0.0026
GO:0001883
Purine nucleoside binding
15
1171
1.40E-13
4.80E-12
GO:0001882
Nucleoside binding
15
1171
1.40E-13
4.80E-12
GO:0030554
Adenyl nucleotide binding
15
1171
1.40E-13
4.80E-12
GO:0017076
Purine nucleotide binding
15
1317
7.30E-13
1.50E-11
GO:0005524
ATP binding
14
1071
8.20E-13
1.50E-11
GO:0032559
Adenyl ribonucleotide binding
14
1074
8.50E-13
1.50E-11
GO:0032555
Purine ribonucleotide binding
14
1218
4.50E-12
5.90E-11
GO:0032553
Ribonucleotide binding
14
1218
4.50E-12
5.90E-11
GO:0000166
Nucleotide binding
15
1686
2.30E-11
2.70E-10
GO:0005488
Binding
27
8681
5.00E-10
5.20E-09
GO:0003824
Catalytic activity
25
8329
8.60E-09
8.20E-08
GO:0004713
Protein tyrosine kinase activity
6
224
8.60E-08
7.50E-07
GO:0005515
Protein binding
11
1789
7.00E-07
5.60E-06
GO:0004871
Signal transducer activity
5
212
2.00E-06
1.40E-05
GO:0060089
Molecular transducer activity
5
212
2.00E-06
1.40E-05
GO:0016740
Transferase activity
12
3496
7.50E-05
0.00049
GO:0004672
Protein kinase activity
7
1102
7.90E-05
0.00049
GO:0016787
Hydrolase activity
10
2556
0.00012
0.00069
Gao et al. BMC Plant Biology (2015) 15:156
Page 7 of 13
Table 6 Significant functions of DEGs regulated by both gs3 and qgl3 (Continued)
GO:0016773
Phosphotransferase activity
7
1238
0.00016
0.0009
GO:0004674
Serine/threonine kinase activity
6
949
0.00028
0.0015
GO:0016301
Kinase activity
7
1464
0.00044
0.0022
GO:0016491
Oxidoreductase activity
5
1141
0.0045
0.021
GO:0016772
Transferase activity, transferring
7
2197
0.0045
0.021
GO:0005886
Plasma membrane
9
494
1.00E-09
4.50E-08
GO:0016020
Membrane
12
4882
0.0016
0.036
GO terms, such as “biological process”, “molecular function” and “cellular component”, were identified using AGRIGO ( />with default significance levels (FDR < 0.05). Input, gene number in input list; BG/Ref, gene number in BG/Ref
(Additional file 1: Table S3). This indicated that qGL3
might regulate grain length through regulation of the
cell cycle. The regulation overview function of MapMan showed that DEGs associated with transcription
factors, protein modification, and protein degradation
were significantly regulated by qgl3 (Fig. 3d). In the
transcription factor BIN, it was found that some transcription factors, Os01g62130 encoding C2H2 zinc
finger family protein, Os04g49450 encoding MYB related
transcription and Os03g44540 encoding a CCAAT-box
binding protein. The MapMan analysis indicated that
some metabolic pathways were changed by allelic alterations at both loci, GS3 and qGL3 (Fig. 4a). We found
that genes associated with photorespiration, light reactions, lipids, the cell wall and secondary metabolism
were up-regulated, while genes related to lipids, the
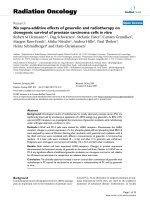
Fig. 2 Overview of the differentially expressed genes between GS3/qGL3 vs. gs3/qGL3 and GS3/qgl3 vs. gs3/qgl3. a Metabolism overview in MapMan.
b Cellular response overview in MapMan. c Cell regulation overview in MapMan. d Regulation overview in MapMan. Red, up-regulation; white, no
change; blue, down-regulation
Gao et al. BMC Plant Biology (2015) 15:156
Page 8 of 13
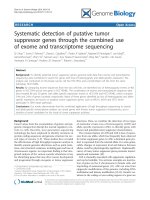
Fig. 3 Overview of the differentially expressed genes between GS3/qGL3 vs.GS3/qgl3 and gs3/qGL3 vs. gs3/qgl3. a Metabolism overview in MapMan.
b Cellular response overview in MapMan. c Cell regulation overview in MapMan. d Regulation overview in MapMan. Red, up-regulation; white, no
change; blue, down-regulation
TCA cycle, and ascorbate and aldarate metabolisms
were down-regulated (Fig. 4a). With cellular response
overview, DEGs associated with biotic/abiotic stress
and development were significantly regulated by both
gs3 and qgl3 (Fig. 4b). DEGs in BINs such as transcription factors, protein modification, protein degradation,
receptor kinases and hormones (ethylene, IAA and
GA) were up-regulated by gs3 and qgl3 (Fig. 4c, d). In
the GA synthesis overview, we found that a gene
(Os03g63970) related with GA20 oxidase was downregulated by both gs3 and qgl3. It is possible that BR and
GA interact closely to regulate cell elongation [35]. We
found that some DEGs encoded regulators, including two
transcription factors, a B3 DNA binding domain-containing
protein (Os03g42370) and three MYB family transcription
factor (Os06g14670, Os11g47460 and Os05g51160).
These regulators might take part in the same signaling
pathways to increase grain length in rice, which would
explain the additive effects of gs3 and qgl3 (Additional
file 1: Table S5). Overall, through MapMan analysis,
we found that gs3 and qgl3 were involved in some
common or parallel metabolic pathways to regulate
grain length.
Quantitative real-time PCR validation of DEGs
To confirm the accuracy and reproducibility of the
microarray results, eight genes commonly up-regulated
and six genes commonly down-regulated by gs3 and
qgl3 were selected for real-time PCR verification, including five BR signaling or grain length regulation associated genes, Os11g44880, Os07g43670, Os02g56310,
Os01g43890 and Os01g60280. The q-PCR results for
these genes were accordance with the microarray data
(Fig. 5). The eight up-regulated genes and six downregulated genes all showed up- and down-regulation in
93–11 (gs3/qGL3), NIL-GS3/qgl3 (GS3/qgl3) and NILqgl3 (gs3/qgl3) compared with the NIL-GS3 (GS3/qGL3)
Gao et al. BMC Plant Biology (2015) 15:156
Page 9 of 13
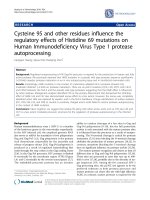
Fig. 4 Overview of the differentially expressed genes between GS3/qGL3 and gs3/qgl3. a Metabolism overview in MapMan. b Cellular response
overview in MapMan. c Cell regulation overview in MapMan. d Regulation overview in MapMan. Red, up-regulation; white, no change; blue,
down-regulation
background (Fig. 5). Strikingly, one gene, Os02g56310, encoding a calcium-dependent protein kinase, was obviously
up-regulated in NIL-qgl3 (gs3/qgl3), NIL-GS3/qgl3 (GS3/
qgl3) and 93–11 compared with NIL-GS3 (GS3/qGL3)
(Fig. 5A).
Discussion
Grain size is a target in breeding and natural selection,
and both GS3 and qGL3 significantly regulate grain size
and organ size. In this study, we compared the grain
lengths of four NILs, using NIL-GS3 as a control group.
Fig. 5 q-PCR validation of differentially expressed genes in the four rice lines. a Eight commonly up-regulated genes. b Six commonly
down-regulated genes
Gao et al. BMC Plant Biology (2015) 15:156
The results indicated that gs3 and qgl3 had additive effects on rice grain length regulation. Moreover, qGL3
had a stronger effect on rice grain length regulation than
GS3. On grain length, the strength of the additive signal
from GS3 and qGL3 was much larger than the genetic
interaction signal. However, there were large genetic interactions between GS3 and qGL3 on the expression
levels of commonly regulated genes rather than additive
effects. This work represents the first analysis of the genetic interaction between qGL3 and GS3. We used Gene
Ontology [36] and MapMan [37] bioinformatics-based
approaches for analyses aimed to interpret the biological
significance of gene expression data. Through GO and
MapMan analysis, we found that some genes regulated
by gs3 and qgl3 are involved in BR signaling, the cell
cycle, protein degradation, the GA/IAA family and protein modification, and might play important roles in the
regulation of grain length. The gs3 up-regulated gene,
Os03g27530, was in the protein degradation BIN, and its
homolog (BRS1) in Arabidopsis was reported to regulate
BR signaling [38]. Os05g04340 in the protein modification BIN was down-regulated by both gs3 and qgl3, and
its homolog BIN2 in Arabidopsis is a negative regulator
of BR signaling [39]. Based on the functional annotations
of the commonly regulated genes identified in this research, the regulation of grain length by qGL3 and GS3
might involve the BR signaling pathway.
BRs are a group of steroid phytohormones ubiquitously distributed throughout the plant kingdom [23].
They have essential roles in a wide range of plant growth
and development processes, and can promote cell division or elongation and enhance tolerance to environmental stresses and resistance to pathogens [40]. The
signal transduction pathway of BRs has been extensively
studied [39]. The phosphorylation of BSK1 (BR-signaling
kinase 1) by the BR receptor kinase BR-insensitive 1
(BRI1) promotes BSK1 binding to the BRI1 suppressor 1
(BSU1) phosphatase. BSU1, in turn, inactivates the GSK3like kinase BR-insensitive 2 (BIN2) by dephosphorylating a
conserved phospho-tyrosine residue (pTyr 200) [39, 41].
qGL3 (OsPPKL1) encodes a protein phosphatase [7] and
its two homologs in Arabidopsis, BSU1 and BSL1, were reported to promote brassinosteroid signaling [39, 42]. They
transmit a signal by dephosphorylating and deactivating
the BIN2 kinase downstream of BR signaling [39]. Moreover, we found that genes involved in BR signaling, such
as the CGMC_GSK family genes, encoding Arabidopsis
BIN2 homologous proteins, were differentially expressed
between NIL-GS3 (GS3/qGL3) and NIL-GS3/qgl3 (gs3/
qgl3). Recently, we cloned the GSK family genes and obtained additional evidence for the interaction of OsPPKL1
and GSKs via yeast two-hybrid assays (unpublished data).
These data indicated that qGL3 might participate in BR
signaling by dephosphorylating GSKs. However, qGL3 is a
Page 10 of 13
negative regulator of rice grain length [7], suggesting that
OsPPKL1-GSK interaction might play different roles in
BR signaling in rice compared with BSU1- and BSL1BIN2 interaction in Arabidopsis.
GS3 is a major QTL for grain length and weight and a
minor QTL for grain width and thickness [5]. GS3 was
reported to be an atypical heterotrimeric G protein γsubunit that positively regulates organ size [31, 32]. The
heterotrimeric G protein α-subunit, known as D1/RGA1
in rice, is involved in an alternative BR-signaling pathway, independent of OsBRI1. Recently, Hu et al. (2013)
reported that a U-Box E3 ubiquitin ligase worked as a
linkage factor between the heterotrimeric Gα subunit and
BR signaling to mediate rice growth, mainly by regulating
cell proliferation and organizing cell files in aerial organs.
In this study, we found that gs3 up-regulated a putative
serine carboxypeptidase of the peptidase S10 family. Its
homolog in Arabidopsis (BRS1) was reported to positively
regulate BR signaling [38]. We believe that this gene might
have GS5-like properties. Overexpression of BRS1 suppressed the cell surface receptor for BRs in bri1 extracellular domain mutants [38]. One of its homologs in rice was
cloned as the grain-size gene GS5, which increased grain
width when its expression increased [12]. These data reveal that some members of the serine carboxypeptidase
family might act downstream of BR signaling as positive
factors. Our research implies that GS3 also takes some
part in BR signaling, and both GS3 and qGL3 might
share a common BR signaling associated pathway in
the regulation of rice grain length. We suppose that
qGL3 might directly participate in brassinolide signaling by dephosphorylating GSKs, while GS3 indirectly
influences BRS1, which is parallel to the BRI-mediated
BR signaling pathway.
Among the genes up-regulated by both loci, we found
a gene encoding a kinesin-4, whose homolog SRS3 was
reported to positively regulate rice grain length in seed
formation [25]. We identified a small and round seed
mutant phenotype (srs3). The gene, which belongs to
the kinesin 13 subfamily, was designated SRS3 [25]. The
shortened seed phenotype of the srs3 mutant was probably the result of a reduction in cell length in the longitudinal direction [25]. The SRS3 protein might be a
homolog of the AtKinesin 13A protein, which regulates
trichome elongation in Arabidopsis [43]. Interestingly,
among the genes commonly down-regulated by gs3 and
qgl3, we observed that a number of disease resistance related genes, encoding two NB-ARC domain containing
proteins, a stripe rust resistance protein Yr10 and a peroxidase precursor, were down-regulated by both qgl3 and
gs3, suggesting that disease resistance responses may also
be negatively correlated with grain development. In
addition, we found a gene (Os07g43670) encoding a ribonuclease T2 family domain containing protein involved in
Gao et al. BMC Plant Biology (2015) 15:156
the cytokinin signaling pathway. A major QTL, Grain
number 1a (Gn1a), encodes a cytokinin oxidase/dehydrogenase (OsCKX2) that catalyzes the irreversible degradation of cytokinin. Mutation in Gn1a/OsCKX2 [44], which
encodes a zinc finger transcription factor that directly and
positively regulates Gn1a/OsCKX2 [2, 45], caused the accumulation of cytokinin and consequently increased grain
number [2]. In many cases, increased grain number is
closely associated with reduced grain size, likely owing to
the availability of fixed carbon in the source and the efficiency of transport to the sink [7, 9, 29].
The currently available evidence suggests that the
mechanisms underlying the additive effects of GS3 and
qGL3 in regulating grain length might involve phytohormones (especially BRs) and key genes related to cell division or elongation. This research should help us to
understand the mechanisms of the additive effects of gs3
and qgl3, which would be useful for deciphering the genetic network involved in rice seed formation and for molecular breeding.
Conclusions
With an elite indica cultivar 93–11 as recurrent parent
NIL-GS3 (GS3/qGL3) and NIL-qgl3 (gs3/qgl3) were developed by conventional backcrossing and marker-assisted
selection. Another line, NIL-GS3/qgl3, was developed by
crossing NIL-GS3 and NIL-qgl3. By comparing the grain
length of 93–11 and its three NILs we concluded that gs3
and qgl3 had additive effects on rice grain length regulation and that the effects of qGL3 were stronger. To reveal
the genes affected by gs3 and qgl3, we compared the transcriptomes of the primary panicles of 93–11 and the three
NILs through microarray analysis. The transcriptome analysis revealed that the genes affected by GS3 and qGL3
partially overlapped, and both loci might be involved in
BR signaling.
Methods
Plant materials and development of the NILs
The high-quality, previously sequenced [46] elite indica
rice cultivar 93–11 with non-functional gs3 and functional qGL3 was used as the genetic background for
introducing the functional GS3 and non-functional qgl3
alleles. The japonica rice cultivar Koshihikari was used
as the donor parent for functional GS3. The GS3 allele
in Koshihikari was cloned and sequenced, and was found
to be the same as GS3-2 (Nipponbare) [3, 18]. The rice
accession N411 with extra-large grains was used as the
donor parent for non-functional qgl3 [7].
As the functional GS3 is a dominant allele forming
short grains, plants with 93-11-like performance with
short grains were selected from BCnF1 populations of
93–11 × Koshihikari and continuously backcrossed with
93–11. To develop NIL-GS3 (genotype GS3/qGL3), we
Page 11 of 13
selected plants, from the BC4F1 population, with a short
Koshihikari segment (from RM15144 to RM411) and the
GS3 allele for self-pollination. A total of 126 simple sequence repeat markers were employed for background
detection. NIL-qgl3 (genotype gs3/qgl3), which carries a
~113-kb segment, including the N411 qgl3 allele in the
93–11 background, was described in previous studies
[7]. NIL-GS3/qlg3 (genotype GS3/qgl3) was developed
by crossing NIL-GS3 and NIL-qgl3. In the NIL-GS3 ×
NIL-qgl3 F2 population, plants heterozygous at the GS3
locus and homozygous at the qgl3 locus were selected to
self-pollinate naturally and the homozygous NIL-GS3/
qlg3 was selected from the F3 family by MAS.
Plant growth and evaluation of agronomic traits
To evaluate the differences in grain length between the
recurrent parent 93–11 and its three NILs, all materials
including 93–11, NIL-qgl3, NIL-GS3 and NIL-GS3/qgl3
were grown in the Jiangpu Experiment Station of Nanjing
Agricultural University. The four materials were grown in
a 13.4-m2 acreage (the actual used area: 1.5 m × 8.0 m).
All experimental materials were transplanted in the fields
with 15 cm spacing between plants within rows and
25 cm spacing between rows. The 13.4-m2 block was divided into four plots (the area of one plot: 1.5 m × 2 m),
with 80 plants of each material in one plot and there were
three blocks. 10 plants selected randomly from 80 plants
of each material were measured. The mean value of the 10
plants was used for analysis. T-test was carried out to
evaluate the statistical differences in their grain length between NIL-GS3 and other three materials. Grain length
was measured as described in a previous study [7].
Microarray analysis
As reported in previous studies, GS3 and qGL3 are
expressed strongly in young panicles [4, 7]. Thus, we
used primary panicles of 3–6 cm length from the three
NILs and 93–11 for RNA preparation and hybridization
with the Rice Genome OneArray Microarray (Phalanx
Biotech Group, Hai Shang). Each NIL and 93–11 was
sampled three times from different tillers. The Rice
OneArray probe was set with a combination of the Rice
Genome Annotation Project (RGAP) version 6.1 and
Beijing Genomics Institute (BGI) version 2008 databases.
Long oligonucleotide probes (~60-mers) were engineered
using specific lengths to match their melting temperatures
for superior hybridization performance. Each microarray
contained 824 performance monitoring control probes for
hybridization, sample quality, and labeling reactions. RNA
isolation, purification and microarray hybridization were
conducted by the Phalanx Biotech Group. Longer grains
were regarded as being more active during the growth of
the grain or glume. We conducted a comparison of the
transcriptomes by comparing the longer grain genotype
Gao et al. BMC Plant Biology (2015) 15:156
with the shorter grain genotype. The microarray data were
normalized using the GC-RMA algorithm followed by Log2
transformation. We used ordinary Student’s t –test (P
value < 0.05) to identify significantly differentially expressed
genes. Probe sets showing more than 1.5-fold change (four
NILs) in expression were considered as DEGs. To identify
DEGs regulated by gs3 or qgl3, we used the ratio (1.5 folds
for up-regulation and 0.67 folds for down-regulation) of the
expression level between combinations gs3/qGL3 vs. GS3/
qGL3, gs3/qgl3 vs. GS3/qgl3, GS3/qgl3 vs. GS3/qGL3, and
gs3/qgl3 vs. gs3/qGL3. To identify commonly expressed
genes in the four materials, we used the ratio (1.5 folds for
up-regulation and 0.67 folds for down-regulation) of the expression level between combination gs3/qGL3 vs. GS3/
qGL3, GS3/qgl3 vs. GS3/qGL3, and gs3/qgl3 vs. GS3/qGL3.
A two-way analysis of variance (ANOVA) with expression
levels and genotype (GS3/gs3 and qGL3/qgl3) as main factors was applied to the datasets from all four microarrays
to identify genes significantly affected by GS3, qGL3, or
GS3 × qGL3 interaction. The Benjamini–Hochberg false
discovery rate (FDR) for multiple test correction was used
for the analysis [47]. Furthermore, the statistical criterion of
at least a 1.5-fold change at a P-value ≤ 0.05 was used for
gene selection.
Pathway analysis
Functional enrichment analysis of DEGs using the GO
domains “molecular function”, “biological process” and
“cellular component” was performed using the AGRIGO
website with a significance level of FDR < 0.05 [36]. The
MapMan tool [37] was employed to analyze the metabolic and signaling changes in the microarray data based
on the expression value of each DEG. A metabolic pathway overview was produced by loading the DEGs with
their Log2 expression values into the locally-installed
MapMan program and shown using color intensity.
Real-time quantitative PCR
Based on the transcriptome comparison between the
three NILs and 93–11, several DEGs were selected for
further confirmation by real-time quantitative PCR. Primary panicles of 3–6 cm length were used for total RNA
extraction with an RNA extraction kit (RNAiso Plus,
TaKaRa Bio, Inc.). Reverse transcription was performed
using 6 μg RNA and 4 μg reverse transcriptase mix (PrimeScript® RT Master Mix Perfect Real Time, TaKaRa
Bio) in a volume of 40 μl, according to the manufacturer’s protocol. Real-time PCR was carried out in a total
volume of 25 μl containing 2 μl of cDNA, 0.2 mM genespecific primers, 12.5 μl SYBR® Premix Ex Taq TM II,
and 0.5 μl of Rox Reference Dye II (TaKaRa Bio), using
an ABI 7500 Fast Real-Time PCR System according to
the manufacturer’s instructions. The rice 18S rRNA gene
was used as an internal control. Relative quantification
Page 12 of 13
of the transcript levels was performed using the 2−ΔΔCT
method [48].
Availability of supporting data
The microarray data for the four NILs has been submitted to
the Gene Expression Omnibus (GEO; .
nih.gov/geo/) under accession number GSE59619.
Additional file
Additional file 1: Table S1. Genes up-regulated by gs3 (>1.5-fold).
Table S2. Genes down-regulated by gs3 (<0.67-fold). Table S3. Genes
up-regulated by qgl3 (>1.5-fold). Table S4. Genes down-regulated by
qgl3 (<0.67-fold). Table S5. Genes up-regulated by both qgl3 and gs3
(<0.67-fold). Table S6. Genes down-regulated by both qgl3 and gs3
(<0.67-fold). Additional file 1: Table S7. qGL3 × GS3 interactions resolved
by two-way ANOVA for the expression level of commonly regulated genes.
Abbreviations
NIL: Near-isogenic lines; MAS: Marker-assisted selection; QTL: Quantitative
trait locus; SSR: Simple sequence repeat; ANOVA: Analysis of variance;
GL: Grain length; DEG: Differentially expressed gene; qRT-PCR: Quantitative
reverse transcription polymerase chain reaction; GO: Gene ontology;
FDR: False discovery rate.
Competing interests
The authors declare that they have no competing interests.
Authors’ contributions
HSZ, XJZ and JFW designed the research. XYG, XJZ and HXL constructed the
four NILs. XJZ and XYG analyzed the microarray data. JH analyzed the
metabolic and signaling changes with the microarray data. XYG performed
quantitative real-time PCR. All authors read and approved the final
manuscript.
Acknowledgements
The authors thank Mr. Congfei Yin and Dr. Yunyu Wu for their experimental
help. This work was supported by grants from the Natural Science
Foundation of China (Grant Nos. 31071386 and 91335106) and the
Fundamental Research Funds for the Central Universities (No. KYZ201137).
Author details
1
State Key Laboratory of Crop Genetics and Germplasm Enhancement/
Jiangsu Collaborative Innovation Center for Modern Crop Production,
Nanjing Agricultural University, Nanjing 210095, China. 2College of Agronomy
and Plant Protection, Qingdao Agricultural University, Qingdao 266109,
China.
Received: 27 November 2014 Accepted: 29 April 2015
References
1. Xing YZ, Zhang QF. Genetic and Molecular Bases of Rice Yield. Annu Rev
Plant Biol. 2010;61:421–42.
2. Zuo J, Li J. Molecular Genetic Dissection of Quantitative Trait Loci
Regulating Rice Grain Size. Annu Rev Genet. 2014. DOI: 10.1146/annurevgenet-120213-092138.
3. Mao HL, Sun SY, Yao JL, Wang CR, Yu SB, Xu CG, et al. Linking differential
domain functions of the GS3 protein to natural variation of grain size in
rice. Proc Natl Acad Sci U S A. 2010;107(45):19579–84.
4. Takano-Kai N, Jiang H, Kubo T, Sweeney M, Matsumoto T, Kanamori H, et al.
Evolutionary History of GS3, a Gene Conferring Grain Length in Rice.
Genetics. 2009;182(4):1323–34.
5. Fan CH, Xing YZ, Mao HL, Lu TT, Han B, Xu CG, et al. GS3, a major QTL for
grain length and weight and minor QTL for grain width and thickness in
rice, encodes a putative transmembrane protein. Theor Appl Genet.
2006;112(6):1164–71.
Gao et al. BMC Plant Biology (2015) 15:156
6.
7.
8.
9.
10.
11.
12.
13.
14.
15.
16.
17.
18.
19.
20.
21.
22.
23.
24.
25.
26.
27.
28.
Qi P, Lin YS, Song XJ, Shen JB, Huang W, Shan JX, et al. The novel
quantitative trait locus GL3.1 controls rice grain size and yield by regulating
Cyclin-T1;3. Cell Res. 2012;22(12):1666–80.
Zhang X, Wang J, Huang J, Lan H, Wang C, Yin C, et al. Rare allele of
OsPPKL1 associated with grain length causes extra-large grain and a significant
yield increase in rice. Proc Natl Acad Sci U S A. 2012;109(52):21534–9.
Ishimaru K, Hirotsu N, Madoka Y, Murakami N, Hara N, Onodera H, et al. Loss
of function of the IAA-glucose hydrolase gene TGW6 enhances rice grain
weight and increases yield. Nat Genet. 2013;45(6):707–11.
Song XJ, Huang W, Shi M, Zhu MZ, Lin HX. A QTL for rice grain width and
weight encodes a previously unknown RING-type E3 ubiquitin ligase. Nat
Genet. 2007;39(5):623–30.
Shomura A, Izawa T, Ebana K, Ebitani T, Kanegae H, Konishi S, et al. Deletion
in a gene associated with grain size increased yields during rice
domestication. Nat Genet. 2008;40(8):1023–8.
Weng JF, Gu SH, Wan XY, Gao H, Guo T, Su N, et al. Isolation and initial
characterization of GW5, a major QTL associated with rice grain width and
weight. Cell Res. 2008;18(12):1199–209.
Li Y, Fan C, Xing Y, Jiang Y, Luo L, Sun L, et al. Natural variation in GS5 plays
an important role in regulating grain size and yield in rice. Nat Genet.
2011;43(12):1266–9.
Wang SK, Wu K, Yuan QB, Liu XY, Liu ZB, Lin XY, et al. Control of grain size,
shape and quality by OsSPL16 in rice. Nat Genet. 2012;44(8):950–4.
Xie XB, Song MH, Jin FX, Ahn SN, Suh JP, Hwang HG, et al. Fine mapping of
a grain weight quantitative trait locus on rice chromosome 8 using
near-isogenic lines derived from a cross between Oryza sativa and Oryza
rufipogon. Theor Appl Genet. 2006;113(5):885–94.
Guo LB, Ma LL, Jiang H, Zeng DL, Hu J, Wu LW, et al. Genetic Analysis and
Fine Mapping of Two Genes for Grain Shape and Weight in Rice. J Integr
Plant Biol. 2009;51(1):45–51.
Bai XF, Luo LJ, Yan WH, Kovi MR, Zhan W, Xing YZ: Genetic dissection of
rice grain shape using a recombinant inbred line population derived from
two contrasting parents and fine mapping a pleiotropic quantitative trait
locus qGL7. Bmc Genet 2010;11(16):2187.
Shao GN, Tang SQ, Luo J, Jiao GA, Wei XJ, Tang A, et al. Mapping of qGL7-2,
a grain length QTL on chromosome 7 of rice. J Genet Genomics.
2010;37(8):523–31.
Shao GN, Wei XJ, Chen ML, Tang SQ, Luo J, Jiao GA, et al. Allelic variation
for a candidate gene for GS7, responsible for grain shape in rice. Theor Appl
Genet. 2012;125(6):1303–12.
Qiu X, Gong R, Tan Y, Yu S. Mapping and characterization of the major
quantitative trait locus qSS7 associated with increased length and
decreased width of rice seeds. Theor Appl Genet. 2012;125(8):1717–26.
Ashikari M, Wu JZ, Yano M, Sasaki T, Yoshimura A. Rice gibberellin-insensitive
dwarf mutant gene Dwarf 1 encodes the alpha-subunit of GTP-binding protein.
Proc Natl Acad Sci U S A. 1999;96(18):10284–9.
Izawa Y, Takayanagi Y, Inaba N, Abe Y, Minami M, Fujisawa Y, et al. Function
and Expression Pattern of the alpha Subunit of the Heterotrimeric G Protein
in Rice. Plant Cell Physiol. 2010;51(2):271–81.
Oki K, Inaba N, Kitano H, Takahashi S, Fujisawa Y, Kato H, et al. Study of
novel d1 alleles, defective mutants of the alpha subunit of heterotrimeric
G-protein in rice. Genes Genet Syst. 2009;84(1):35–42.
Tanaka A, Nakagawa H, Tomita C, Shimatani Z, Ohtake M, Nomura T, et al.
BRASSINOSTEROID UPREGULATED1, Encoding a Helix-Loop-Helix Protein, Is
a Novel Gene Involved in Brassinosteroid Signaling and Controls Bending of
the Lamina Joint in Rice. Plant Physiol. 2009;151(2):669–80.
Abe Y, Mieda K, Ando T, Kono I, Yano M, Kitano H, et al. The SMALL AND
ROUND SEED1 (SRS1/DEP2) gene is involved in the regulation of seed size
in rice. Genes Genet Syst. 2010;85(5):327–39.
Kitagawa K, Kurinami S, Oki K, Abe Y, Ando T, Kono I, et al. A Novel
Kinesin 13 Protein Regulating Rice Seed Length. Plant Cell Physiol.
2010;51(8):1315–29.
Segami S, Kono I, Ando T, Yano M, Kitano H, Miura K, Iwasaki Y: Small and
round seed 5 gene encodes alpha-tubulin regulating seed cell elongation
in rice. Rice 2012;5(4):225.
Nakagawa H, Tanaka A, Tanabata T, Ohtake M, Fujioka S, Nakamura H, et al.
Short grain1 decreases organ elongation and brassinosteroid response in
rice. Plant Physiol. 2012;158(3):1208–19.
Ying JZ, Gao JP, Shan JX, Zhu MZ, Shi M, Lin HX. Dissecting the genetic
basis of extremely large grain shape in rice cultivar ‘JZ1560’. J Genet
Genomics. 2012;39(7):325–33.
Page 13 of 13
29. Huang X, Qian Q, Liu Z, Sun H, He S, Luo D, et al. Natural variation at the
DEP1 locus enhances grain yield in rice. Nat Genet. 2009;41(4):494–7.
30. Zhou Y, Zhu J, Li Z, Yi C, Liu J, Zhang H, et al. Deletion in a quantitative trait
gene qPE9-1 associated with panicle erectness improves plant architecture
during rice domestication. Genetics. 2009;183(1):315–24.
31. Li S, Liu W, Zhang X, Liu Y, Li N, Li Y. Roles of the Arabidopsis G protein
gamma subunit AGG3 and its rice homologs GS3 and DEP1 in seed and
organ size control. Plant Signal Behav. 2012;7(10):1357–9.
32. Li S, Liu Y, Zheng L, Chen L, Li N, Corke F, et al. The plant-specific G protein
gamma subunit AGG3 influences organ size and shape in Arabidopsis thaliana.
New Phytol. 2012;194(3):690–703.
33. Manimaran P, Mangrauthia SK, Sundaram RM, Balachandran SM. Constitutive
expression and silencing of a novel seed specific calcium dependent
protein kinase gene in rice reveals its role in grain filling. J Plant Physiology.
2015;174:41–8.
34. Jain M, Nijhawan A, Arora R, Agarwal P, Ray S, Sharma P, et al. F-box proteins in
rice. Genome-wide analysis, classification, temporal and spatial gene expression
during panicle and seed development, and regulation by light and abiotic
stress. Plant Physiol. 2007;143(4):1467–83.
35. Tong H, Xiao Y, Liu D, Gao S, Liu L, Yin Y, et al. Brassinosteroid regulates cell
elongation by modulating gibberellin metabolism in rice. The Plant cell.
2014;26(11):4376–93.
36. Du Z, Zhou X, Ling Y, Zhang Z, Su Z. agriGO: a GO analysis toolkit for the
agricultural community. Nucleic acids research. 2010;38(Web Server
issue):64–70.
37. Thimm O, Blasing O, Gibon Y, Nagel A, Meyer S, Kruger P, et al. MAPMAN: a
user-driven tool to display genomics data sets onto diagrams of metabolic
pathways and other biological processes. Plant J. 2004;37(6):914–39.
38. Li J, Lease KA, Tax FE, Walker JC. BRS1, a serine carboxypeptidase, regulates
BRI1 signaling in Arabidopsis thaliana. Proc Natl Acad Sci U S A.
2001;98(10):5916–21.
39. Kim TW, Guan SH, Sun Y, Deng ZP, Tang WQ, Shang JX, et al. Brassinosteroid
signal transduction from cell-surface receptor kinases to nuclear transcription
factors. Nat Cell Biol. 2009;11(10):1254–60.
40. Zhang C, Bai MY, Chong K. Brassinosteroid-mediated regulation of agronomic
traits in rice. Plant Cell Rep. 2014;33(5):683–96.
41. Kim TW, Wang ZY. Brassinosteroid Signal Transduction from Receptor
Kinases to Transcription Factors. Annual RevPlant Biol. 2010;61:681–704.
42. Mora-Garcia S, Vert G, Yin Y, Cano-Delgado A, Cheong H, Chory J. Nuclear
protein phosphatases with Kelch-repeat domains modulate the response to
brassinosteroids in Arabidopsis. Gene develop. 2004;18(4):448–60.
43. Lu L, Lee YRJ, Pan RQ, Maloof JN, Liu B. An internal motor kinesin is associated
with the golgi apparatus and plays a role in trichome morphogenesis in
Arabidopsis. Mol Biol Cell. 2005;16(2):811–23.
44. Ashikari M, Sakakibara H, Lin SY, Yamamoto T, Takashi T, Nishimura A, et al.
Cytokinin oxidase regulates rice grain production. Science.
2005;309(5735):741–5.
45. Li SY, Zhao BR, Yuan DY, Duan MJ, Qian Q, Tang L, et al. Rice zinc finger
protein DST enhances grain production through controlling Gn1a/OsCKX2
expression. Proc Natl Acad Sci U S A. 2013;110(8):3167–72.
46. Yu J, Hu S, Wang J, Wong GK, Li S, Liu B, et al. A draft sequence of the rice
genome (Oryza sativa L. ssp. indica). Science. 2002;296(5565):79–92.
47. Benjamini Y, Hochberg Y. Controlling the False Discovery Rate - a Practical
and Powerful Approach to Multiple Testing. J Roy Stat Soc B Met.
1995;57(1):289–300.
48. Livak KJ, Schmittgen TD. Analysis of relative gene expression data using
real-time quantitative PCR and the 2(T)(−Delta Delta C) method. Methods.
2001;25(4):402–8.