Báo cáo y học: "Systematic detection of putative tumor suppressor genes through the combined use of exome and transcriptome sequencin" ppt
Bạn đang xem bản rút gọn của tài liệu. Xem và tải ngay bản đầy đủ của tài liệu tại đây (1.35 MB, 14 trang )
RESEARC H Open Access
Systematic detection of putative tumor
suppressor genes through the combined use
of exome and transcriptome sequencing
Qi Zhao
1†
, Ewen F Kirkness
2†
, Otavia L Caballero
1†
, Pedro A Galante
3
, Raphael B Parmigiani
3
, Lee Edsall
4
,
Samantha Kuan
4
, Zhen Ye
4
, Samuel Levy
5
, Ana Tereza R Vasconcelos
6
, Bing Ren
4
, Sandro J de Souza
3
,
Anamaria A Camargo
3
, Andrew JG Simpson
1*
, Robert L Strausberg
1*
Abstract
Background: To identify potential tumor suppressor genes, genome-w ide data from exome and transcriptome
sequencing were combined to search for genes with loss of heterozygosity and allele-specific expression. The
analysis was conducted on the breast cancer cell line HCC1954, and a lymphoblast cell line from the same
individual, HCC1954BL.
Results: By comparing exome sequences from the two cell lines, we identified loss of heterozygosity events at 403
genes in HCC1954 and at one gene in HCC1954BL. The combination of exome and transcriptome sequence data
also revealed 86 and 50 genes with allele specific expression events in HCC1954 and HCC1954BL, which comprise
5.4% and 2.6% of genes surveyed, respectively. Many of these genes identified by loss of heterozygosity and allele-
specific expression are kno wn or putative tumor suppressor genes, such as BRCA1, MSH3 and SETX, which
participate in DNA repair pathways.
Conclusions: Our results demonstrate that the combined application of high throughput sequencing to exome
and allele-specific transcriptome analysis can reveal genes with known tumor suppressor characteristics, and a
shortlist of novel candidates for the study of tumor suppressor act ivities.
Background
Cancer arises from the accumulation of genetic and epi-
genetic changes that disrupt the normal regulatory con-
trols in cells. Recently, next generation sequencing
technology has been employed to identify variations in
protein-coding sequences and genome str ucture for sev-
eral types of cancers [1-9]. These studies have revealed
the effectiveness of high throughput sequence analysis to
identify somatic genomic alterations, such as point muta-
tions, and structural variations, including gain and loss of
chromosome regions. An important finding is that inte-
grated analysis of the various somatic alterations is key
for identifying genes that may drive cancer development
and progression through oncogenic or tumor suppressor
functions. Here, we combine the detection of two types
of molecular events, loss of heterozygosity (LOH) and
allele-specific expression (ASE), to ident ify genes with
known and potential tumor suppressor characteristics.
The common feature of LOH and ASE is loss of expres-
sion from one allele, which has frequent ly been observed
for tumor suppressor genes. In ASE, a dominant gene pro-
duct is expressed from the selected allele. For some genes,
subtle changes in expression level and balance between
alleles could be physiologically significant. Haploinsuffi-
ciency of many tumor suppressor genes promotes tumori-
genesis and metastasis [10].
ASE is classically associated with epigenomic regulation,
and can be heritable. Two extreme examples are inactiva-
tion of genes on the X chromosome in female cells, and
imprinting of autosomal genes [11]. ASE can arise from
epigenetic modification of the genome, including DNA
methylation and histone modification [12,13]. Genetic var-
iations in the coding or non-coding regions of a gene are
* Correspondence: ;
† Contributed equally
1
Ludwig Collaborative Group, Department of Neurosurgery, Johns Hopkins
University, 1550 Orleans Street, Baltimore, MD 21231, USA
Full list of author information is available at the end of the article
Zhao et al. Genome Biology 2010, 11:R114
/>© 2010 Zhao et al.; licensee BioMed Centra l Ltd. This is a n open access a rticle distributed un der the t erms of the Creati ve Commons
Attribution License ( which permits unrestricted use, distribution, and reproduction in
any medium, provided the original work is properly cited.
likely to influence these epigenetic controls [14]. However,
allelic differences in gene expression are variable among
populations and among tissue types [15, 16], suggesting
that ASE can be context specific with regard to cell type,
cell differentiation status, and exposure to external stimuli.
Recently, subtle differences in allelic expression have been
detected for numer ous human genes, and in a few cases,
have been associated with a genetic predisposition to dis-
ease, including cancer [17,18].
Previously, genome-wide qua ntification of ASE events
has been estimated by hybridization-based [15,19,20]
and sequencing-based [17] methodologies. Recently, sev-
eral studies have highlighted specific roles of ASE in
oncogenesis, many as germline ASE [18,21,22]. Here, we
have applied comprehensive sequence-based approaches
using exome capture and transcriptome sequencing in a
breast cancer cell line, HCC1954, to identify potential
cancer-specific and somatically driven LOH and ASE
events, and to discern their functional characteristics.
This cell line, derived from a ductal breast carcinoma, is
estrogen negative, progesterone receptor negative and
ERBB2 positive, and has been particularly well studied
at the molecular level [2,7,23]. A matching control cell
line, HCC1954BL, which was established f rom lympho-
blast cells of the s ame patient, was studied in parallel.
We demonstrate that combined analysis of exome and
transcriptome sequences provides a dynamic image of
tumor cells that is particularly relevant to tumor sup-
pressor networks.
Results
Application of exome sequencing to LOH detection
For both HCC1954 and HCC195 4BL, exome capture was
performed with the NimbleGen 2.1 M array, followed by
454 Titanium sequencing of captured DNA from each
cell line. The 454 reads were mapped uniquely to the
human reference genome (hg18) using GS Refere nce
Mapper (gsMapper). Variants and variant allele frequen-
cies were called from high-confidence single nucleotide
variants (SNVs) detected by gsMapper (see Materials and
methods; Tables S1 and S2 in Additional file 1) and were
used for the subsequent analysis. Table 1 summarizes the
sequencing and mapping results from the exome sequen-
cing effort. We identified 13,102 and 14,219 SNVs in the
26.4 Mb of primary target sequence for HCC1954 and
HCC1954BL, respectively.
With variant allele frequencies ranging from 10% to 90%,
8,754 preliminary heterozygous SNVs were defined in
HCC1954BL. For these mostly exomic SNVs in
HCC1954BL, we examined the variant allele frequencies
at the correspondi ng loci in HCC1954, requiring ten
unique reads of the same genotype to sup port a homozy-
gous locus (P < 0.001). Comparison of variant allele fre-
quencies between HCC1954 and HCC1954BL identified
many LOH events in large genomic clusters across the
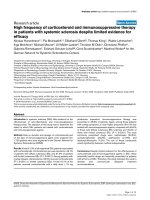
genome and in isolated genes (Figure 1; Figure S1 in
Additional file 2). LOH occurred on all chromosomes,
with particularly large blocks on chromosomes 5, 8, 12
and 17. Our results are in agreement with LOH data gen-
erated using the Affymetrix SNV array 6.0 [24] for
regions of large genomic deletions on chromosomes 5, 8,
12, 17, 19, 22 and X by approximate genome coordinates.
However, there are discrepancies fo r chromosome 9. Our
data do not support a major LOH block on 9q (F igure
1c). As expe cted, 9q12 and 9q13 are gene de serts. From
9q21 to the telomeric end of 9q, allele variations are con-
sistently detected across this region.
To identify specific genes displaying LOH in HCC1954,
we used more string ent criteria that required a heterozy-
gous locus with variant allele frequency between 20% and
80% i n HCC1954BL, together with homozygosity in
HCC1954 (P < 0.001). In HCC1954BL, 8,203 heterozy-
gous SNV loci were defined, with 7,848 in the coding
sequence (CDS). LOH events are thus detected in 403
genes as revealed by 609 SNVs, among which 544 are
known SNPs (Tables S1, S2 and S3 in Additional file 1).
Most of the LOH genes are clustered together in large
blocks as described above. For those single LOH genes
that are isolated, we a lso required that the homozygous
SNV in HCC1954 has been defined previously in dbSNP,
that no conflict ing allelic stat us is detecte d within 25 kb,
and that the homozygosity of the SNV locus is support ed
by transcriptome reads. Genes with LOH are located on
15 chromosomes, with most on chromosomes 5 and 17,
including BRCA1 (Figure 1a; Additional file 2). Using the
same criteria, only one LOH gene was detected in
HCC1954BL (RRAS2).
Table 1 Statistics of exome sequencing and reads
mapping
HCC1954 HCC1954BL
Number of 454 reads 6,878,120 6,658,357
Total bases pairs 2,588,213,873 2,325,966,906
Uniquely mapped reads 6,645,304
(97%)
6,385,651
(96%)
Reads uniquely mapped to primary
targets
4,806,828
(70%)
4,310,274
(65%)
Target coverage 94.8% 96.0%
Mean target coverage 19.4× 18.1×
Median target coverage 16× 16×
Coverage enrichment by exome
sequencing
23× 24×
Total high-confidence (HC) SNVs (known
SNVs)
13,102
(12,145)
14,219
(13,309)
HC heterozygous SNVs (known SNVs) 5,602 (4,954) 8,203 (7,408)
HC heterozygous SNVs in CDS
(known SNVs)
5,329 (4,709) 7,848 (7,082)
CDS, coding sequence; SNV, single nucleotide variant.
Zhao et al. Genome Biology 2010, 11:R114
/>Page 2 of 14
We compared the allelic status of SNPs that were
defined in our LOH analysis with those that were geno-
typed by Affymetrix Genome-Wide Human SNP Array
6.0 [GEO:GSE13373]. In HCC1954BL, heterozygous
SNP calls matched perfectly between the two platforms
for all 345 known SNP s that were shared. Only one of
224 homozygous SNPs identified by SNP array was
revealed as heterozygous by se quencing. For HCC1954,
heterozygous SNPs calls were also 100% consistent
between the two platforms for all 172 SNPs that are
shared. However, 29 of 270 (11%) homozygous SNPs,
defined by SNP array, were identified as heterozygous
by exome sequencing. Thus, there was a high level of
consistency between the two platforms, with sequencing
possibly providing greater sensitivity for cancer genomes
that carry a wide spectrum of copy number variations.
Out of the 403 LOH genes in HCC1954, 267 have
expression in th e transcriptome with at least 1× average
base pair coverage per gene. To systematically assess the
putative biological functions of the LOH genes, we per-
formed Gene Ontology and pathway (KEGG) analysis
on the 403 LOH genes. A selection of represen tative
molecular functions is presented in Table 2. The top
category of functional networ k is molecular transport
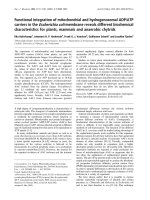
Figure 1 Exome-based loss of heterozygosit y events det ect ed in HCC195 4. (a-c) Comparison between variant allele frequencies of the
same locus between HCC1954 and HCC1954BL for chromosome 17 (a), chromosome 8 (b) and chromosome 9 (c). Blue shaded areas represent
large LOH regions. (d) Distribution of LOH genes across the HCC1954 chromosomes.
Zhao et al. Genome Biology 2010, 11:R114
/>Page 3 of 14
and drug metabolism w ith 29 LOH genes. Thirteen
LOH genes, including BRCA1 and MSH3,areinthe
DNA replication, recombination and repair pathway.
mRNA allelotyping by transcriptome sequencing
High throughput sequencing of transcriptomes for
HCC1954 and HCC1954BL was performed, with 14.0
Gbp and 13.6 Gbp generated by short read pa ired-end
sequencing, respectively. Sequence reads were subse-
quently aligned to the R efSeq gene set [25] as well as to
the human reference genome with CLCBio Genomic
Workbench ( see Materials and methods). With a cutoff
of 1× average coverage across each gene, 14,397 and
14,251 genes were found to be expressed i n HCC1954
and HCC1954B L, respectively. These numbers are com-
parable to previo us transcriptome studies [26,27]. The
average base pair coverage for the detected transcrip-
tom e is approximately 120× for HCC19 54 and 115× for
HCC1954BL. For HCC1954, 7,173 transcripts displayed
SNVs at a minimum of one locus per transcript, indicat-
ing that these genes are express ed from both alleles (see
Materials and methods). The remaining 7,224 tran-
scripts lack detectable allelic variation. These include
many cases in which coverage is not sufficient to make
a call for allelic variation. For HCC1954BL, 7,595 genes
have detectable allelic variation within transcribed
regions, while variants were no t detectable in transcript s
of 6,656 genes.
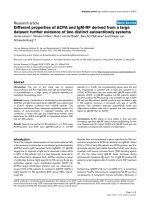
Allele-specific expression detection
With genotyping information acquired by exo me
sequencing, the ASE mining process is summarized in
Figure 2 for HCC1954. We started with 3,123 genes
that ca rry heterozygous loci at the genomic level as
shown by 5,329 SNVs detected in the CDS by exome
sequencing. Of 5,329 SNVs, 620 (11.6%) have not been
reported in dbSNP130 [28]. The 5,329 SNVs were
checked for coverage by transcriptome sequence reads.
The binomial test was utilized to calculate the distribu-
tion of allel es repr esented by numbers of reads that are
expected by chance, and led to the requirement that
each SNV locus was covered by at least 20 transcrip-
tome reads. Of 5,329 SNVs, 2,534 SNVs in 1,591 genes
met this minimum coverage requirement. A stringent
criterion of allele drift ratio (< 0.2 or >0.8) was applied
to all expressed variant alleles to be considered as
biased. A binomi al test was then calculated with two
adjustments to determine if there was biased expression
from one allele (see Materials and methods). Due to the
pseudo-tetraploid nature of the HCC1954 genome and
copy number changes across the genome, the probabil-
ity of success (p_s) ratio was a djusted based on variant
allele frequency from the exome sequencing data
instead of the static 0.5 for the normal diploid genome.
A second adjustment was made to correct for multiple
sampling. With a cutoff of P < 0.05, 221 SNVs in 86
genes were found to be expressed preferentially from
oneallele(TableS5inAdditionalfile1).Table3listsa
selection of ASE genes with the most significant
P-values (P < 0.001) in HCC1954. Consistently, all the
ASE calls were supported by the transcripto me
sequence across the entire transcript length, including
SNVs detected by the tran scriptome reads in the 5’ and
3’ UTRs for the 86 genes. Out of 221 SNVs utilized in
Table 2 Top categories of general molecular types
General molecular function Number of genes Examples
LOH genes
Enzyme 80 USP26, INPP5K, PTPRS, MAT2B
Kinase 25 CDK7, DGKE, MAP2K4, PDGFRL
Transporter 21 ATP2B3, SLC36A3, SIL1, ABCA7
Transcription regulator 20 BRCA1, FOXD4, SOX5, VEZF1
G-protein coupled receptor 19 GPR174, OR1A2, TAS2R7, GRM6
Transmembrane receptor 9 SEMA5A, IL31RA, ITGB3, OSMR
Cytokine 7 IL3, ERBB2IP, EDA, CXCL16
Ion channel 6 CCT8L2, CNGA2, GABRA6, GRIN3B
ASE genes
Enzyme 18 MGMT, PLCH1, GUCY1A3, PYGL
Transcription regulator 7 CTBP2, SMARCA4, BCLAF1, SPEN
Kinase 6 FGFR2, FGFR4, IP6K2, TAOK1
Transporter 5 SLC44A5, SLC25A5, SNX15, LBP
Transmembrane receptor 3 HLA-DQA1
, HLA-A, TNFRSF10D
G-protein coupled receptor 2 ADORA1, GPR107
Genes are binned exclusively into each category based on their primary molecular function terms. LOH, loss of heterozygo sity; ASE, allele-specific expression.
Zhao et al. Genome Biology 2010, 11:R114
/>Page 4 of 14
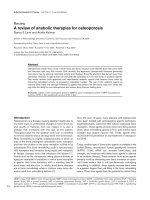
Figure 2 Schematic diagram of allele-specific expres sion events detected by combination of exome sequencing and trans criptome
sequencing.
Table 3 Selected list of allele-specific expression genes detected in the HCC1954 cell line
Gene Number of reads ratio major/
minor
Chr. Gene product Non-ASE
P-value
Known
SNV ID
CTBP2 404/0 10 C-terminal binding protein 2 0.000 3 novel SNVs
415/1
395/0
HLA-A 267/4 6 Major histocompatibility complex, class I, A 0.000 rs2231114
546/0 0.000 rs1059517
TAOK1 223/16 17 TAO kinase 1 0.000 rs508706
PLAU 140/0 10 Plasminogen activator, urokinase 0.000 rs2227568
PODXL2 124/1 3 Podocalyxin-like 2 0.000 rs920232
ITGB2 53/2 21 Integrin, beta 2 0.000 rs11088969
LXN 45/1 3 Latexin 0.000 rs8455
SNUPN 48/2 15 Snurportin 1 0.000 rs11547316
RAB3A 50/5 19 RAB3A, member RAS oncogene family 0.000 rs1046565
KIN 31/0 10 KIN, antigenic determinant of recA protein homolog
(mouse)
0.000 rs61752337
GLB1L2 26/0 11 Galactosidase, beta 1-like 2 0.000 rs3741097
MGMT 21/0 10 O-6-methylguanine-DNA methyltransferase 0.001 rs2308327
PLEKHA6 340/1 1 Pleckstrin homology domain containing, family A member
6
0.000 rs33911350
THNSL2 36/0 2 Threonine synthase-like 2 (S. cerevisiae) 0.000 rs35051888
LBP 220/10 20 Lipopolysaccharide binding protein 0.000 rs5744204
123/6 rs2232582
238/10 rs2232596
FGFR4 267/27 5 Fibroblast growth factor receptor 4 0.000 rs1966265
SLC44A5 57/0 1 Solute carrier family 44, member 5 0.000 rs17096508
40/0 rs10493565
31/0 rs588098
41/0 Novel SNV
FGFR2 44/0 10 Fibroblast growth factor receptor 2 0.000 rs1047100
SYTL5 48/2 X Synaptotagmin-like 5 0.000 rs5918476
30/3 rs4827330
Genes under ASE regulation in HCC1954 but expressed from both alleles in HCC1954BL are shown in bold; genes under ASE regulation in HCC1954 but barely
expressed in HCC1954BL are shown in regular font. ASE, allele-specific expression; SNV, single nucleotide variant.
Zhao et al. Genome Biology 2010, 11:R114
/>Page 5 of 14
the ASE analysis, 72 (33%) are novel. The higher ratio
of novel SNVs seen in ASE genes compared to that of
11% in the whole exome analysis c an be explained by
the fact that, among 86 ASE genes reported, 13 ASE
genes carry multiple novel SNVs. This led to a large
random standard deviation. The chromosomal distribu-
tions of the 86 ASE genes, and the 1,591 transcripts
containing >20× coverage of CDS SNVs is shown in
Figure 3a.
A similar data mining process was performed for
HCC1954BL. There were 7,848 SNVs in 4,441 genes
identified by exome sequencing. Of these, 766 (9.7%) are
novel. A total of 3,086 of the 7,848 SNVs were found in
1,918 genes, each of which was represented by at least
20 transcriptome reads. Comparison of SNVs in the
exome and transcriptome data suggests that 5 0 genes
are under ASE regulation as demonstra ted by 117 SNVs
(Table S6 in Ad ditional file 1). The chro mosomal
distribution of the 1,918 candidate genes and the 50
ASE genes is shown in Figure 3b.
Biological categorization of the 86 ASE genes in
HCC1954 shows that many of them are associated with
cell-cell signaling and interactions, with 16 encoding cell
surface proteins and five encoding extracellular matrix
proteins. Of the 16 cell surface proteins, seven are trans-
membrane receptors, including kinases in the FGFR
family and G-protein coupled receptors (Table 2).
For HCC1954 and H CC1954BL combined, approxi-
mately two-thirds of the ASE genes had a single SNV
locus as supported by the exome data in their CDSs
while the remainder had multiple exomic SNVs for ASE
conc orda nce (Table 3). In the latter cas es, the most sig-
nificant P-value of the ASE locus was used.
Twenty-two ASE genes are shared by bot h cell lines,
and five of these are located on chromosome X. F or all
shared ASE genes that are not on the X chromosome,
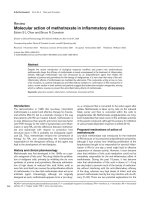
Figure 3 Distribution of genes carrying high-confidence heterozygous alleles and genes under allele-specific expression. (a) In
HCC1954; (b) in HCC1954BL.
Zhao et al. Genome Biology 2010, 11:R114
/>Page 6 of 14
the same allele was preferentially expressed in both cell
lines, suggesting that common genomic sequence var-
iants are the controlling factors for these ASE events. For
24 genes that display ASE in HCC1954, there was no pre-
ferential expression from either allele in HCC1954BL.
For 26 ASE genes in HCC1954, it was not possible to
determine their status in HCC1954BL because of low or
undetectable expression. The remaining 14 ASE genes in
HCC1954 have no genotyping status in HCC1954BL due
to low exome sequencing coverage, but are likely to be
ASE genes in HCC1954BL since 93% of the exome geno-
types are in dbSNP, and all have biased allele expression
patterns detected in the transcriptome. Only three ASE
genes are unique to HCC1954BL, which are expressed in
both alleles in HCC1954.
As expected, chromosome X carries ASE genes most
frequently in both cell lines. The other ASE genes are dis-
tributed across most of the autosomes (Figure 3). Cluster-
ing of ASE genes is not observed in the same genomic
regions; thus, ASE events are more likely to be individually
controlled. Chromosome X harbors none of the unique
ASE genes in HCC1954, but two unique ASE genes in
HCC1954BL, suggesting that there has been differential
escape from X-inactivation between the two cell lines.
Genotyping by exome sequencing and allelotyping by
transcriptome sequencing revealed additional genomic
aberrations. For example, loca l genomic disruption at a
locus may result in detection of a single allele from
transcriptome sequencing. Indeed, in our previous
report on transcriptome studies of the same HCC1954
cell line [29], we identified a genomic inversion event at
the PHF20L1 gene locus. It was predicted that transcrip-
tion of PHF20L1 would be impaired for the rearranged
allele, leaving the other all ele intact. Identification of
PHF20L1 as a gene expressed from only one allele in
this stud y agrees with our previous findings. This indir-
ectly demonstrates that our strategy can detect a spec-
trum of ASE events in the genome.
We identified two additional genes in HCC1954,
GPR56 and FAAH2,forwhichthetranscriptome
sequence data were ambiguous. Although each gene is
heterozygous at two known SNP loci, only one SNP
locus has monoallelic expression while the other distant
SNP is expressed from both alleles. We speculate that
either local genomic rearrangement or transcription
from the opposite strand occurs in HCC1954. It is also
possible that there are alternative transcript forms for
these two genes, and only one form has unba lanced
expression.
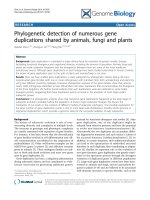
Experimental validation of allele-specific expression
events
Three loci were genotyped and allelotyped in HCC1954
to validate three corresponding genes with putative ASE
(FGFR2, MAP9, FANCB). PCR was performed to amplify
genomic sequences surrounding the SNV loci, while
reverse transcription PCR (RT-PCR) was applied to
determine if a single allele is preferentially transcribed.
Sanger sequencing chemistry was used to c onfirm the
allelic status in both preparations. All three loci were
validated as ASE events (Figure 4).
Interestingly, FGFR2, a kinase receptor g ene, under-
goes ASE in HCC1954 (Figure 4a). The FGFR2 gene is
known to be expressed in multiple alter native splicing
forms. It is transcribed in the form of FGFR2b in mam-
mary epithelial cells, and FGFR2c in surrounding
mesenchymal cells [30]. After de novo assembly of the
Illumina cDNA reads, FGFR2b was found to be the only
isoform ex pressed in HCC1954. FGFR2 is heterozygous
as shown by exonic SNV of rs1047100, which is a
synonymous SNV at V232 (GTA versus GTG), but tran-
scribed as FGFR2b only from one strand (GTA) as
revealed by mRNA reads at rs1047100 (Figure 4a).
Another validated ASE gene is MAP9 on chromosome
4, a microtubule-associated protein required for spin dle
function, mitotic progression, and cytokinesis (Figure
4b). FANCB, a member of Fanconi anemia complemen-
tation group (FANC) on chromosome X , was also con-
firmed to be inactivated on one allele in HCC1954
(Figure 4c). Unequal peak heights between two genomic
DNA alleles likely r esult from the pseudo-tetroploidy
genome status and copy number variation in HCC1954.
Discussion
Exome and transcriptome sequencing captures a snap-
shot of the active genom e in a cell population. In addi-
tion to revealing SNVs and relative gene expression
levels in a sample, the combined data can be used to
distinguish active from inactive alleles. By mining
sequence data from exomes and transcriptomes, we
have identified LOH events and ASE genes in the breast
cancer cell line HCC1954 and a lymphoblast cell line
from the same individual, HCC1954BL. Our approach
demonstrates that the search for genome-wide allele-
specific events is feasible with systematic application of
sequencing technologies.
Due to its pseudo-tetraploid genomic status with fre-
quent copy number variation in HCC1954, similar
numbers of sequence reads often gave lower average
coverage of the minor allele in the HCC1954 exome
compared to that of the HCC1954BL. Thus, a lower
number of high-confidence SNVs detected in
HCC1954 is expected. This n umber would be expected
to increase with even greater sequence coverage. After
combining with transcriptome sequence data, the
SNVswithaminimumof20×coveragebytranscrip-
tome reads were used for ASE mining. We also
observed greater variation in mRNA expression levels
Zhao et al. Genome Biology 2010, 11:R114
/>Page 7 of 14
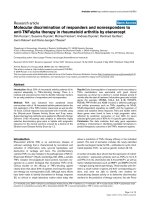
Figure 4 Validation of allele-specific expression events in HCC1954. The top trace is from cDNA, and the bottom trace is from genomic
DNA (gDNA). (a) FGFR2; (b) MAP9; (c) FANCB.
Zhao et al. Genome Biology 2010, 11:R114
/>Page 8 of 14
in the cancer cell line, yielding fewer SNVs with deep
transcript coverage for ASE mining. The combined use
of exome-capture and transcriptome sequencing
focuses on SNVs in genes and captures novel SNVs
that were absent from previously published array-based
approaches [17,19,31,32].
In general, the total number of heterozygous SNVs
detected by the exome-capture sequencing is less than
that identified by transcriptome sequencing. This can be
attr ibuted to heterozygous allelic variations residing in 5’
and 3’ UTRs of mRNAs that are not targeted by probes
on the exome array. Expansion of targeted regions of the
exome array to non-CDS exons would provide additional
informative SNVs.
In recent years, experimental evidence has shown that
haploinsufficiency of tumor suppressor genes can serve to
drive the tumorigenic process [10]. Genetic, epigenetic
and environmental factors can modify this haploinsuffi-
ciency to promote the tumor phenotype. First, association
between LOH and tumor susceptibility is significant only
when several tum or suppress or genes are involved in the
LOH events [10,33]. Second, in addition to common
tumor suppressor genes shared by many cancer types like
RB1 and TP53, many tumor suppressor genes are specific
to a particular tumor type and/o r cell type that originate
the tumor. Deficiency of BRCA1 and BRCA2 is mainly
found in breast and ovarian cancers thus far. Third, epige-
netic silencing of tumor suppressor genes is achieved by
different mechanisms, such as DNA methylation and his-
tone modification. These observations suggest that
additional tumor suppressor genes remain to be discov-
ered for specific tumor types.
Many genes identified in our study are either known
tumor suppressor genes (for example, BRCA1)orpre-
viously identified putative tumor suppressor genes (for
example, BCR). Moreover, genomic instability or epige-
netic alterations have been reported in breast cancer
and other cancer ty pes for several of the genes in our
list. A selection of the LO H and ASE genes and their
associated molecular functions is listed in Table 4. For
example, LOH is a frequent event for BRCA1 in breast
and ovarian cancers, for MSH3 in breast, bladder and
non-small cell lung cancers, and for PDGFRL in spora-
dic hepatocellular carcinomas, colorectal and non-small
cell lung cancers. In addition, FHOD3 and MAP2K4
were previously defined as candidate cancer genes (CAN
gene) by integrated a nalysis of homozygous deletions
and sequence alterations in breast and colorectal cancers
[34]. Meanwhile, epigenetic silencing caused by methyla-
tion was previously observed for at least five ASE genes
identified in our study, including DSC3, FGFR2 and
MGMT in breast cancer and/or in other cancer types.
However, a survey of related literature indicates that
allelic-sp ecific methylation has not yet been reported for
ASE genes identified in this study.
FGFRs, which have been implicated in breast cancer
development, are reported to be allele-specifically
expressed for the first time in a breast cancer cell in
this study. FGFR2 has been identified as a risk factor
in breast cancer by association studies [30,35-37]. Two
Table 4 Selected list of LOH or ASE genes: known or putative tumor suppressor genes
Gene product and functional properties Reported functional studies in cancer
LOH genes
BRCA1 Breast cancer 1, a nuclear phosphoprotein involved in
maintaining DNA stability
Tumor suppressor function [43]
MSH3 MutS homolog 3, a subunit of MutS beta involved in
DNA mismatch repair
Genetic instability caused by loss of MSH3 in cancers [44]
PCGF2 Polycomb group ring finger 2, involved in protein-protein
interaction and transcription repression
Tumor suppressor function [45]
PDGFRL Platelet-derived growth factor receptor-like, a cell surface
tyrosine kinase receptor
Mutation and gene loss correlated with breast cancer progression [46]
and prostate cancer [47]
BCR Breakpoint cluster region Putative tumor suppressor in meningiomas [48]
ASE genes
DSC3 Desmocollin 3, a cell adhesion molecule in cadherin
family
Epigenetic silencing of DSC3 is a common event in breast cancer [49]
FGFR2 Fibroblast growth factor receptor 2, a transmembrane
tyrosine kinase
Hypermethylation of FGFR2 found in gastric cancer [50]
MYEOV Myeloma overexpressed, a putative transforming gene Epigenetically inactivated in esophageal squamous cell carcinomas [51]
TNFRSF10D Tumor necrosis factor receptor superfamily, member 10
d, a member of TNF-receptor superfamily
Aberrant methylation in multiple tumor type and mapped to tumor
suppressor region in prostate cancer [52,53]
MGMT O-6-methylguanine-DNA methyltransferase, a DNA repair
gene
Methylation of MGMT in many types of cancers [41,42,54] and
associated with poorer overall and disease-free survival [55]
LOH, loss of heterozygosity; ASE, allele-specific expression.
Zhao et al. Genome Biology 2010, 11:R114
/>Page 9 of 14
intronic SNVs in FGFR2 have been reported to
increase susceptibility to breast cancer b y regulating
the downstream gene expression level [35]. FGFR2 was
identified as a CAN gene by combined genomic studies
in breast and colore ctal cancers [34]. Moreover, pros-
tate and bladder cancers with reduced FGFR2b expres-
sion show poorer prognosis due to increased potential
for invasion and metastasis [38,39]. We can speculate
that FGFR2 functions as a tumor suppressor in breast
cancer, as well as FGFR4, for which functions are still
unknown.
MGMT encodes a DNA methyltransferase , a DNA
repair protein. The promoter of the MGMT gene has
been found to be hypermethylated a t a high frequency
in many types of cancers, including colorectal cancer
and glioblastoma [40-42]. This indicates that MGMT
may serve as a tumor suppressor in many types of
cancer. A protein-protein interaction analysis that inte-
grat es all genes that have been found to carry a somat ic
change i n HCC1954, including the LOH and ASE genes
identified in this study, genes that carry somatic point
mutations [6], as well as a gene mutated by chromoso-
mal translocation [29] yielded a prominent functional
network that focuses on DNA recombination, replica-
tion and repair (Figure 5). The network is formed by at
least 31 molecules composed of 21 genes with LOH,
seven genes with ASE, two genes with somatic point
mutation and one gene with a translocation.
Conclusions
Our analysis of the combined effect of LOH and ASE in
HCC1954 reveals additional genes that may have tumor
suppressor o r other functions within this breast cancer
cell ( summarized in Additional file 1). Recently, several
studies have demonstrated the importance of compre-
hensive characterization of diverse molecular events
toward discerning genes and pathways that potentially
play a role in tumorigenesis. For example, gene activa-
tion can resu lt from various events, such as point muta-
tions that activat e a protein product, gene amplification,
and gene f usion, as well as epigenetic alteration. Here
we demonstrate that the combined approach of exome
sequencing and transcript analysis can reveal LOH and
ASE events that can each result in haploinsufficiency for
specific genes. ASE reflects various types of fluidic geno-
mic alterations, including those that are epigenetic, and
thus provides a unique insight to the changing status of
cancer cells. This approach will further facilitate the
process of identifying additional CAN genes and better
define drivers of the tumorigenesis process. We no te
that genetic alterations in immortalized cell lines may
not accurately reflect those changes in the cells from
Figure 5 DNA recombination, replication and repair network. In HCC1954, g enes that have somatic point mutations (blue), ASE (yellow),
LOH (green), or translocations (purple) form a DNA repair network. Small circles represent protein complexes or protein families with
components encoded by either ASE or LOH genes.
Zhao et al. Genome Biology 2010, 11:R114
/>Page 10 of 14
which they were derived. Nevertheless, the proof of
principle study des cribed here demonstrates that appli-
cation of this approach to clinical samples such as
tumor cells, stromal cells, fibroblasts, and infiltrating
T-cells would likely provide additional definition to the
significance of ASE in cance r. Our study demonstrates
the feasibility of such approaches based on the ever-
increasing power of next generation sequencing.
Materials and methods
Exome sequencing and mapping
The cell lines HCC1954 and HCC1954 were obtained
from ATCC. They were maintained in RPMI medium
containing 10% fetal bovine serum, 2 mM L-glutamine
and non-essential amino acids. Total DNA was isolated
from the cell pellets using the DNeasy Blood and Tissue
Kit (Qiagen, Valencia, CA, USA). Genomic DNA was
treated with RNase Cocktail™ (Ambion, Austin, TX,
USA), followed by phenol-chloroform extraction and
precipitation o f the aqueous phase in 1/10 volume 3 M
sodium acetate and 100% ethanol.
Exome capture was performed using 5 μgofinput
DNA according to the manufacturer’s protocol (Roche
Nimblegen, Madison, WI, USA). Briefly, genomi c DNA
was nebulized for 1 minute using 45 p si of pressure.
Sheared DNA fragments were subsequently cleaned with
the DNA Clean and Concentrator-25 Kit (Zymo
Research, Orange, CA, USA) and a fragment size distri-
bution ranging from 300 to 500 bp was verified
via Bioanalyzer (Agilent, Santa Clara, CA, USA). After
end-polishing of the genomic fragments, the GS FLX
Titanium adaptors were ligated to the sheared genomic
fragments. Ligated fragments were next hybridized to
the Nimblegen Sequence Capture 2.1 M exome array
within Maui hybridization stations, followed by washing
and elution of array-bound fragments from the arrays
within elution chambers (Nimblegen). Captured frag-
ments were next subjected to 27 rounds of PCR amplifi-
cation using primers targeting the Nimblegen linkers.
Following elution, the capture efficiency was evaluated
via quantitative PCR reactions. Six full runs of 454 Tita-
nium were performed for the captured fragments for
each cell line. 454 reads were aligned to the human
reference genome (hg18) using gsMa pper. All raw reads
have been deposited to the EBI Sequence Read Archive
(SRA; submission ID ERA010917).
Transcriptome sequencing and mapping
Total RNA was isolated from the cell pellets using the
RNeasy Mini Kit (Qiagen). Total RNA was treated with
DNase I (New England Biolabs, Ipswich, MA, USA) and
purified with Qiagen RNeasy columns (Qiagen). DNA-
free RNA yield and purity were initially assessed by
spectrophotometry. PolyA+ RNA was prepared from 500
μg of total RNA with oligo(dT) beads using the Oligotex
mRNA Mini Kit (Qiagen). First-strand cDNA was pre-
pared from 1 μg of poly(A)+ RNA with 200 pmol o ligo
random primers by using 300 units of Superscript II
reverse transcriptase (Invitrogen, Carlsbad, CA, USA).
Second-strand synthesis was performe d in 20 μlat16°C
for 2 h after addition of 10 units of Escherichia coli DNA
ligase, 40 units of E. coli DNA polymerase, and 2 units of
RNase H (all from Invitrogen). T4 DNA polymerase
(5 units) was added and incubated for 5 minutes at 16°C.
Double-strand cDNA was purified by phenol-chloroform
extraction and precipitation of the aqueous phase in 1/10
volume 3 M sodium acetate and 100% ethanol.
The Illumina GAII sequencing procedure was carried
out for paired-end short read sequencing. The RefSeq
gene set was queried from NCBI website on 3 December
2009. The approximately 75-Mb dataset comprises
41,249 transcript entries. The longest alternative form
for each gene was used as reference in the assembly
process. Human reference genome build 36 was also
used as the assembly reference. Solexa short reads were
mapped to the references using the CLC Bio Genomic
Work Bench sui te (CLC Bio,8200 Arhus N, Denmark).
A stringent cutoff was used, requiring unique read map-
ping and allowing 2-bp mismatch for each read. Expres-
sion level was calculated by RPKM as the number of
reads that map per kilobase of exon model per million
mapped reads for each gene. Transcriptome reads are
accessible through the EBI-SRA (submission ID
ERA011762).
Single nucleotide variant calling
For exome sequencing, SNVs for variant alleles were
drawn from t he default high-confidence SNV calls by
gsMapper (the 454HCDiffs.txt file), which is defined as
the variant allele supported by at least three non-dupli-
cated h igh quality reads with at least 10% variant allele
frequency. An annotated SNP file (snp130) was down-
loaded from NCBI to identify known SNPs. Only SNVs
in the CDS were used for downstream LOH and ASE
analysis.
For transcriptome sequencing, SNVs were called on all
assembled contigs using CLCBio SNV detection tools.
A minimum quality of 30 was required for the central
SNV base and 15 required for the surrounding bases.
A SNV for a minor allele required at least four reads or
at least 30% variant allele frequency.
Statistical significance (P-value) of LOH and ASE
Binomial function was used for both LOH and ASE sig-
nificance to calculate the probability of the reads being
randomly distributed between the two alleles.
Zhao et al. Genome Biology 2010, 11:R114
/>Page 11 of 14
The cumulative binomial distribution is:
Bxnp bynp
y
x
(;,) (;,)=
=
∑
0
For biased reads coverage: P = BINOMDIST(#reads for
rareallele,#totalreads,p_s,TRUE).p_sisprobabilityof
success in each trial. For a normal diploid genome like
HCC1954BL, 0.5 is applied to p_s. However, the p_s value
is adjusted for the HCC1954 genome based on variant
allele frequency data from exome sequencing. Multiple
correction was also applied to the P-values at uneven alle-
lic loci in transcriptome sequencing. We used 2,534 SNVs
that have the minimum 20× coverage in the transcriptome
for multiple correction calculation in HCC1954.
Validation of allele-specific expression
In general, genomic DNA flanking the SNV loci to
be tested was amplified by using intronic primer pairs.
The cDNA fragments were produced by RT-PCR using
exonic primer pairs crossing adjacent exons. Sanger
sequencing was applied to the amplified genomic DNA
and cDNA. Total RNA and DNA from the cell pellets
were isolated usi ng the RNeasy Mini Kit and DNeasy
Blood and Tissue Kit (Qiagen). Genomic DNA was treated
with RNase Coc ktail™ (Ambion), followed by phenol-
chloroform extraction and precipitation of the aqueous
phase in 1/10 volume 3 M sodium acetate and 100% etha-
nol. Total RNA was t reated with DNase I (New England
Biolabs) and purified with Qiagen RNeasy columns (Qia-
gen). DNA-free RNA yield and purity were assessed by
spectrophotometry and denaturing agarose gels. A total of
0.5 to 1.0 μg of RNA was reverse transcribed into cD NA
by using an Omniscript RT kit according to the manufac-
turer’s protocol using oligo (dT)
18
primers. PCRs from the
genomic DNA and RT-PCR were undertaken using High-
Fidelity Platinum Taq (Invitrogen) plus 10 pmol of each of
the primers listed in Table S7 in Additional file 1. After
gel purification, the amplicons were submitted to Sanger
sequencing with the PCR primers.
Molecular functional network
Primary molecular functions and networks involved
were analyzed with the IPA software developed by Inge-
nuity (Redwood City, CA, USA).
Additional material
Additional file 1: Supplemental tables. Table S1: exome genotyping in
HCC1954. Table S2: exome genotyping in HCC1954BL. Table S3: LOH
genes in HCC1954. Table S4: LOH genes in HCC1954BL. Table S5: ASE
genes in HCC1954. Table S6: ASE genes in HCC1954BL. Table S7: primers
used in ASE events validation. Table S8: summary of putative tumor
suppressor genes identified by LOH and ASE events.
Additional file 2: Supplemental figures. LOH events detected across
each chromosome.
Abbreviations
ASE: allele-specific expression; BP: base pair; CDS: coding sequence; LOH: loss
of heterozygosity; RT-PCR: reverse transcription PCR; SNP: single nucleotide
polymorphism; SNV: single nucleotide variant; SRA: Sequence Read Archive;
UTR: untranslated region.
Acknowledgements
We thank Dr Jiaqi Huang and Dr Pauline Ng for technical assistance and
discussions. This work is supported in part by the Hilton-Ludwig Cancer
Metastasis Initiative, funded by the Conrad N Hilton Foundation and the
Ludwig Institute for Cancer Research.
Author details
1
Ludwig Collaborative Group, Department of Neurosurgery, Johns Hopkins
University, 1550 Orleans Street, Baltimore, MD 21231, USA.
2
J. Craig Venter
Institute, 9704 Medical Center Drive, Rockville, MD 20850, USA.
3
Ludwig
Institute for Cancer Research, São Paulo Branch at Hospital Alemão Oswaldo
Cruz, Rua João Julião 245, 01323-903 São Paulo, Brazil.
4
Ludwig Institute for
Cancer Research, San Diego Branch, 9500 Gilman Drive, La Jolla, CA 92093-
0660, USA.
5
Scripps Translational Science Institute, 3344 North Torrey Pines
Court, La Jolla, CA 92037, USA.
6
Laboratório Nacional de Computação
Científica, Laboratório de Bioinformática, Av. Getúlio Vargas 333, Petrópolis,
RJ 25651-075, Brazil.
Authors’ contributions
QZ, EFK and PAG performed data analysis; OLC and RBP performed the
experiments; LE, SK and ZY generated the data; QZ, EFK, SL, ARV, BR, SJdS,
AAC, AJGS and RLS contributed to research design and discussion of the
manuscript; QZ, ERK and RLS wrote the manuscript. All authors read and
approved the final manuscript.
Received: 6 July 2010 Revised: 27 September 2010
Accepted: 25 November 2010 Published: 25 November 2010
References
1. Bignell GR, Greenman CD, Davies H, Butler AP, Edkins S, Andrews JM,
Buck G, Chen L, Beare D, Latimer C, Widaa S, Hinton J, Fahey C, Fu B,
Swamy S, Dalgliesh GL, Teh BT, Deloukas P, Yang F, Campbell PJ,
Futreal PA, Stratton MR: Signatures of mutation and selection in the
cancer genome. Nature 463:893-898.
2. Stephens PJ, McBride DJ, Lin ML, Varela I, Pleasance ED, Simpson JT,
Stebbings LA, Leroy C, Edkins S, Mudie LJ, Greenman CD, Jia M, Latimer C,
Teague JW, Lau KW, Burton J, Quail MA, Swerdlow H, Churcher C,
Natrajan R, Sieuwerts AM, Martens JW, Silver DP, Langerød A, Russnes HE,
Foekens JA, Reis-Filho JS, van’t Veer L, Richardson AL, Børresen-Dale AL,
et al: Complex landscapes of somatic rearrangement in human breast
cancer genomes. Nature 2009, 462:1005-1010.
3. Pleasance ED, Stephens PJ, O’Meara S, McBride DJ, Meynert A, Jones D, Lin ML,
Beare D, Lau KW, Greenman C, Varela I, Nik-Zainal S, Davies HR, Ordoñez GR,
Mudie LJ, Latimer C, Edkins S, Stebbings L, Chen L, Jia M, Leroy C, Marshall J,
Menzies A, Butler A, Teague JW, Mangion J, Sun YA, McLaughlin SF,
Peckham HE, Tsung EF, et al: A small-cell lung cancer genome with complex
signatures of tobacco exposure. Nature 463:184-190.
4. Pleasance ED, Cheetham RK, Stephens PJ, McBride DJ, Humphray SJ,
Greenman CD, Varela I, Lin ML, Ordóñez GR, Bignell GR, Ye K, Alipaz J,
Bauer MJ, Beare D, Butler A, Carter RJ, Chen L, Cox AJ, Edkins S, Kokko-
Gonzales PI, Gormley NA, Grocock RJ, Haudenschild CD, Hims MM, James T,
Jia M, Kingsbury Z, Leroy C, Marshall J, Menzies A, et al: A comprehensive
catalogue of somatic mutations from a human cancer genome. Nature
463:191-196.
5. Parsons DW, Jones S, Zhang X, Lin JC, Leary RJ, Angenendt P, Mankoo P,
Carter H, Siu IM, Gallia GL, Olivi A, McLendon R, Rasheed BA, Keir S,
Nikolskaya T, Nikolsky Y, Busam DA, Tekleab H, Diaz LA Jr, Hartigan J,
Smith DR, Strausberg RL, Marie SK, Shinjo SM, Yan H, Riggins GJ, Bigner DD,
Zhao et al. Genome Biology 2010, 11:R114
/>Page 12 of 14
Karchin R, Papadopoulos N, Parmigiani G, et al: An integrated genomic
analysis of human glioblastoma multiforme. Science 2008, 321:1807-1812.
6. Wood LD, Parsons DW, Jones S, Lin J, Sjöblom T, Leary RJ, Shen D,
Boca SM, Barber T, Ptak J, Silliman N, Szabo S, Dezso Z, Ustyanksky V,
Nikolskaya T, Nikolsky Y, Karchin R, Wilson PA, Kaminker JS, Zhang Z,
Croshaw R, Willis J, Dawson D, Shipitsin M, Willson JK, Sukumar S, Polyak K,
Park BH, Pethiyagoda CL, Pant PV, et al: The genomic landscapes of
human breast and colorectal cancers. Science 2007, 318:1108-1113.
7. Sjöblom T, Jones S, Wood LD, Parsons DW, Lin J, Barber TD, Mandelker D,
Leary RJ, Ptak J, Silliman N, Szabo S, Buckhaults P, Farrell C, Meeh P,
Markowitz SD, Willis J, Dawson D, Willson JK, Gazdar AF, Hartigan J, Wu L,
Liu C, Parmigiani G, Park BH, Bachman KE, Papadopoulos N, Vogelstein B,
Kinzler KW, Velculescu VE: The consensus coding sequences of human
breast and colorectal cancers. Science 2006, 314:268-274.
8. Beroukhim R, Mermel CH, Porter D, Wei G, Raychaudhuri S, Donovan J,
Barretina J, Boehm JS, Dobson J, Urashima M, Mc Henry KT, Pinchback RM,
Ligon AH, Cho YJ, Haery L, Greulich H, Reich M, Winckler W, Lawrence MS,
Weir BA, Tanaka KE, Chiang DY, Bass AJ, Loo A, Hoffman C, Prensner J,
Liefeld T, Gao Q, Yecies D, Signoretti S, et al: The landscape of somatic
copy-number alteration across human cancers. Nature 463:899-905.
9. Chiang DY, Getz G, Jaffe DB, O’Kelly MJ, Zhao X, Carter SL, Russ C,
Nusbaum C, Meyerson M, Lander ES: High-resolution mapping of copy-
number alterations with massively parallel sequencing. Nat Methods
2009, 6:99-103.
10. Payne SR, Kemp CJ: Tumor suppressor genetics. Carcinogenesis 2005,
26:2031-2045.
11. Knight JC: Allele-specific gene expression uncovered. Trends Genet 2004,
20:113-116.
12. Li E, Beard C, Jaenisch R: Role for DNA methylation in genomic
imprinting. Nature 1993, 366:362-365.
13. Carr MS, Yevtodiyenko A, Schmidt CL, Schmidt JV: Allele-specific histone
modifications regulate expression of the Dlk1-Gtl2 imprinted domain.
Genomics 2007, 89:280-290.
14. Pickrell JK, Marioni JC, Pai AA, Degner JF, Engelhardt BE, Nkadori E,
Veyrieras JB, Stephens M, Gilad Y, Pritchard JK: Understanding mechanisms
underlying human gene expression variation with RNA sequencing.
Nature 2010, 464:768-772.
15. Lo HS, Wang Z, Hu Y, Yang HH, Gere S, Buetow KH, Lee MP: Allelic
variation in gene expression is common in the human genome. Genome
Res 2003, 13:1855-1862.
16. Yan H, Yuan W, Velculescu VE, Vogelstein B, Kinzler KW: Allelic variation in
human gene expression. Science 2002, 297:1143.
17. Zhang K, Li JB, Gao Y, Egli D, Xie B, Deng J, Li Z, Lee JH, Aach J,
Leproust EM, Eggan K, Church GM:
Digital RNA allelotyping reveals tissue-
specific and allele-specific gene expression in human. Nat Methods 2009,
6:613-618.
18. Valle L, Serena-Acedo T, Liyanarachchi S, Hampel H, Comeras I, Li Z,
Zeng Q, Zhang HT, Pennison MJ, Sadim M, Pasche B, Tanner SM, de la
Chapelle A: Germline allele-specific expression of TGFBR1 confers an
increased risk of colorectal cancer. Science 2008, 321:1361-1365.
19. Serre D, Gurd S, Ge B, Sladek R, Sinnett D, Harmsen E, Bibikova M, Chudin E,
Barker DL, Dickinson T, Fan JB, Hudson TJ: Differential allelic expression in
the human genome: a robust approach to identify genetic and
epigenetic cis-acting mechanisms regulating gene expression. PLoS
Genet 2008, 4:e1000006.
20. Milani L, Gupta M, Andersen M, Dhar S, Fryknas M, Isaksson A, Larsson R,
Syvanen AC: Allelic imbalance in gene expression as a guide to cis-
acting regulatory single nucleotide polymorphisms in cancer cells.
Nucleic Acids Res 2007, 35:e34.
21. Yan H, Dobbie Z, Gruber SB, Markowitz S, Romans K, Giardiello FM,
Kinzler KW, Vogelstein B: Small changes in expression affect
predisposition to tumorigenesis. Nat Genet 2002, 30:25-26.
22. Raval A, Tanner SM, Byrd JC, Angerman EB, Perko JD, Chen SS,
Hackanson B, Grever MR, Lucas DM, Matkovic JJ, Lin TS, Kipps TJ, Murray F,
Weisenburger D, Sanger W, Lynch J, Watson P, Jansen M, Yoshinaga Y,
Rosenquist R, de Jong PJ, Coggill P, Beck S, Lynch H, de la Chapelle A,
Plass C: Downregulation of death-associated protein kinase 1 (DAPK1) in
chronic lymphocytic leukemia. Cell 2007, 129:879-890.
23. Bignell GR, Santarius T, Pole JC, Butler AP, Perry J, Pleasance E, Greenman C,
Menzies A, Taylor S, Edkins S, Campbell P, Quail M, Plumb B, Matthews L,
McLay K, Edwards PA, Rogers J, Wooster R, Futreal PA, Stratton MR:
Architectures of somatic genomic rearrangement in human cancer
amplicons at sequence-level resolution. Genome Res 2007, 17:1296-1303.
24. Catalogue of Somatic Mutations in Cancer - COSMIC. [ger.
ac.uk/genetics/CGP/cosmic].
25. NCBI Reference Sequence (RefSeq). [ />26. Sugarbaker DJ, Richards WG, Gordon GJ, Dong L, De Rienzo A, Maulik G,
Glickman JN, Chirieac LR, Hartman ML, Taillon BE, Du L, Bouffard P,
Kingsmore SF, Miller NA, Farmer AD, Jensen RV, Gullans SR, Bueno R:
Transcriptome sequencing of malignant pleural mesothelioma tumors.
Proc Natl Acad Sci USA 2008, 105:3521-3526.
27. Jongeneel CV, Delorenzi M, Iseli C, Zhou D, Haudenschild CD,
Khrebtukova I, Kuznetsov D, Stevenson BJ, Strausberg RL, Simpson AJ,
Vasicek TJ: An atlas of human gene expression from massively parallel
signature sequencing (MPSS). Genome Res 2005, 15:1007-1014.
28. The Single Nucleotide Polymorphism database (dbSNP). [http://www.
ncbi.nlm.nih.gov/projects/SNP].
29. Zhao Q, Caballero OL, Levy S, Stevenson BJ, Iseli C, de Souza SJ, Galante PA,
Busam D, Leversha MA, Chadalavada K, Rogers YH, Venter JC, Simpson AJ,
Strausberg RL: Transcriptome-guided characterization of genomic
rearrangements in a breast cancer cell line. Proc Natl Acad Sci USA 2009,
106:1886-1891.
30. Katoh M: Cancer genomics and genetics of FGFR2. Int J Oncol 2008,
33:233-237.
31. Gimelbrant A, Hutchinson JN, Thompson BR, Chess A: Widespread
monoallelic expression on human autosomes. Science 2007,
318:1136-1140.
32. Tuch BB, Laborde RR, Xu X, Gu J, Chung CB, Monighetti CK, Stanley SJ,
Olsen KD, Kasperbauer JL, Moore EJ, Broomer AJ, Tan R, Brzoska PM,
Muller MW, Siddiqui AS, Asmann YW, Sun Y, Kuersten S, Barker MA, De La
Vega FM, Smith DI, et al: Tumor transcriptome sequencing reveals allelic
expression imbalances associated with copy number alterations. PLoS
One 5:e9317.
33. Hanby AM, Kelsell DP, Potts HW, Gillett CE, Bishop DT, Spurr NK, Barnes DM:
Association between loss of heterozygosity of BRCA1 and BRCA2 and
morphological attributes of sporadic breast cancer. Int J Cancer 2000,
88:204-208.
34. Leary RJ, Lin JC, Cummins J, Boca S, Wood LD, Parsons DW, Jones S,
Sjöblom T, Park BH, Parsons R, Willis J, Dawson D, Willson JK, Nikolskaya T,
Nikolsky Y, Kopelovich L, Papadopoulos N, Pennacchio LA, Wang TL,
Markowitz SD, Parmigiani G, Kinzler KW, Vogelstein B, Velculescu VE:
Integrated analysis of homozygous deletions, focal amplifications, and
sequence alterations in breast and colorectal cancers. Proc Natl Acad Sci
USA 2008, 105:16224-16229.
35. Meyer KB, Maia AT, O’Reilly M, Teschendorff AE, Chin SF, Caldas C,
Ponder BA: Allele-specific up-regulation of FGFR2 increases susceptibility
to breast cancer. PLoS Biol 2008, 6:e108.
36. Easton DF, Pooley KA, Dunning AM, Pharoah PD, Thompson D,
Ballinger DG, Struewing JP, Morrison J, Field H, Luben R, Wareham N,
Ahmed S, Healey CS, Bowman R; SEARCH collaborators, Meyer KB,
Haiman CA, Kolonel LK, Henderson BE, Le Marchand L, Brennan P,
Sangrajrang S, Gaborieau V, Odefrey F, Shen CY, Wu PE, Wang HC, Eccles D,
Evans DG, Peto J, et al: Genome-wide association study identifies novel
breast cancer susceptibility loci. Nature 2007, 447:1087-1093.
37. Hunter DJ, Kraft P, Jacobs KB, Cox DG, Yeager M, Hankinson SE,
Wacholder S, Wang Z, Welch R, Hutchinson A, Wang J, Yu K, Chatterjee N,
Orr N, Willett WC, Colditz GA, Ziegler RG, Berg CD, Buys SS, McCarty CA,
Feigelson HS, Calle EE, Thun MJ, Hayes RB, Tucker M, Gerhard DS,
Fraumeni JF Jr, Hoover RN, Thomas G, Chanock SJ: A genome-wide
association study identifies alleles in FGFR2 associated with risk of
sporadic postmenopausal breast cancer. Nat Genet 2007, 39:870-874.
38. Bernard-Pierrot I, Ricol D, Cassidy A, Graham A, Elvin P, Caillault A, Lair S,
Broet P, Thiery JP, Radvanyi F: Inhibition of human bladder tumour cell
growth by fibroblast growth factor receptor 2b is independent of its
kinase activity. Involvement of the carboxy-terminal region of the
receptor. Oncogene 2004, 23:9201-9211.
39. Ricol D, Cappellen D, El Marjou A, Gil-Diez-de-Medina S, Girault JM,
Yoshida T, Ferry G, Tucker G, Poupon MF, Chopin D, Thiery JP, Radvanyi F:
Tumour suppressive properties of fibroblast growth factor receptor 2-IIIb
in human bladder cancer. Oncogene 1999, 18:7234-7243.
40. Everhard S, Tost J, El Abdalaoui H, Crinière E, Busato F, Marie Y, Gut IG,
Sanson M, Mokhtari K, Laigle-Donadey F, Hoang-Xuan K, Delattre JY, Thillet J:
Zhao et al. Genome Biology 2010, 11:R114
/>Page 13 of 14
Identification of regions correlating MGMT promoter methylation and
gene expression in glioblastomas. Neuro Oncol 2009, 11:348-356.
41. Hibi K, Goto T, Mizukami H, Kitamura Y, Sakata M, Saito M, Ishibashi K,
Kigawa G, Nemoto H, Sanada Y: MGMT gene is aberrantly methylated
from the early stages of colorectal cancers. Hepatogastroenterology 2009,
56:1642-1644.
42. Hibi K, Sakata M, Yokomizo K, Kitamura YH, Sakuraba K, Shirahata A, Goto T,
Mizukami H, Saito M, Ishibashi K, Kigawa G, Nemoto H, Sanada Y:
Methylation of the MGMT gene is frequently detected in advanced
gastric carcinoma. Anticancer Res 2009, 29:5053-5055.
43. Narod SA, Foulkes WD: BRCA1 and BRCA2: 1994 and beyond. Nat Rev
Cancer 2004, 4:665-676.
44. Haugen AC, Goel A, Yamada K, Marra G, Nguyen TP, Nagasaka T,
Kanazawa S, Koike J, Kikuchi Y, Zhong X, Arita M, Shibuya K, Oshimura M,
Hemmi H, Boland CR, Koi M: Genetic instability caused by loss of MutS
homologue 3 in human colorectal cancer. Cancer Res 2008, 68:8465-8472.
45. Guo WJ, Zeng MS, Yadav A, Song LB, Guo BH, Band V, Dimri GP: Mel-18
acts as a tumor suppressor by repressing Bmi-1 expression and down-
regulating Akt activity in breast cancer cells. Cancer Res 2007,
67:5083-5089.
46. Seitz S, Korsching E, Weimer J, Jacobsen A, Arnold N, Meindl A, Arnold W,
Gustavus D, Klebig C, Petersen I, Scherneck S: Genetic background of
different cancer cell lines influences the gene set involved in
chromosome 8 mediated breast tumor suppression. Genes Chromosomes
Cancer 2006, 45:612-627.
47. Komiya A, Suzuki H, Ueda T, Aida S, Ito N, Shiraishi T, Yatani R, Emi M,
Yasuda K, Shimazaki J, Ito H: PRLTS gene alterations in human prostate
cancer. Jpn J Cancer Res 1997, 88:389-393.
48. Wozniak K, Piaskowski S, Gresner SM, Golanska E, Bieniek E, Bigoszewska K,
Sikorska B, Szybka M, Kulczycka-Wojdala D, Zakrzewska M, Zawlik I,
Papierz W, Stawski R, Jaskolski DJ, Och W, Sieruta M, Liberski PP, Rieske P:
BCR expression is decreased in meningiomas showing loss of
heterozygosity of 22q within a new minimal deletion region. Cancer
Genet Cytogenet 2008, 183:14-20.
49. Oshiro MM, Kim CJ, Wozniak RJ, Junk DJ, Muñoz-Rodríguez JL, Burr JA,
Fitzgerald M, Pawar SC, Cress AE, Domann FE, Futscher BW: Epigenetic
silencing of DSC3 is a common event in human breast cancer. Breast
Cancer Res 2005, 7:R669-680.
50. Park S, Kim JH, Jang JH: Aberrant hypermethylation of the FGFR2 gene in
human gastric cancer cell lines. Biochem Biophys Res Commun 2007,
357:1011-1015.
51. Janssen JW, Imoto I, Inoue J, Shimada Y, Ueda M, Imamura M, Bartram CR,
Inazawa J: MYEOV, a gene at 11q13, is coamplified with CCND1, but
epigenetically inactivated in a subset of esophageal squamous cell
carcinomas. J Hum Genet 2002, 47:460-464.
52. Shivapurkar N, Toyooka S, Toyooka KO, Reddy J, Miyajima K, Suzuki M,
Shigematsu H, Takahashi T, Parikh G, Pass HI, Chaudhary PM, Gazdar AF:
Aberrant methylation of trail decoy receptor genes is frequent in
multiple tumor types. Int J Cancer 2004, 109:786-792.
53. Hornstein M, Hoffmann MJ, Alexa A, Yamanaka M, Muller M, Jung V,
Rahnenfuhrer J, Schulz WA: Protein phosphatase and TRAIL receptor
genes as new candidate tumor genes on chromosome 8p in prostate
cancer. Cancer Genomics Proteomics 2008, 5:123-136.
54. Piperi C, Themistocleous MS, Papavassiliou GA, Farmaki E, Levidou G,
Korkolopoulou P, Adamopoulos C, Papavassiliou AG: High incidence of
MGMT and RARbeta promoter methylation in primary glioblastomas:
association with histopathological characteristics, inflammatory
mediators and clinical outcome. Mol Med 16:1-9.
55. Taioli E, Ragin C, Wang XH, Chen J, Langevin SM, Brown AR, Gollin SM,
Garte S, Sobol RW: Recurrence in oral and pharyngeal cancer is
associated with quantitative MGMT promoter methylation. BMC Cancer
2009, 9:354.
doi:10.1186/gb-2010-11-11-r114
Cite this article as: Zhao et al.: Systematic detection of putative tumor
suppressor genes through the combined use of exome and
transcriptome sequencing. Genome Biology 2010 11:R114.
Submit your next manuscript to BioMed Central
and take full advantage of:
• Convenient online submission
• Thorough peer review
• No space constraints or color figure charges
• Immediate publication on acceptance
• Inclusion in PubMed, CAS, Scopus and Google Scholar
• Research which is freely available for redistribution
Submit your manuscript at
www.biomedcentral.com/submit
Zhao et al. Genome Biology 2010, 11:R114
/>Page 14 of 14