Discovery and mapping of genomic regions governing economically important traits of Basmati rice
Bạn đang xem bản rút gọn của tài liệu. Xem và tải ngay bản đầy đủ của tài liệu tại đây (2.68 MB, 19 trang )
Vemireddy et al. BMC Plant Biology (2015) 15:207
DOI 10.1186/s12870-015-0575-5
RESEARCH ARTICLE
Open Access
Discovery and mapping of genomic regions
governing economically important traits of
Basmati rice
Lakshminarayana R Vemireddy1,2*, Sabahat Noor2, VV Satyavathi2*, A Srividhya1,2, A Kaliappan2, SRN Parimala2,
Prathibha M Bharathi1, Dondapati A Deborah1, KV Sudhakar Rao2,3, N Shobharani3, EA Siddiq1,2
and Javaregowda Nagaraju2
Abstract
Background: Basmati rice, originated in the foothills of Himalayas, commands a premium price in the domestic
and international markets on account of its unique quality traits. The complex genetic nature of unique traits of
Basmati as well as tedious screening methodologies involved in quality testing have been serious constraints to
breeding quality Basmati. In the present study, we made an attempt to identify the genomic regions governing
unique traits of Basmati rice.
Results: A total of 34 Quantitative Trait Loci (QTLs) for 16 economically important traits of Basmati rice were
identified employing F2, F3 and Recombinant Inbred Line (RIL) mapping populations derived from a cross between
Basmati370 (traditional Basmati) and Jaya (semi-dwarf rice). Out of which, 12 QTLs contributing to more than 15 %
phenotypic variance were identified and considered as major effect QTLs. Four major effect QTLs coincide with the
already known genes viz., sd1, GS3, alk1 and fgr governing plant height, grain size, alkali spreading value and aroma,
respectively. For the remaining major QTLs, candidate genes were predicted as auxin response factor for filled grains,
soluble starch synthase 3 for chalkiness and VQ domain containing protein for grain breadth and grain weight QTLs,
based on the presence of non-synonymous single nucleotide polymorphism (SNPs) that were identified by
comparing Basmati genome sequence with that of Nipponbare.
Conclusions: To the best of our knowledge, the current study is the first attempt ever made to carry out
genome-wide mapping for the dissection of the genetic basis of economically important traits of Basmati
rice. The promising QTLs controlling important traits in Basmati rice, identified in this study, can be used
as candidates for future marker-assisted breeding.
Keywords: Basmati rice, Quantitative trait loci, Quality traits, Microsatellite markers, Non-synonymous SNPs,
Candidate genes
Background
Rice, a staple food for over half of the global population,
is endowed with rich genetic diversity, which is evident
from the availability of numerous landraces and improved cultivars in the gene banks. Basmati is a unique
varietal group of rice germplasm that has gained popularity as a speciality rice worldwide, mainly due to
* Correspondence: ;
1
Institute of Biotechnology, Acharya NG Ranga Agricultural University,
Rajendranagar, Hyderabad, 500030, AP, India
2
Centre for DNA Fingerprinting and Diagnostics, Hyderabad 500001, India
Full list of author information is available at the end of the article
conscious and continuous selection by man over thousands of years for his diverse quality preferences [1].
Basmati rice occupies a special place among all
aromatic rice cultivars by virtue of its unique quality
characterized by extra long slender grain, lengthwise excessive kernel elongation upon cooking, soft and fluffy
texture of the cooked rice, and exquisite aroma. It is,
therefore, regarded as the “King of rices” [2–4]. Furthermore, previous diversity studies of rice revealed that the
Basmati rice forms a separate cluster quite apart from
indica and japonica groups [3, 5, 6]. Basmati expresses
© 2015 Vemireddy et al. Open Access This article is distributed under the terms of the Creative Commons Attribution
4.0 International License ( which permits unrestricted use, distribution,
and reproduction in any medium, provided you give appropriate credit to the original author(s) and the source,
provide a link to the Creative Commons license, and indicate if changes were made. The Creative Commons Public
Domain Dedication waiver ( applies to the data made available in
this article, unless otherwise stated.
Vemireddy et al. BMC Plant Biology (2015) 15:207
its unique features only when grown in the NorthWestern foothills of the Himalayas. Due to its location
specific quality performance, Basmati is now a Geographical Indication (GI) in the Indian subcontinent.
India has exported 3.75 Million MT of Basmati Rice to
the world for the worth of USD 4,865 million during the
year 2013–14 (www.apeda.gov.in).
In order to develop rice varieties suitable to various
consumer quality preferences, knowledge of the genetics
of key quality traits is inevitable. In the past, several
genes/QTLs governing quality traits were identified in
indica and japonica sub species of Oryza sativa. The
major genes related to quality traits includes waxy gene
for amylose content (AC) [7], alk gene for gelatinization
temperature (GT) [8], fgr for fragrance [9, 10], GS3 for
grain size and grain weight [11] and chalk5 for chalkiness [12]. In addition to these major genes, there are
many minor QTLs governing the traits in japonica
[13, 14] and indica [15]. Although a vast literature is
available on the genetics and mapping of QTLs in indica
and japonica rice varieties, not much information is
available on Basmati rice per se. Among the limited
number of studies available, one QTL for kernel elongation after cooking has been identified on chromosome
8 employing two RFLP markers viz., RZ323 and RZ562
[16]. Four QTLs for amylose content, two for gel
consistency (GC) and five for gelatinization temperature
(GT) have been identified from a cross between jasmine
variety KDML105 and non aromatic CT9933 [17]. Using
bulked segregant analysis of 247 F2 individuals of a cross
between Basmati370/ASD 16, two microsatellite markers
RM225 and RM247 have been identified and reported to
be associated with grain breadth and cooked grain
breadth, respectively [18]. Subsequently, QTLs for grain
length (L), grain breadth (B), LB ratio, aroma, kernel
elongation ratio, amylose content and alkali spreading
value have been identified in a mapping population
derived from a cross between Pusa1121, an evolved
Basmati cultivar and Pusa1342 [19].
The aim of the present study was to identify and map
QTLs linked to economically important traits of Basmati
rice. Also, an attempt has been made to discover the
candidate genes underlying the major QTLs by aligning
Basmati genome sequence with available Nipponbare
rice genome sequence information.
Methods
Plant Materials
The traditional Basmati variety, Basmati370 and the
semidwarf non‐Basmati variety, Jaya were chosen as parents for developing a mapping population for the following reasons. The traditional Basmati varieties known by
different names in the subcontinent, in all likelihood, are
derivatives of the single local variety i.e., Basmati370 or
Page 2 of 19
Basmati370‐like variety [3]. Most of the Basmati varieties
released as elite Basmati varieties since 1965 from India
(12 of 19) and Pakistan (4 of 5) have Basmati370 as one
of the donor strains in the breeding programs. Genetic
diversity study employing ISSRs (Inter Simple Sequence
Repeats) and SSRs (Simple Sequence Repeats) reveals
that the high yielding variety Jaya to be genetically quite
distinct from Basmati370 [3]. The parents Jaya and Basmati varieties possess distinct and contrasting physico‐
chemical characters especially Jaya has very high amylose content than Basmati370. The genetic material consisted of progenies derived from a cross between
Basmati370 and Jaya. One hundred F1 seeds were used
to raise F2 generation during Kharif, 2005. The plant
phenotype, grain appearance before and after cooking,
and chalkiness characters of Basmati370, Jaya and their F1
hybrid and F2 progeny are shown in Fig. 1; Additional file
1: Figure S1. The F2 population was grown along with F1s
and the parents in wet land farm of the Agricultural Research Institute (ARI), Rajendranagar, Hyderabad. Out of
10,000 F2 plants, 181 were randomly chosen as mapping
population for construction of the linkage map and QTL
mapping. The F2 population was advanced to F3 for the validation of the QTLs identified in the F2 population. To confirm the inheritance of the agronomic traits, one more set
of F2 population comprising of 282 plants of the same cross
was grown in Andhra Pradesh Rice Research Institute
(APRRI), Maruteru, West Godavari, AP. In addition, a total
of 155 recombinant inbred lines (RILs) was developed from
the F2 individuals by single-seed descent method and
grown in kharif 2009. The phenotypic measurements were
recorded using the standard procedures for the eighteen
traits in the mapping populations as given below.
Plant height (PH) - Length of the tallest tiller from
ground level to the tip of the panicle, Number of panicles
(NP) - Number of ear bearing tillers per plant, Panicle
length (PL) - Length in cm from neck to the tip of the panicle excluding awn, Spikelet number (SN) - Number of
spikelets including empty and filled ones per panicle averaged over 4–5 panicles, Filled grains (FG) - Number of
filled spikelets per panicle averaged over 4–5 panicles,
Chaffy grains (CG) - Number of sterile spikelets or chaffy
grains per panicle averaged over 4–5 panicles, Spikelet fertility (SF) - Ratio of filled spikelets to the total number of
filled and chaffy spikelets per panicle, expressed in percentage, Grain weight (GW) - Weight in grams of 1000 filled
spikelets, Single plant yield (SPY) - Weight in grams of total
filled grains per plant.
After maturation, the grains were harvested and stored
at room temperature for at least 3 months before processing. The analysis of quality traits was carried out at
Directorate of Rice Research (DRR), Hyderabad. Hulls
were removed from 50 g of rough rice from each plant
using a Huller (Model TH035A Satake, Houston, TX) to
Vemireddy et al. BMC Plant Biology (2015) 15:207
Page 3 of 19
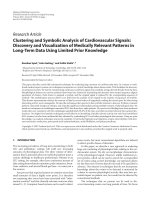
Fig. 1 Agronomic and quality traits of Basmati370, Jaya and F1. a. Plant phenotypes of Basmati370, F1 and Jaya; b - c. Grain appearance
traits of Basmati370, Jaya and F1 before and cooking and F1 before and cooking respectively; d. Grain chalkiness of Basmati370, Jaya
and F1
obtain brown rice. Embryos and the bran layers were removed (polished) from brown rice using miller (McGill,
Model 1, Phillip Rahm International). The standard procedures were followed for recording data of quality traits
as mentioned below:
Grain length (GL) and grain breadth (GB) - Measured
using grain shape tester or dial micrometer for a minimum of 10 full rice grains with both the tips intact,
Grain length- breadth (LB ratio) - Calculated as the
grain length divided by grain breadth, Chalkiness - Ten
whole grains from each of the plant were placed on light
box for scoring chalkiness. Degree of chalkiness was determined by adopting the Standard Evaluation System
for Rice, IRRI-2002 protocols, Grain length after elongation (GLAC) and elongation ratio (ER) - Kernels of rice
varieties expand either breadth wise or lengthwise
upon cooking. The elongation test consisted of soaking of 25 whole milled kernels in 20 ml of distilled
water for 10 minutes and subsequently placing them
in water bath at 98 °C for 10 min. The cooked rice
was then transferred to a Petri dish lined with filter
paper. Ten cooked whole grains were selected and
length was measured by placing them on graph paper.
The elongation was measured as the ratio of the average length of cooked rice kernels to the average
length of uncooked rice kernels, Aroma - The presence of aroma from the rice leaf was evaluated by
following the method developed by Sood and Siddiq
[20]. A strongly scented variety, Basmati370 and a
non-scented variety Jaya were used as checks for scoring
of aroma, Alkali Spreading Value (ASV)/Gelatinization
temperature (GT) - The method of Little et al. [21] was
used for conducting the alkali spreading test. A duplicate
set of six whole-milled grains without cracks was selected
and placed in a plastic box (5 cm × 5 cm × 1.9 cm) containing 1.7 % KOH solution at 29 °C for 23 hrs. Then
grains were carefully separated using forceps, and
ASV of the grains was scored by visual assessment by
seven scale score following Standard Evaluation System
for Rice, IRRI-2002 protocols, and Amylose content
(AC) - The procedure of Juliano et al. [22] was used for
estimation of AC.
Phenotypic data analysis of parents, F1 and F2 individuals
Correlations between character pairs and test for normal
distribution were computed at p <0.05 and p < 0.01 in
Microsoft-Excel (2007). Heterosis, heterobeltiosis and inbreeding depression were calculated using the following
formulae.
Heterosis ¼ ½ðF1−MPÞ=MP x 100
Heterobeltiosis ¼ ½ðF1−BPÞ=BP x 100
Where, MP is Mid parent and BP is Better parent
Vemireddy et al. BMC Plant Biology (2015) 15:207
Inbreeding depression ¼ ½ðF1− F2Þ= F1 x 100
Tests of significance among parents, F1 and mid parental values were calculated employing StatPlus v 4.6
software (www.analystsoft.com/en).
Page 4 of 19
Alignment results were
produced in BAM file format to detect variations by
variant caller algorithm. For variant annotation SnpEff
( tool was used.
Results
Construction of SSR linkage map
Phenotypic evaluations and correlations among traits
DNA from leaf material of the parents i.e., Basmati370
and Jaya, F1, F2, F3 and recombinant inbred lines (RIL)
was extracted by using the modified CTAB method [23].
PCR amplification was performed in a 10 μl volume
containing 10 mM Tris–HCl (pH 8.3), 1.5 mM MgCl2,
0.5 unit of Taq polymerase, 50 μM of dNTPs, and
0.1 μM of each primer with 10 ng of genomic DNA on a
Thermal Cycler (PE9700) with a Ramp speed of 9700
(Applied Biosystems, USA). PCR samples were mixed
with bromo-phenol blue and run on a 3 % agarose gel
(Sigma) containing ethidium bromide along with 50 bp
ladder (MBI Fermentas). Gels were photographed using
Bio-Rad Molecular Imager Gel Doc XR System.
A set of 552 SSR markers spanning all the 12 rice
chromosomes was screened between Basmati370 and
Jaya strains. Out of which, 134 markers that were polymorphic between parents were used for screening the
populations. The heterozygosity of the F1 hybrids has
been confirmed using the polymorphic markers. The χ2
goodness of fit against 1:2:1 segregation ratio in the F2
population was tested using MapDisto software [24].
Linkage map was constructed using the MAPMAKER
version 3.0 [25] following Kosambi mapping function.
Linkage groups were determined using 'group' command
with LOD score of 3.0 and a recombination fraction of
0.4. Order of the markers for each group was determined using 'order' and 'ripple' commands. Linkage
groups were assigned to the respective chromosomes
based on the rice genetic maps developed at Cornell
University [26].
The parents Basmati370 and Jaya differed significantly
(p < 0.05) with respect to majority of the traits studied,
except for panicle length, chaffy grains, spikelet fertility
and single plant yield (Fig. 1; Table 1). The mean of the
F1 hybrids was intermediate for panicle length, 1000
seed weight, grain length (L), grain breadth (B) LB ratio,
alkali spreading value, amylose content, and aroma. For
rest of the traits, the F1 mean exceeded the mean of the
better parent. Except aroma, all the agronomic and quality traits showed transgressive segregation ranging
between 3 and 100 % (Figs. 2 & 3; Additional file 2:
Table S1). As aroma is measured on 1–9 scale whereby
the parents score the extremes of the scale, it was not
possible to get transgressive segregants for this trait.
However, in case of spikelet fertility, all the F2 plants fell
below the parental average resulting in 100 % transgressive segregants. Transgressive segregants observed for
the traits such as panicle length, filled grains, spikelet
number, spikelet fertility, single plant yield and grain
length significantly exceeded either of the parents. However,
in case of plant height, grain length, elongation ratio, alkali
spreading value and amylose content, transgressive segregants exceeded only Basmati370 whereas the number of
panicles, chaffy grains and seed weight exceeded Jaya parent
(Figs. 2 and 3; Additional file 3: Table S2). However, the
number of transgressive segregants with respect to grain
breadth, length-breadth ratio and chalkiness did not significantly (p > 0.05) exceed that of the parents.
Many of the quantitative traits showed normal distribution in F2, F3 and RIL populations in both the environments (ARI, Hyderabad and APRRI, Maruteru) suggesting
polygenic nature of the traits (Fig. 2; Additional files 4 and
5: Figures S2 & S3). As expected, in all the populations
chaffy grains and spikelet fertility skewed towards the lowest and highest values, respectively. In contrast, amylose
content and chalkiness showed unimodal distribution,
whereas alkali spreading value, aroma and chalkiness
showed abnormal distribution in F2 and RIL populations
indicating that these traits might be under the control of
few major genes and modifiers.
Of the agronomic traits, number of panicles and filled
grains per panicle showed significant positive correlation
with plant yield in F2 and RIL populations (Table 2;
Additional file 6: Table S3). Spikelet number showed
positive and significant correlation with panicle length,
filled grains and chaffy grains (p < 0.05). Plant height also
showed significant positive correlations with panicle
QTL analysis
QTLs were detected by interval and composite interval
mapping methods of Windows QTL Cartographer v.2.5
software. Composite interval mapping was conducted using
the default settings (e.g., Model 6, five cofactors selected
automatically by forward regression with a 10-cM window)
( />Basmati genome sequencing
Basmati370 rice DNA was sequenced on SOLiD 4 using
mate pair library kit with the insert size of 1.5 kb to
2.5 kb. Raw data was generated in csfasta and qual files,
and was used for further analysis. Using Lifescope v2.5.1
software, the files were converted into xsq file format.
Reads in xsq were mapped against Nipponbare reference
sequence of complete rice genome sequence from
Vemireddy et al. BMC Plant Biology (2015) 15:207
Page 5 of 19
Table 1 Test of significance among parents and F1s for 18 traits
S.No.
1
Trait
Plant height (cm)
Code
PH
Basmati370 (B)
Jaya (J)
F1
(n = 10)
(n = 10)
(n = 10)
114.79 ± 0.39
84.98 ± 4.65
120.25 ± 2.06
B/J
**
2
No. of panicles
NP
12.57 ± 3.64
8 ± 1.10
15 ± 2.94
*
3
Panicle length (cm)
PL
25.29 ± 2.66
23.33 ± 4.02
24.88 ± 1.03
NS
4
Filled grains (no.)
FG
75.50 ± 4.12
109.25 ± 4.65
167 ± 4.24
**
5
Chaffy grains (no.)
CG
4.86 ± 1.68
7.67 ± 4.50
20.50 ± 3.54
NS
6
Spikelet number
SN
80.25 ± 4.79
116.75 ± 0.50
187.5 ± 0.71
**
7
Spikelet fertility (%)
SF
94.13 ± 2.70
93.58 ± 4.09
89.06 ± 1.93
NS
8
1000 Seed weight (g)
SW
18.2 ± 2.27
23.65 ± 1.25
22.53 ± 1.49
**
9
Single plant yield (g)
SPY
14.19 ± 4.78
17.10 ± 1.10
27.96 ± 1.41
NS
10
Grain length (mm)
GL
6.49 ± 0.27
5.95 ± 0.37
6.24 ± 0.18
**
11
Grain breadth (mm)
GB
1.82 ± 0.05
2.53 ± 0.11
2.20 ± 0.05
**
12
Length-Breadth ratio
LB
3.57 ± 0.17
2.36 ± 0.18
2.84 ± 0.07
**
13
Grain length after cooking (mm)
GLAC
15.1 ± 0.57
9.88 ± 0.83
15.6 ± 0.84
**
14
Elongation ratio
ER
2.33 ± 0.17
1.68 ± 0.17
2.5 ± 0.15
**
15
Alkali spreading value
ASV
5 ± 0.00
7 ± 0.00
6.0 ± 1.05
**
16
Amylose content (%)
AC
21.03 ± 0.37
26.79 ± 0.29
22.8 ± 1.25
**
17
Aroma
ARM
9 ± 0.00
1 ± 0.00
2.00 ± 1.05
**
18
Chalkiness
CHK
1.80 ± 1.03
3 ± 1.63
1.60 ± 0.97
**
**Significant at p = 0.01 ; *Significant at p = 0.05; NS - Non-significant; n - Number of plants
length. As expected, spikelet fertility showed highly significant negative correlation with chaffy grains, while
positive association with filled grains. Panicle length also
showed a significant (p < 0.05) and positive association
with filled grains and spikelet number.
In case of quality traits, only grain appearance and
cooking traits showed association in both the F2 and RIL
populations. As expected, LB ratio showed a significant
positive association with grain length and negative correlation with grain breadth. Similarly, grain length after
cooking strongly associated with the elongation ratio
(Table 2). The physico-chemical traits like amylose content, chalkiness, ASV did not show any association
among themselves and with other traits clearly indicating the oligogenic nature of the traits.
Parental polymorphism and segregation of marker loci
In the present study, 203 of the 552 microsatellite markers
tested produced polymorphic and scorable bands (42.12 %
polymorphism) between the parents Basmati370 and Jaya.
Of 203 polymorphic loci, 60 markers which could not be
scored were excluded from screening the F2 population.
Nine markers were found to be unlinked. The remaining
134 markers used for construction of genetic linkage map
comprised of 129 rice microsatellite markers, two from
the waxy gene (MX4 and WXSSR), two markers linked to
major QTL of grain length (RM353w and JL14), and one
gene (fgr) specific STS (sequence tagged site) marker. Out
of 134 markers, 98 (73.13 %) showed varying degrees of
segregation distortion on all the 12 chromosomes suggesting that the distortion was random and not confined to
any specific part of the rice genome (Additional file 3:
Table S2). Majority of the markers represented heterozygotes, while very few (~9 %) showed Basmati370 alleles.
The highest number of markers showing distorted segregation were mapped to chromosome 8 (12), whereas the
lowest number (1) was mapped to chromosome 12.
Linkage map
For mapping QTLs, a genetic map has been constructed
employing 181 F2 offspring and 134 markers. The linkage
map (LOD-score ≥3.0) placed 134 markers on 12 linkage
groups spanning a total map length of 2443.6 cM with an
average distance of 18.37 cM between adjacent marker loci.
However, there were five large genetic gaps of 55–72 cM on
chromosomes 1, 2, 8, 9 and 12. Excluding these genetic gaps,
the average interval of remaining markers was 16.41 cM. A
comparison of Basmati genetic map was made with previously published genetic maps and represented in Table 3.
QTL Mapping
In all, 34 QTLs were identified for 16 agronomic and grain
quality traits (Fig. 4; Table 4). Of these, majority of the
alleles with enhanced effect were found to be contributed by Basmati parent. Of 34 QTLs, 12 QTLs explained
more than 15 % phenotypic variation between parents.
Vemireddy et al. BMC Plant Biology (2015) 15:207
Page 6 of 19
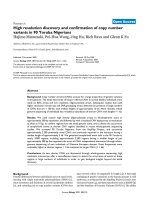
Fig. 2 Phenotypic distributions of agronomic traits in 181 F2 offspring derived from a cross between Basmati370 and Jaya. B - Basmati370; J Jaya; F1 - Hybrid; F2 - F2 progeny
Very few QTLs were identified for plant height, number
of filled grains, spikelet number and single plant yield.
This may be attributed to various reasons like genetically
distant populations, non-detection of minor QTLs, and
environmental effects.
QTLs for plant height
Only one QTL, designated as qPH1.1, was identified for
plant height trait on chromosome 1 at an interval of
RM302‐RM11968 and it accounted for 15.42 % phenotypic variance. Alleles from Basmati370 were associated
with increased plant height.
of a major gene governing the trait. Increasing effect of
this QTL resulted from the Basmati parent.
QTLs for chaffy grains
A total of three QTLs influencing chaffy grains designated as qCG3.1, qCG9.1, and qCG12.1 were identified
one each on chromosomes 1, 9 and 12, respectively.
Together they explained 3.246 % phenotypic variation.
The increasing effect at all the loci for chaffy grains was
contributed by Jaya parent.
QTLs for spikelet number
Two minor QTLs were identified for panicle length. Of
which, one QTL was on chromosome 2 (qPL2.1) and another on chromosome 6 (qPL6.1) with marker intervals
of RM6318-RM263 and RM276-RM527, respectively.
The enhanced quantitative effect was contributed by the
Basmati370 suggesting that a major part of the variation
in panicle length is due to environmental influence.
Two regions were found to be associated with QTLs for
spikelet number viz., qSN3.1 and qSN10.1 on chromosome 3 and 10, respectively. Of the two QTLs, the QTL
qSN3.1 explained zero percent phenotypic variation of
the trait suggesting that the genes within this QTL region might be having opposite effects, whereas qSN10.1
accounted for 6.7 % of the phenotypic variation with the
allele from the Jaya parent contributing to the enhancing
effect.
QTLs for filled grains
QTLs for spikelet fertility
A single QTL designated as qFG1.1 was identified on
chromosome 1 in the marker interval of RM11968‐
RM14. It explained 22.68 % of the phenotypic variance
between the parents indicating the possible involvement
Three QTLs, one on chromosomes 9 (qSF9.1) and
remaining two on chromosome 12 (qSF12.1 and qSF12.2)
affecting spikelet fertility were identified. Together
they accounted for 10.92 % of the phenotypic
QTLs for panicle length
Vemireddy et al. BMC Plant Biology (2015) 15:207
Page 7 of 19
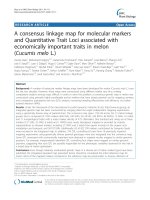
Fig. 3 Phenotypic distributions of quality traits in 181 F2 offspring derived from a cross between Basmati370 and Jaya. B - Basmati370; J- Jaya;
F1 - Hybrid; F2 - F2 progeny
variance. At all the three loci Basmati parent contributed to spikelet fertility.
QTLs for single plant yield
Two QTLs, qSPY2.1 and qSPY9.1 were identified for single plant yield on chromosomes 2 and 9, respectively.
The QTL qSPY9.1 on chromosome 9 explained 8.15 %
phenotypic variance. The other QTL, qSPY2.1 accounted
for only 4.06 % of the phenotypic variance. The allele for
increased grain yield was contributed by Basmati370 for
qSPY9.1 and Jaya for qSPY2.1.
QTLs for grain length
A total of two QTLs viz., qGL3.1 and qGL5.1 with
phenotypic variance of 46.01 % and 17.47 %, were
detected on chromosomes 3 and 5, respectively. The increasing effect for these two QTLs was associated with
Basmati370 allele.
1.65 % phenotypic variance. In all these QTLs, increased
effect was contributed by the parent Jaya. For the QTL
qGB8.1, Basmati370 and Jaya alleles have opposite
effects resulting in zero percent variance in phenotype.
The two QTLs, qGB1.1 and qGB8.1 identified in the
present study appears to be novel.
QTLs for Length-Breadth ratio (LB)/Grain size
A total of three QTLs influencing this trait were identified.
In all the QTLs, alleles from Basmati370 contributed to
increase in LB ratio. The QTLs, qLB3.1 on chromosome 3
and qLB5.1 on chromosome 5 explained 22.34 and
46.53 % phenotypic variation, respectively. The other
QTL, qLB1.1 explained 3.93 % phenotypic variance.
QTLs for grain length after cooking (GLAC)
A QTL associated with GLAC, qGLAC12.1 contributing
2.68 % phenotypic variance was located on chromosome
12. Basmati allele was associated with an increase of
GLAC as was the case in grain length.
QTLs for grain breadth
Three QTLs, qGB1.1, qGB5.1 and qGB8.1 were found to
be responsible for grain breadth. Of them, one QTL,
qGB5.1 on chromosome 5 had a major effect explaining
17.15 % phenotypic variance and one QTL qGB1.1 on
chromosome 1 had a relatively minor effect explaining
QTLs for elongation ratio (ER)
One QTL, qER5.1 was identified for this trait on chromosome 5 explaining 18.9 % phenotypic variance. The allele
from a Basmati370 contributed to the elongation ratio at
this region.
Trait
PH
NP
PH
1.000
NP
0.075
1.000
PL
FG
CG
SN
SF
SW
SPY
GL
GB
LB
GLAC
ER
ASV
AC
ARM
PL
0.454*
−0.026
1.000
FG
0.395
−0.006
0.557**
CG
−0.046
0.054
0.090
−0.313
1.000
SN
0.316
0.038
0.579**
0.643**
0.524**
1.000
SF
0.208
−0.072
0.111
0.617**
−0.874**
−0.151
1.000
SW
0.143
−0.059
0.158
0.066
0.132
0.166
−0.062
1.000
SPY
0.345
0.629**
0.267
0.502**
−0.069
0.394
0.237
0.131
1.000
GL
0.065
0.081
0.100
−0.033
0.032
−0.002
−0.029
0.223
0.129
1.000
GB
0.063
0.020
0.051
0.038
0.177
0.172
−0.081
0.380
0.110
−0.266
1.000
LB
−0.003
0.031
0.017
−0.024
−0.110
−0.106
0.052
−0.149
0.006
0.714**
−0.856**
GLAC
0.039
0.165
0.145
0.261
0.008
0.238
0.065
0.227
0.245
0.402
−0.028
0.236
1.000
ER
0.004
0.113
0.088
0.315
−0.014
0.268
0.092
0.097
0.174
−0.205
0.146
−0.203
0.811**
ASV
−0.008
−0.114
0.181
0.009
0.009
0.014
0.019
0.029
−0.067
−0.074
−0.063
−0.008
−0.118
−0.082
1.000
AC
0.123
−0.056
0.038
0.102
−0.188
−0.051
0.170
0.000
0.051
−0.030
−0.016
0.001
−0.076
−0.051
0.149
1.000
0.130
0.115
0.063
−0.100
0.028
−0.07
−0.080
−0.082
0.100
0.099
−0.070
0.0979
0.034
−0.020
−0.030
−0.080
1.000
0.041
−0.040
0.057
0.020
0.066
−0.000
0.1844
0.119
−0.070
0.341
−0.27
0.129
0.173
−0.210
−0.060
−0.140
ARM
CHK
−0.00
CHK
Vemireddy et al. BMC Plant Biology (2015) 15:207
Table 2 Correlation coefficients among 18 traits of F2 population derived from the cross between Basmati370 and Jaya
1.000
1.000
1.000
1.000
**Significant at p = 0.01 *Significant at p = 0.05 ; For trait codes refer Table 1
Page 8 of 19
Vemireddy et al. BMC Plant Biology (2015) 15:207
Page 9 of 19
Table 3 Comparison of Basmati genetic map with previously published rice genetic maps
Current study
Qi-Jun et al. (2006) [35]
Temnykh et al. (2001) [36]
Harushima et al. (1998) [37]
Parents
Basmati370/Jaya
Nipponbare/93-11
IR64/Azucena
Nipponbare/Kasalath
Type of the population
F2
F2
DH
F2
Size of the population
181
90
96
186
Type of the markers
SSR
SSR
SSR & RFLP
RFLP
Number of the markers
134
152
>500 SSRs & 145 RFLPs
2275
Map length (cM)
2443.6
2455.7
1794.7
1521.6
Genetic distance between
markers (cM)
18.23
16.16
2.78
<2
Physical distance between
markers (kb)
3208.9
2828.9
666.7
189.01
QTLs for alkali spreading value (ASV)/ gelatinization
temperature (GT)
One major QTL for ASV, qASV6.1 on chromosome 6
was identified with the highest LOD value of 26.75
explaining a maximum of 71.74 % phenotypic variance.
The allele from Jaya had a strong positive effect on ASV.
QTL cartographer LOD peak for alkali spreading value
is given in Fig. 5.
QTLs for amylose content (AC)
One QTL qAC4.1 explaining 15.25 % phenotypic variance was detected on chromosome 4. The Jaya allele had
an increasing effect on this trait. The QTL identified
here is in contrary to the previous reports whereby the
major QTL controlling AC (waxy gene) was located on
chromosome 6.
QTLs for aroma
Six QTLs designated as qARM1.1, qARM2.1, qARM8.1,
qARM8.2, qARM8.3 and qARM12.1 influencing aroma
were identified. Of these, three QTLs qARM8.1,
qARM8.2 and qARM8.3 were located on chromosome 8
explaining 0.22, 3.12, and 20.23 % phenotypic variance, respectively. The other three QTLs qARM1.1, qARM2.1 and
qARM12.1 located on chromosomes 1, 2 and 12, respectively, together contributed 3.51 % phenotypic variance.
These QTLs are novel ones and are specific to Basmati
varieties as they are being reported for the first time.
ratio were found to be located on the same genomic region of chromosome 5 viz., qGL5.1, qGB5.2, qLB5.1 and
qER5.2 as reported earlier [15, 27, 28]. However, this trend
was not seen for other significantly correlated traits such
as plant height, panicle length, filled grains and single
plant yield. The QTLs relating to these traits have been
mapped onto different chromosomes implying that these
traits are possibly controlled by independent and unrelated genes.
However, in the region of RM430 and RM18600 effects
of three QTLs for grain breadth (qGB5.2), grain length
(qGL5.1), and length-breadth ratio (qLB5.1) are in different directions, suggesting involvement of tightly linked
genes as the cause of the correlation of these traits.
Confirmation of QTLs in F3 population
As the quantitative traits are with low heritability, the
phenotypic mean of the F3 progeny derived from each of
the F2 plant along with its genotyping data was used (as
was done earlier [29]) in order to confirm the mapped
QTLs identified in F2 population. Using F2:3 design, we
have identified a total of 10 QTLs for various agronomic
traits viz., plant height (1), number of panicles (2), chaffy
grains (2), spikelet number (1), spikelet fertility (1) and
plant yield (3). Of these, two QTLs viz., qPH1.1 for plant
height and qSPY9.1 for plant yield have been commonly
observed in both F2 and F2:3 designs with a phenotypic
variance of 21.55 % and 23.88 %, respectively (Additional
file 7: Table S4).
QTLs for chalkiness (CHK)
A total of two QTLs, qCHK4.1 and qCHK5.1 were identified on chromosomes 4 and 5 with the increased effects from the Basmati and Jaya, respectively. The QTLs
for grain breadth and chalkiness were found to be colocalised and showed a positive significant correlation.
Our results are consistent with the earlier study [27].
QTL clusters for grain appearance traits
In the present study, QTLs related to highly correlated
traits like grain breadth, grain length, and length-breadth
QTL mapping in the RIL population
When we compared the QTLs identified in the F2 population with that of RILs of the cross between Basmati370
and Jaya, we could identify only 12 common QTLs for
10 traits in both the populations (Additional file 8: Table
S5). The phenotypic variance of all the QTLs except
filled grains and plant yield was more than 15 % within a
range of 9.3 to 73.52 %. In RIL population, QTL for
alkali spreading value (qASV6.1) showed high LOD
(27.33) and phenotypic variance (73.52 %) similar to that
Vemireddy et al. BMC Plant Biology (2015) 15:207
Page 10 of 19
Table 4 Quantitative trait loci (QTLs) detected in Basmati370/Jaya F2 population
SN
Trait
QTL
C
Marker interval
LFM
RFM
1
Plant height (cm)
qPH1.1
1
RM302-RM11968
16
10.4
5.138
7.908
2
Panicle length (cm)
qPL2.1
2
RM6318-RM263
16
9.28
3.039
0.456
1.636
0.925
qPL6.1
6
RM276-RM527
2
10.22
3.413
0.408
−1.773
0.819
3
LOD
A
D
PVE
−0.858
15.418
4
Filled grains (no.)
qFG1.1
1
RM11968-RM14
10
19.55
3.244
31.165
−28.073
22.677
5
Chaffy grains (no.)
qCG3.1
3
RM85-RM565
20
30.2
4.284
−3.532
−13.439
0.46
6
qCG9.1
9
RM107-RM566
34
80
3.021
−2.71
−10.48
0.328
7
qCG12.1
12
RM247-RM463
34
15.23
5.211
−7.804
−15.738
2.458
qSN3.1
3
RM5864-RM426
14
10.16
2.788
666
−1.593
0
qSN10.1
10
RM216-RM171
26
1.29
2.885
−19.354
−6.115
6.661
qSF9.1
9
RM107-RM566
56
58
2.562
4.208
5.35
2.202
qSF12.1
12
RM463-RM235
14
11.15
7.255
7.155
1.973
4.249
qSF12.2
12
RM17-RM19
48
66
3.441
5.987
−4.491
4.472
qSPY2.1
2
RM263-RM525
0
25.55
3.72
−2.258
3.979
4.06
qSPY9.1
9
RM107-RM566
48
66
3.154
8.397
−4.769
8.15
qGL3.1
3
RM353-JL14
10
1.7
9.217
0.362
−0.125
46.065
qGL5.1
5
RM430-RM18600
6
5.2
6.603
0.217
0.031
17.468
qGB1.1
1
RM473A-RM8278
0
34.52
6.714
−0.038
0.119
1.649
8
Spikelet number (no.)
9
10
Spikelet fertility (%)
11
12
13
Single plant yield (g)
14
15
Grain length (mm)
16
17
Grain breadth (mm)
18
qGB5.1
5
RM430-RM18600
4
7.2
3.333
−0.106
0.052
17.149
19
qGB8.1
8
RM502-RM310
16
64.66
3.454
666
0.015
0
20
Length-Breadth ratio
21
22
qLB1.1
1
RM473A-RM8278
0
34.52
5.063
0.116
−0.208
3.928
qLB3.1
3
RM353-JL14
8
3.7
4.358
0.22
−0.129
22.342
−0.07
46.531
qLB5.1
5
RM430-RM18600
8
3.2
4.65
0.405
23
Grain length after cooking (mm)
qGLAC12.1
12
RM247-RM463
0
49.23
3.512
0.312
0.396
2.68
24
Elongation ratio
qER5.1
5
RM430-RM18600
4
7.2
3.711
0.136
0.067
18.931
25
Alkali spreading value
qASV6.1
6
RM276-RM527
4
8.22
26.746
−1.257
0.264
71.735
26
Amylose content (%)
qAC4.1
4
RM280-RM127
0
11.15
4.077
−0.97
0.315
15.249
27
Aroma
qARM1.1
1
RM8278-RM582
74
40
6.735
0.654
5.284
1.859
28
qARM2.1
2
RM138-RM475
80
32.06
7.59
−0.178
−5.332
0.133
29
qARM8.1
8
RM502-RM310
36
44.66
6.976
−0.23
−5.309
0.218
30
qARM8.2
8
RM152-RM42
18
23.56
6.132
0.968
−5.312
3.116
31
qARM8.3
8
RM404-RM483
8
16
4.998
2.476
0.511
20.226
qARM12.1
12
RM17-RM19
30
84
7.556
−0.589
−5.334
1.512
qCHK4.1
4
RM564-RM348
14
28.62
3.138
2.107
−0.142
63.795
qCHK5.1
5
RM289-RM430
6
12.88
3.835
−0.809
0.359
14.533
32
33
34
Chalkiness
A- Additive; D- Dominance; C- Chromosome; PVE- Phenotypic variance explained by each QTL (%); Left (LFM) and right (RFM) flanking marker distance from the
QTL (cM);Positive and negative values of additive effect indicates the increasing effect coming from the alleles of Basmati370 and Jaya, respectively.
observed in the F2 population. This clearly suggests that
even with preliminary mapping populations like F2, it is
possible to identify the major QTLs with an appropriate
population size.
Gene ontology (GO) analysis of the genes underlying
major QTLs
Since a typical QTL region contains several hundreds of
genes, it is necessary to filter them further in order to
pinpoint the right candidate gene(s) underlying the trait.
Given the advances in rice genome annotation, now it is
possible to integrate the putative gene function with the
associated gene ontology (GO) terms. In the present
study, the total number of genes underlying each major
QTL interval was retrieved from the RiceTOGO
Browser ( Using this list
of total genes in each major-effect QTL marker interval,
the percentage of annotated genes and significantly
Vemireddy et al. BMC Plant Biology (2015) 15:207
Page 11 of 19
Fig. 4 Distribution of QTLs for 16 traits in the molecular linkage map of Basmati. QTLs are indicated in bold (red colour) at right side of the
linkage group. For codes of the traits refer Table 1. Names of the markers are represented left side of the linkage group. Numbers in parenthesis
are genetic distance between markers in centimorgans (cM)
overrepresented GO terms were estimated. The percentage of annotated genes for each promising QTL varied
from 84.56 % to 99.64 % with an average of 93.55 %,
while significantly enriched or overrepresented GO
terms ranged from zero to 17.42 %, the average being
4.41 % (Table 5).
Genomics based candidate genes prediction in the major
QTL regions
In an attempt to identify the candidate genes for the
novel major QTLs, we have sequenced the Basmati370
genome, compared with the publicly available Nipponbare sequence and shortlisted the genes with non-
synonymous SNPs (nsSNPs). In the QTL interval governing the filled grain trait, we have identified 48/266
genes with nsSNPs within the targeted QTL regions.
Previously, it has been demonstrated that the auxins
have a role in the grain filling by regulating the invertase
enzymes [30]. In the present study also, we have identified one auxin response factor (LOC_Os01g70270)
found to have a nsSNP (cGa/cAa) in which arginine
(R) was replaced by glutamine (Q) at position 530
(Additional file 9: Table S6). Transcriptome analysis by
qTeller software ( provided further
evidence that the expression of this gene is high at
25 days after pollination of the endosperm stage.
Trait
Chr. QTLs
Marker
interval
Total
no.
of
genes
No. gene Annotated
annotated genes (%)
No.
Significant
significant terms
GO (%
GO terms
Known QTLs/Genes
Gene function
Plant Height
1
qPH1.1
RM302RM11968
534
528
98.88
92
17.42
sd1
Gibberellin- 20 oxidase 2
Filled Grains
1
qFG1.1
RM11968RM14
266
265
99.62
0
0.00
Grain Length/LB Ratio
3
qGL3.1/qLB3.1
RM353-JL14
204
201
98.53
1
0.50
qGL-3, kl3.1,qGL-3A, GS3,
qLWR3
GS3-Putative transmembrane
protein
Grain Length/Breadth/LB
Ratio
5
qGL5.1/qGB5.1/qLB5.1/
qER5.1
RM430RM18600
28
24
85.71
0
0.00
qGT-6
soluble starch synthase II-3
Fgr
Betain aldehyde
dehydrogenase-2
Alkali Spreading Value
6
qASV6.1
RM276-RM527 242
209
86.36
0
0.00
Amylose content
4
qAC4.1
RM280-RM127 61
56
91.80
9
16.07
Aroma
8
qARM8.1
RM404-RM483 88
87
98.86
0
0.00
Chalkiness
4
qCHK4.1
RM564-RM348 1355
1181
87.16
52
4.40
Vemireddy et al. BMC Plant Biology (2015) 15:207
Table 5 Known QTLs/ genes and GO terms underlying the major QTLs
Page 12 of 19
Vemireddy et al. BMC Plant Biology (2015) 15:207
Page 13 of 19
Fig. 5 QTL cartographer LOD peak for alkali spreading value. a) Markers and their genetic distances are given in X-axis and LOD values in Y-axis;
b) Phenotypic variance explained by the alkali spreading value QTL
Similarly, we were able to predict the candidate gene
underlying the QTL cluster consisting of four QTLs
viz., qGL5.1, qGB5.1, qGLB5.1, and qER5.1 controlling
grain appearance traits as VQ domain containing protein (LOC_Os05g32460) as it contains one nsSNP (aCt/
aTt) where threonine was replaced by isoleucine.
were predicted by comparing Basmati genome sequence
with that of Nipponbare. So far, many major QTLs have
been mapped in rice, however, to our knowledge, this
study is the first attempt made to carry out genomewide mapping for the dissection of the genetic basis of
economically important traits of Basmati rice.
Discussion
With the advent of high yielding varieties ensuring
higher farm returns, serious threat to Basmati rices was
perceived by the breeders prompting them to resort to
breeding for varieties of Basmati quality in high yielding
background. But for reasons that are beginning to be
understood, no variety ideally matching the traditional
Basmati could be evolved. Genetic investigations have
revealed that all traits except one or two are controlled
quantitatively and selections based on phenotype are not
reliable enough [19, 31]. The present study was undertaken with the objective of identifying QTLs governing
the key characters of Basmati rice. We have identified 34
QTLs governing 16 economically important traits of
Basmati rice employing F2, F3, and Recombinant Inbred
Line (RIL) mapping population derived from a cross between Basmati370 and a semi-dwarf rice variety Jaya.
Out of 12 major-effect QTLs identified, four QTLs coincided with the previously known genes sd1, GS3, alk1
and fgr and for the remaining QTLs, candidate genes
Divergence and distinctness of Basmati rice
In the present study, the polymorphic markers were
found distributed on all the 12 chromosomes of Basmati
rice (Fig. 4). The existence of high parental polymorphism (42.12 %) provided evidence to the divergence and
distinctness of Basmati rice from the other rice groups
viz., indica and japonica [3, 32]. The percent polymorphism detected in this study is higher than the previously reported value (28.9 %) where an evolved
Basmati variety (Pusa1121) was used [19] and lower
(63.95 %) when a traditional Basmati (Basmati370) was
used as a parent [18, 33]. The significant effects of distorted markers on linkage estimation provide insights
for genetic mapping analysis of genes or QTLs. Out of
134 markers, 98 showed varying degrees of segregation
distortion on all the 12 chromosomes suggesting that
the distortion was random and not confined to any
specific region of the rice genome (Additional file 3:
Table S2). Our results are in agreement with earlier findings [19] wherein segregation distorted loci were distributed
Vemireddy et al. BMC Plant Biology (2015) 15:207
over eight chromosomes viz., 2, 3, 4, 6, 7, 8, 9 and 10. Majority of the markers represented heterozygosity, while
very few (~9 %) showed Basmati370 alleles. The highest
number of markers (12) showing distorted segregation
were mapped to chromosome 8, whereas the lowest
number (1) was mapped to chromosome 12.
Construction of linkage map
According to Lander and Botstein [34], the linkage map
with an average interval less than 20 cM is suitable for
QTL mapping. The genetic map of Basmati is 2443.6
cM and is shorter (2455.7 cM) than the map reported by
Qi-Jun et al. [35] and longer than some of the notable
maps constructed using inter-sub specific rice populations that are either 1794.7 cM [36] or 1521.6 cM [37]
(Table 3).
In this study, we observed higher genetic distances between some of the markers and this could be attributed
to (a) deviation of 73.13 % of markers from actual segregation ratios as pointed out in the previous study [38],
(b) stretching effect of markers on chromosomes caused
by small population size [38], and (c) map expansion
due to excess heterozygosity in segregating markers. Our
results are in agreement with that of Knox and Ellis [39].
The increase in the total map length due to stretching
effect has been reported in several crops including rice
[38], sorghum [40] and barley [41].
QTL mapping of agronomic traits
Using populations derived from a cross between Basmati370 and Jaya parents, we detected 34 QTLs and compared them with previously reported ones. For plant
height, only one QTL, designated as qPH1.1, was identified on chromosome 1. Interestingly, near qPH1.1, semi
dwarf gene, sd1 which encodes a gibberellic acid 20oxidase (OsGA20ox-1) (LOC_Os01g66100), that catalyzes
the conversion of GA53 to GA20 in gibberellic acid biosynthesis in rice [42–44] was found to be present. Ishimaru et
al. (2004) identified a sucrose phosphate synthase gene
controlling plant height on a different region of the same
chromosome [45]. For panicle length two minor QTLs
were identified one each on chromosome 2 (qPL2.1) and
chromosome 6 (qPL6.1). Previous studies reported an aberrant panicle organization-1 (APO-1) gene encoding an
F-box protein on chromosome 6. A mutation in this gene
was reported to result in reduced panicle length and less
number of spikelets per panicle [46]. In the present study
we identified a single QTL designated as qFG1.1 for filled
grains on chromosome 1. Like plant height QTL, this
QTL also was very close to sd1 gene (~80 kb). The cytokinin accumulation in inflorescence meristems was previously reported to down regulate OsCKX2 which then
results in increase in the reproductive organs causing
enhanced grain yield [47]. A gene underlying grain
Page 14 of 19
number QTL, Gn1a encoding cytokinin oxidase/dehydrogenase (OsCKX2) that degrades phytohormone cytokinin
has also been reported on chromosome 1. However, the
QTL detected in the present study and Gn1a are not same
suggesting that qFG1.1 seems to harbour other candidate
genes that control grain number through mechanism(s)
that are yet to be elucidated. A gene underlying major
QTL (Ghd7) which encodes a CCT domain protein has
also been identified on chromosome 7 with a major effect
on the number of grains per panicle and heading date
[48].
For single plant yield, we identified two QTLs, qSPY2.1
and qSPY9.1 on chromosomes 2 and 9, respectively. Previous reports identified a yield improving QTL GY2-1
using the parents Dongxiong (a wild rice, Oryza rufipogan Griff.) and Guichao2 (Oryza sativa ssp indica) and
located it on upstream of the QTL qSPY2.1 on chromosome 2 [47, 49]. This QTL was governed by a leucine
rich repeat receptor kinase gene cluster.
QTL mapping of grain appearance traits
A total of two QTLs for grain length viz., qGL3.1 and
qGL5.1 were detected on chromosomes 3 and 5, respectively. Interestingly, these regions coincide with major
QTLs reported for grain size by numerous other studies
carried across different environments and genetic backgrounds [11, 50–53]. Therefore, the present study tends
to support the general conclusion made earlier [54] that
a substantial proportion of QTLs affecting a trait particularly those having major effects can be identified
under different environments. The major QTL i.e., GS3
which controls both grain length and weight has been
previously identified on chromosome 3 [11]. It has been
dissected into a gene which encodes a putative PEPB
(Phosphatidyl ethanolamine-binding protein)-like domain, a transmembrane region, a putative TNFR (tumor
necrosis factor receptor) /NGFR (nerve growth factor receptor) family cysteine rich domain, and a VWFC (von
willebrand factor type C) module. Comparative sequence
analysis identified a non-sense mutation in the second
exon of the putative GS3 gene in all long-grain varieties
when compared to small grain varieties. This mutation
causes a 178 amino acid truncation in the C-terminal region of the predicted protein, suggesting that GS3 may
function as a negative regulator for grain size [11]. It can
be inferred that the major QTL for grain length detected
in this study on chromosome 3 is likely to be the same
locus as the one reported by earlier studies [51, 55]. It is
also interesting to note that the chromosome region of
maize flanked by umc164c and umc157 on chromosome
1 harbouring a QTL for kernel length is homologous to
the short arm of the rice chromosome 3 suggesting the
possibility of orthology between rice and maize genes
governing kernel length in this region [56]. The QTL,
Vemireddy et al. BMC Plant Biology (2015) 15:207
qGL5.1 identified in the present study also coincides
with the earlier reports. Since the underlying gene has
not been identified yet, this QTL could be a potential
candidate for dissection.
For grain breadth, out of three QTLs qGB1.1, qGB5.1
and qGB8.1 identified in the present study, two QTLs,
qGB1.1 and qGB8.1 appears to be novel since major
QTL/gene (s) reported by other groups were located on
chromosomes 2 and 5. A major QTL for grain width,
i.e., GW2 on chromosome 2, has been identified; which
encodes a RING type protein with E3 ubiquitin ligase
activity and is known to function in the ubiquitinproteasome pathway [57]. Further, loss of GW2 function,
increases cell number resulting in a larger or wider
spikelet hull and accelerated grain milk filling rate which
consequently enhances grain width, weight and yield.
Similarly, a QTL for grain width, i.e., qGW5 on chromosome 5 had been delimited to 2,263 bp fragment of
Kasalath genomic region [58]. Comparative analysis of
Kasalath revealed that Nipponbare region harboured a
1212 bp deletion and several SNPs. A recent study in
maize demonstrated that the grain width gene on
chromosome 2 i.e., GW2 has two orthologous duplicated
genes viz., ZmGW2-CHR4 and ZmGW2-CHR5 with
similar function of controlling the kernel size and weight
even after crop diversification during evolution [59].
The co‐localization of QTLs for grain breadth and
chalkiness as well as positive significant correlation between these two traits observed in the present study suggests that breeders can simultaneously improve these
two traits. These results are consistent with the earlier
study [27, 60] where QTLs for grain width and chalkiness were mapped at a marker interval of RG360 and
C37349 on the same region of the chromosome 5. Recently, it has been reported that a gene influencing grain
chalkiness i.e., Chalk5 encodes a vacuolar H+-translocating pyrophosphatase [12]. This gene is located upstream
of qCHK5.1. Interestingly, a gene governing vacuolarprocessing enzyme (LOC_Os04g45470) was located
within the QTL region of qCHK4.1. In the same QTL region, soluble starch synthase 3 (LOC_Os04g53310), a key
enzyme in the starch biosynthesis pathway is also located. These two QTLs seem to be potential targets for
manoeuvring chalkiness in rice.
A total of three QTLs influencing length-breadth ratio
(LB) / grain size were identified, out of which qLB3.1 on
chromosome 3 and qLB5.1 on chromosome 5 were located in the vicinities of qGL3.1 controlling grain length
and qGB5.1 controlling grain breadth traits, respectively.
Such association is not surprising because LB ratio is a
derived trait obtained by dividing the grain length by
grain breadth. Our results are consistent with previous
reports obtained across different environments and genetic backgrounds [27, 28] suggesting that these QTLs
Page 15 of 19
are controlled by a few major genes with modifiers.
Hence, these QTLs may be considered as potential candidates for future fine mapping and cloning studies.
QTL mapping of cooking quality traits
We identified QTL for grain length after cooking (GLAC)
on chromosome 12. Although the grain length after cooking is one of the unique quality traits of the Basmati rice,
the genomic regions governing the trait are not yet identified. In non-Basmati rices, however, scattered reports of
mapping QTL regions for this trait are available. Among
them, initially, a QTL on chromosome 8 associated with
cooked kernel elongation has been identified and concluded that this QTL was loosely linked to the fragrance
gene [16, 61]. Subsequently, three QTLs on chromosomes
2, 6 and 11 [62] and a single QTL on chromosome 3 [56]
and two QTLs each on chromosomes 2 and 6 [63] have
been identified for this trait.
We have identified one QTL for elongation ratio (ER),
qER5.1 on chromosome 5. However, previously, a QTL
for ER, elr11-1 was identified on chromosome 11. Likewise, three more QTLs have been identified on chromosomes 2, 4 and 12 with major QTL being qER-2 [64].
One major QTL for alkali spreading value, qASV6.1
identified on chromosome 6 was mapped along with alk
gene (Fig. 4). The alk gene encodes soluble starch
synthase IIa (SSIIa) and is associated with gelatinization
temperature. Thus our results are in agreement with the
previous reports in showing that GT is primarily controlled by alk gene [17, 65, 66]. However, contrary to
these results, it has been demonstrated that GT is controlled by a waxy gene [27, 67]. These observations infer
that the genetic factors other than the alk gene are probably involved in altering the GT variation indicating that
alk is a major but not the sole player in GT variation. Previous reports suggested that the SSIIa is one of the important biosynthetic enzymes determining starch
structure and its properties [8, 68]. The SSIIa enzyme
seems to have a role in the elongation of A and B1 amylopectin chains, and determines the ratio of two chain
lengths, i.e., L- type (present in indica rices) and S-type
(present in japonica rices) [8, 68]. However, in Basmati
rice, being a separate group from indica and japonica rice,
it would be interesting to understand the role as well as
the structure of SSIIa. In the present study, we identified
one QTL for amylose content, qAC4.1 on chromosome 4.
Although different amylose classes viz., waxy (~0 %), low
(2-19 %), intermediate (20-25 %) and high (>25 %) are
known to be associated with the variability in the waxy
gene which encodes granule- bound starch synthase
(GBSSI) on chromosome 6, the waxy gene alone could not
explain the global phenotypic variability of the trait due to
the availability of subclasses within each major class
prompting us to speculate the existence of the loci other
Vemireddy et al. BMC Plant Biology (2015) 15:207
than waxy gene [55]. Probably, the QTL identified in the
present study interacts with the waxy locus to control the
final amylose content which is specific to Basmati rices.
The key gene governing the aroma encodes betain
aldehyde dehydrogenase (badh2) that is known to be
located on chromosome 8. Further, it has been reported
that all the fragrant rices harbour an 8 bp deletion when
compared to the non-fragrant varieties [9]. We have
identified six novel QTLs that are specific to Basmati
variety as they are being reported for the first time. Contrary to many studies where aroma is reported to be
controlled by a single recessive gene, in the present
study aroma behaved like a polygenic trait. Of six QTLs
for aroma, three from Basmati370 and four from Jaya
explained the increased effect, suggesting that the environment where the experiment was conducted seemed to
influence the expression of aroma. Moreover, Basmati
needs cool temperatures during flowering period for expression of its unique traits especially pleasant aroma.
The non-detection of major QTLs for the aroma could
be attributed to the current experimental conditions.
QTL clusters for grain appearance traits
Several earlier studies have demonstrated that QTLs for
correlated traits often map to the same chromosome regions [29, 55, 69, 70]. In our study, we have found QTLs
related to highly correlated traits like GB, GL and LB ratio to be located on the same genomic region of
chromosome 5. Classical quantitative genetics assumes
that trait correlation can be attributed to the effect of
pleiotropy or to the tight linkage of causative genes. If
pleiotropism is the major reason, coincidence of both
the location of QTL for related traits as well as the direction of their genetic effects can be expected. If the
tight physical linkage of the genes is the major reason,
the direction of the genetic effect of QTL for different
traits may be different, although the coincidence of the
location of QTLs can still be expected [28].
Stable QTLs or major QTLs of promise
The genomic regions or QTLs, which are consistently detected over a range of environments or mapping populations or different parental crosses, are considered “stable or
major QTLs” and are preferred targets in crop improvement. Despite the fact that the present study was carried
out by a single cross, the identified common QTLs in all
the F2, F3 and RIL populations can be considered as stable
or major effect QTLs. Together with the results of previous
studies, seven QTLs viz., qPH1.1 [42–44], qGL3.1, qGB5.1,
qLB3.1, qLB5.1 [11, 28], qASV6.1 [71] and qARM8.2 [9, 72]
that are associated with five traits of Basmati can be considered as stable QTLs. As described by Wan et al. [28],
the major effect QTLs are more likely to behave as stable
Page 16 of 19
QTLs across multiple environments/genetic backgrounds.
These QTLs, apart from their suitability in the improvement of the traits concerned, can also serve as potential
candidates for fine mapping and also facilitate the
development of near-isogenic lines and advanced
breeding lines. Further, several QTLs, each with different environment specificity, can be introgressed
into a single genotype to develop phenotypes stable
over a range of environments. In fact, in conventional plant breeding, selections are made in target
environment and testing is done in multiple diverse
environments. This exercise is cumbersome and time
consuming. However, use of stable QTLs based selection can accelerate the pace of selection process in
rice breeding programs.
Gene Ontology Analysis
The enriched GO terms and the likely candidate genes of
each promising QTL have been studied. In the plant
height QTL region flanked by the markers RM302 and
RM11968, as many as 92 significant GO terms have been
identified, of which, metabolic process (GO:0008152) and
cellular process (GO:0044237) terms belonging to the
class biological process of the gene ontology were
overrepresented. Of the 92 GO terms identified, one
gene corresponded to the well known Green revolution gene sd1 (semi dwarfing) which also belongs to
biological process class [73].
In case of grain length QTL on chromosome 3, only one
significant GO term, i.e., caspase activity (GO:0030693)
related to molecular function has been observed. This GO
term corresponding to four genes, includes three ICE-like
protease p20 domain containing proteins and one Zinc
finger, LSD1-type domain containing protein. In this QTL
region one major gene that codes for putative transmembrane protein (Os03g0407400) was found to be governing
the grain length [11]. However, for this gene, no significant
hit was available in the GO analysis.
In the genomic region governing amylose content, i.e.,
qAC4.1, nine significant GO terms have been identified.
However, many of the genes belong to the DNA damage
or repair mechanism. It may be presumed that these
genes probably act as modifiers of the amylose content
in addition to other known major genes like granule
bound starch synthase (GBSS).
Even though, the region governing the chalkiness i.e.,
qCHK4.1 is very large, only 52 significant GO terms were
hit. Among them, metabolic process (GO:0008152), cell
(GO:0005623) and catalytic activity (GO:0003824) are
with the highest terms in the classes of biological process,
cellular components and molecular function, respectively.
A gene similar to Chalk5 was found in the QTL region of
qCHK4.1 which belongs to the class of biological process
and codes for vacuolar-processing enzyme (LOC_Os
Vemireddy et al. BMC Plant Biology (2015) 15:207
04g45470) [12]. However, in the same QTL region, soluble
starch synthase 3 (LOC_Os04g53310) under the GO term
of carbohydrate metabolic process also existed.
Prediction of candidate genes in the major QTL regions of
Basmati rice
Several recent publications indicate key intersecting signalling role for auxins and cell wall invertases (CWIN)
during grain filling. [30]. In the present study, we have
identified an auxin response factor (LOC_Os01g70270)
found to have a nsSNP (cGa/cAa) in which arginine (R)
was replaced by glutamine (Q) at position 530 using
qTeller software ( file 9:
Table S6).
We were also able to predict candidate gene underlying the QTL cluster consisting of four QTLs viz.,
qGL5.1, qGB5.1, qGLB5.1, and qER5.1 controlling grain
appearance trait as VQ domain containing protein
(LOC_Os05g32460). In Arabidopsis, the VQ motif protein IKU1 has been reported to regulate endosperm
growth and seed size along with IKU1 and MIN3 genes
[73]. Similarly, based on the transcriptome analysis, AP2
domain containing protein (LOC_Os05g32270) and RING
E3 ligase (LOC_Os05g32570) showing higher expression
during early flowering stage were reported to be involved in regulating grain size in Arabidopsis by Ohto et
al. [74] and in rice by Song et al. [57], respectively.
The enzyme involved in starch biosynthesis (soluble
starch synthase 3) could be the plausible candidate gene
for the chalkiness QTL region of RM564 and RM348 as
it has been found to have one nsSNP (aaA/aaC) wherein
lysine was replaced by asparagine at 207 position (Table
5; Additional file 10: Table S7). Interestingly, the same
gene was overrepresented in our GO analysis as well,
providing further evidence that this gene is a probable
candidate for the chalkiness. However, its expression is
less in the transcriptome analysis compared to the unknown genes.
Conclusion
Basmati rice of the Indian subcontinent is a highly distinctive rice because of its unique grain quality, elongation upon cooking and aroma traits. With the advent of
high yielding varieties ensuring high farm returns, serious threat to Basmati rices was perceived by the
breeders pushing them to resort to breeding of varieties
of Basmati quality in the high yielding background.
However, no variety ideally matching the traditional Basmati quality could be evolved even after many decades
of efforts. Genetic investigations have revealed that most
of the Basmati-specific traits are controlled quantitatively and selections based on phenotype are not reliable
enough. The present study was undertaken with the
objective of identifying genomic regions or QTLs
Page 17 of 19
governing the key characters of Basmati rice using the
cross between traditional Basmati variety, Basmati370
and high yielding non-Basmati variety Jaya. To the best
of our knowledge, the current study is the first attempt
to carry out combinational approach of genome-wide
mapping and genomics assisted candidate gene prediction to dissect the genetic basis of important agronomic
and quality traits of Basmati rice.
Molecular markers tightly linked to the stable and
major QTLs can be of potential value in application of
marker-assisted selection (MAS) of the corresponding
traits in rice breeding. The major QTLs identified in the
present study for economically important traits of Basmati can be transferred to high yielding varieties and
parents of heterotic hybrids by recombination breeding
using the tightly linked markers. Being a model cereal
crop with all the available genetic and genomic resources, along with the basmati genomic sequence, the
understanding of quality QTLs would facilitate their
positional cloning. By pyramiding the genes from different varieties in a single variety it could be possible to develop a high yielding superior quality rice variety so that
it can be available to the common man who dreams to
taste speciality rices like Basmati.
Additional files
Additional file 1: Figure S1. The grain appearance traits before and
after cooking in the Basmati370, Jaya, F1 and selected F2 individuals.
(TIFF 10085 kb)
Additional file 2: Table S1. Transgressive segregants, heterosis,
heterobeltiosis and inbreeding depression for 18 traits in the F2
population. (DOC 49 kb)
Additional file 3: Table S2. Chi square values of microsatellite markers
showing segregation distortion among F2 population of Basmati370/Jaya
(DOC 154 kb)
Additional file 4: Figure S2. Phenotypic distributions of agronomic
and quality traits in RIL population derived from a cross between
Basmati370 and Jaya. B - Basmati370; J- Jaya; F1: Hybrid. (TIFF 1004 kb)
Additional file 5: Figure S3. Phenotypic distributions of agronomic
traits in F3 population derived from a cross between Basmati370 and
Jaya. B - Basmati370; J- Jaya; F1: Hybrid. (TIFF 2461 kb)
Additional file 6: Table S3. Correlation coefficients among 18 traits
of the RIL population derived from the cross of Basmati370 and Jaya.
(DOC 60 kb)
Additional file 7: Table S4. Quantitative trait loci (QTLs) detected in F3
population of Basmati370/Jaya. (DOC 35 kb)
Additional file 8: Table S5. Quantitative trait loci (QTLs) detected in
the RIL population derived from Basmati370/Jaya. (DOC 38 kb)
Additional file 9: Table S6 The genes with non-synonymous SNPs in
the QTL for filled grain qFG1.1. (RM11968-RM14). (DOC 65 kb)
Additional file 10: Table S7 The genes with non-synonymous SNPs in
the QTL for chalkiness qCHK4.1. (RM564-RM348) (DOC 168 kb)
Abbreviations
cM: Centi Morgan; GO: Gene ontology; GT: Gelatinization temperature;
KEGG: Kyoto Encyclopedia of Genes and Genomes; LB ratio: Length- Breadth
ratio; LOD: Logarithm of odds ratio; MAS: Marker-assisted selection;
Vemireddy et al. BMC Plant Biology (2015) 15:207
nsSNPs: Non-synonymous SNPs; PCR: Polymerase chain reaction;
QTL: Quantitative trait loci; RIL: Recombinant inbred line.
Competing interests
The author(s) declare that they have no competing interests.
Authors' contributions
Conceived and designed the experiment: EAS, JN, LRV; Performed the
experiment: Genotyping and Phenotyping in F2, F3 - LRV, AS, AK, KS, SRNP,
NS, SN; Genotyping in RILs - SN, PMB, DAD; Phenotyping in RILs - PMB, DAD;
Data analysis: LRV, VVS; Contributed reagents/materials: EAS, JN, VVS; Wrote
the paper: LRV, EAS, JN, SN, VVS. All authors read and approved the final
manuscript.
Acknowledgements
Authors acknowldge "APEDA-CDFD Centre for Basmati DNA Analysis" for
providing financial assistance (Ref No: BDF0506/DNA Testing/
dated14.08.2005). LRV acknowledges Council of Scientific and Industrial
Research (CSIR) for providing Junior Research Fellowship. We are thankful to
Ms.Manju Shukla and Ms.Sandhya Rani for their techinical assistance.
Author details
1
Institute of Biotechnology, Acharya NG Ranga Agricultural University,
Rajendranagar, Hyderabad, 500030, AP, India. 2Centre for DNA Fingerprinting
and Diagnostics, Hyderabad 500001, India. 3Indian Institute of Rice Research,
Hyderabad, India.
Received: 20 May 2015 Accepted: 20 July 2015
References
1. Siddiq EA, Vemireddy LR, Nagaraju J. Basmati rices: Genetics, breeding and
trade. Agriculture Research. 2012;1(1):25–36.
2. Archak S, Lakshminarayanareddy V, Nagaraju J. High-throughput multiplex
microsatellite marker assay for detection and quantification of adulteration
in Basmati rice (Oryza sativa). Electrophoresis. 2007;28:2396–405.
3. Nagaraju J, Kathirvel M, Kumar RR, Siddiq EA, Hasnain SE. Genetic analysis of
traditional and evolved Basmati and non-Basmati rice varieties by using
fluorescence-based ISSR-PCR and SSR markers. Proc Natl Acad Sci U S A.
2002;99:5836–41.
4. Vemireddy LR, Archak S, Nagaraju J. Capillary electrophoresis is essential for
microsatellite marker based detection and quantification of adulteration of
Basmati rice (Oryza sativa). J Agric Food Chem. 2007;55:8112–7.
5. Glaszmann JC. Isozymes and classification of Asian rice varieties. Theor Appl
Genet. 1987;74:21–30.
6. Garris AJ, Tai TH, Coburn J, Kresovich S, McCouch S. Genetic structure and
diversity in Oryza sativa L. Genetics. 2005;169(3):1631–8.
7. Isshiki M, Morino K, Nakajima M, Okagaki RJ, Wessler SR, Izawa T, et al. A
naturally occurring functional allele of the rice waxy locus has a GT to TT
mutation at the 5′ splice site of the first intron. Plant J. 1998;15(1):133–8.
8. Umemoto T, Yano M, Satoh H, Shomura A, Nakamura Y. Mapping of a gene
responsible for the difference in amylopectin structure between japonicatype and indica-type rice varieties. Theor Appl Genet. 2002;104(1):1–8.
9. Bradbury L, Fitzgerald T, Henry R, Jin Q, Waters D. The gene for fragrance in
rice. Plant Biotechnol J. 2005;3(3):363–70.
10. Chen S, Yang Y, Shi W, Ji Q, He F, Zhang Z, et al. Badh2, encoding betaine
aldehyde dehydrogenase, inhibits the biosynthesis of 2-acetyl-1-pyrroline, a
major component in rice fragrance. Plant Cell. 2008;20(7):1850–61.
11. Fan C, Xing Y, Mao H, Lu T, Han B, Xu C, et al. GS3, a major QTL for grain
length and weight and minor QTL for grain width and thickness in rice,
encodes a putative transmembrane protein. Theor Appl Genet.
2006;112(6):1164–71.
12. Li Y, Fan C, Xing Y, Yun P, Luo L, Yan B, et al. Chalk5 encodes a vacuolar
H + −translocating pyrophosphatase influencing grain chalkiness in rice.
Nat Genet. 2014;46(4):398–404.
13. Kwon S-W, Cho Y-C, Lee J-H, Suh J-P, Kim J-J, Kim M-K, et al. Identification
of quantitative trait loci associated with rice eating quality traits using a
population of recombinant inbred lines derived from a cross between two
temperate japonica cultivars. Mol Cells. 2011;31(5):437–45.
14. Wada T, Uchimura Y, Ogata T, Tsubone M, Matsue Y. Mapping of QTLs for
Physicochemical Properties in Japonica Rice. Breeding Science. 2006;56(3):253–60.
Page 18 of 19
15. Tan YF, Sun M, Xing YZ, Hua JP, Sun XL, Zhang QF, et al. Mapping
quantitative trait loci for milling quality, protein content and color
characteristics of rice using a recombinant inbred line population derived
from an elite rice hybrid. Theor Appl Genet. 2001;103(6–7):1037–45.
16. Ahn SN, Bollich CN, McClung AM, Tanksley SD. RFLP analysis of genomic
regions associated with cooked-kernel elongation in rice. Theor Appl Genet.
1993;87(1–2):27–32.
17. Lanceras JC, Huang ZL, Naivikul O, Vanavichit A, Ruanjaichon V,
Tragoonrung S. Mapping of genes for cooking and eating qualities in Thai
jasmine rice (KDML105). DNA Res. 2000;7(2):93–101.
18. Govindaraj P, Arumugachamy S, Maheswaran M. Bulked segregant analysis
to detect main effect QTL associated with grain quality parameters in
Basmati 370/ASD 16 cross in rice Oryza sativa ) using SSR markers.
Euphytica. 2005;144(1–2):61–8.
19. Amarawathi Y, Singh R, Sing A, Singh V, Mohapatra T, Sharma T, Singh N:
Mapping of quantitative trait loci for basmati quality traits in rice (Oryza
sativa L.). Molecular Breeding 2007, doi:10.1007/s11032-007-9108-8.
20. Sood BC, Siddiq EA. A rapid technique for scent determination in rice.
Indian J Genet Plant Breeding. 1978;38:268–71.
21. Little RR, Hilder GB, Dawson EH. Differential effect of dilute alkali on 25
varieties of milled white rice. Cereal Chemistry. 1958;35:111–26.
22. Juliano BO. A simplified assay for milled rice amylose. Cereal Science Today.
1971;16:334–8.
23. Murray MG, Thompson WF. Rapid isolation of high molecular weight plant
DNA. Nucleic Acids Res. 1980;8(19):4321–6.
24. Lorieux M. MapDisto, A Free User-Friendly Program For Computing Genetic
Maps. Computer demonstration (P958) given at the Plant and Animal
Genome XV conference, Jan 13-17 2007, San Diego, CA. http://
mapdisto.free.fr/.
25. Lincoln S, Daly M, Lander E. Constructing genetic maps with MAPMAKER/
EXP 3.0. Cambridge, MA: Whitehead Institute Technical Report 3rd edition
Whitehead Institute; 1992.
26. McCouch SR, Teytelman L, Xu Y, Lobos KB, Clare K, Walton M, et al.
Development and mapping of 2240 new SSR markers for rice (Oryza sativa
L.). DNA Res. 2002;9:257–79.
27. Tan YF, Xing YZ, Li JX, Yu SB, Xu CG, Zhang Q. Genetic bases of appearance
quality of rice grains in Shanyou 63, an elite rice hybrid. Theor Appl Genet.
2000;101(5–6):823–9.
28. Wan XY, Wan JM, Weng JF, Jiang L, Bi JC, Wang CM, et al. Stability of
QTLs for rice grain dimension and endosperm chalkiness
characteristics across eight environments. Theor Appl Genet.
2005;110(7):1334–46.
29. Lin HX, Qian HR, Zhuang JY, Lu J, Min SK, Xiong ZM, et al. RFLP mapping of
QTLs for yield and related characters in rice (Oryza sativa L.). Theor Appl
Genet. 1996;92(8):920–7.
30. French S, Abu-Zaitoon Y, Uddin M, Bennett K, Nonhebel H. Auxin and Cell
Wall Invertase Related Signaling during Rice Grain Development. Plants.
2014;3(1):95–112.
31. Puri RP, Siddiq EA. Inheritance of gelatinization temperature in rice. Indian
Journal of Genetics and Plant Breeding. 1980;40:460–2.
32. Narshimulu G, Jamaloddin M, Vemireddy LR, Anuradha G, Siddiq EA.
Potentiality of evenly distributed hypervariable microsatellite markers in
marker-assisted breeding of rice. Plant Breeding. 2011;130:314–20.
33. Meenakshisundaram P, Patel S, Sudha M, Geethanjali S, Vinod KK, Selvaraju
K, et al. Microsatellite marker based linkage map construction and mapping
of granule bound starch synthase (GBSS) in rice using recombinant inbred
lines of the cross Basmati370/ASD16. Crop Improvement 2011;38(2):155-62.
34. Lander ES, Botstein D. Mapping mendelian factors underlying quantitative
traits using RFLP linkage maps. Genetics. 1989;121(1):185–99.
35. Zhang Q-J, Ye S-P, Li J-Q, Zhao B, Liang Y-S, Peng Y, et al. Construction of a
Microsatellite Linkage Map with Two Sequenced Rice Varieties. Acta
Genetica Sinica. 2006;33(2):152–60.
36. Temnykh S, DeClerck G, Lukashova A, Lipovich L, Cartinhour S, McCouch S.
Computational and experimental analysis of microsatellites in rice (Oryza
sativa L.): frequency, length variation, transposon associations, and genetic
marker potential. Genome Res. 2001;11(8):1441–52.
37. Harushima Y, Yano M, Shomura A, Sato M, Shimano T, Kuboki Y, et al. A
high-density rice genetic linkage map with 2275 markers using a single F2
population. Genetics. 1998;148(1):479–94.
38. Subudhi PK, Huang N. RAPD mapping in a doubled haploid population of
rice (Oryza sativa L.). Hereditas. 1999;130(1):41–9.
Vemireddy et al. BMC Plant Biology (2015) 15:207
39. Knox MR, Ellis THN. Excess Heterozygosity Contributes to Genetic Map
Expansion in Pea Recombinant Inbred Populations. Genetics.
2002;162(2):861–73.
40. Boivin K, Deu M, Rami J, Trouche G, Hamon P. Towards a saturated
sorghum map using RFLP and AFLP markers. Theor Appl Genet.
1999;98(2):320–8.
41. Becker J, Vos P, Kuiper M, Salamini F, Heun M. Combined mapping of AFLP
and RFLP markers in barley. Molecular General Genetics. 1995;249:65–73.
42. Monna L, Kitazawa N, Yoshino R, Suzuki J, Masuda H, Maehara Y, et al.
Positional cloning of rice semidwarfing gene, sd-1: rice "green revolution
gene" encodes a mutant enzyme involved in gibberellin synthesis. DNA Res.
2002;9:11–7.
43. Sasaki T, Yano M, Kurata N, Yamamoto K. The Japanese Rice Genome
Research Program. Genome Res. 1996;6(8):661–6.
44. Spielmeyer W, Ellis MH, Chandler PM. Semidwarf (sd-1), “green revolution”
rice, contains a defective gibberellin 20-oxidase gene. Proc Natl Acad Sci U S A.
2002;99:9043–8.
45. Ishimaru K, Ono K and Kashiwagi T. Identification of a new gene controlling
plant height in rice using the candidate‐gene strategy. Planta.
2004;218:388–95.
46. Zhuang JY, Qian HR, Lu J, Lin HX, Zheng KL. RFLP variation among commercial
rice germplasms in China. Journal of Genetics and Breeding. 1997;51:263–8.
47. Ashikari M, Sakakibara H, Lin S, Yamamoto T, Takashi T, Nishimura A, et al.
Cytokinin oxidase regulates rice grain production. Science. 2005;309:741–5.
48. Xue W, Xing Y, Weng X, Zhao Y, Tang W, Wang L, et al. Natural variation in
Ghd7 is an important regulator of heading date and yield potential in rice.
Nat Genet. 2008;40(6):761–7.
49. He G, Luo X, Tian F, Li K, Zhu Z, Su W, et al. Haplotype variation in structure
and expression of a gene cluster associated with a quantitative trait locus
for improved yield in rice. Genome Res. 2006;16:618–26.
50. Zhang Y, Zhang Y, Dong S, Chen T, Zhao Q, Zhu Z, et al: QTL Mapping for
Grain Size Traits Based on Extra-Large Grain Rice Line TD70 Rice Science
2013;20(6):400−6.
51. Wan XY, Wan JM, Jiang L, Wang JK, Zhai HQ, Weng JF, et al. QTL analysis for
rice grain length and fine mapping of an identified QTL with stable and
major effects. Theor Appl Genet. 2006;112(7):1258–70.
52. Wang J, Wan X, Crossa J, Crouch J, Weng J, Zhai H, et al. QTL mapping of
grain length in rice (Oryza sativa L.) using chromosome segment
substitution lines. Genet Res. 2006;88:93–104.
53. Zhou LQ, Wang YP, Li SG. Genetic analysis and physical mapping of Lk-4(t),
a major gene controlling grain length in rice, with a BC2F2 population.
Acta genetica Sinica. 2006;33(1):72–9.
54. Tanksley SD. Mapping polygenes. Annu Rev Genet. 1993;27:205–33.
55. Tan YF, Li JX, Yu SB, Xing YZ, Xu CG, Zhang Q. The three important traits for
cooking and eating quality of rice grains are controlled by a single locus in
an elite rice hybrid, Shanyou 63. Theor Appl Genet. 1999;99(3–4):642–8.
56. Li J, Thomson M, McCouch SR. Fine mapping of a grain-weight quantitative
trait locus in the pericentromeric region of rice chromosome 3. Genetics.
2004;168(4):2187–95.
57. Song XJ, Huang W, Shi M, Zhu MZ, Lin HX. A QTL for rice grain width and
weight encodes a previously unknown RING-type E3 ubiquitin ligase. Nat
Genet. 2007;39(5):623–30.
58. Shomura A, Izawa T, Ebana K, Ebitani T, Kanegae H, Konishi S, et al. Deletion
in a gene associated with grain size increased yields during rice
domestication. Nat Genet. 2008;40(8):1023–8.
59. Li Q, Li L, Yang X, Warburton ML, Bai G, Dai J, et al. Relationship,
evolutionary fate and function of two maize co-orthologs of rice GW2
associated with kernel size and weight. BMC Plant Biol. 2010;10:143.
60. Yu H, Xie W, Wang J, Xing Y, Xu C, Li X, et al. Gains in QTL detection using
an ultra-high density SNP map based on population sequencing relative to
traditional RFLP/SSR markers. PLoS One 2011;6(3):e17595.
61. Faruq G, Zakaria HP. Kernel elongation in rice. Journal of the Science of
Food and Agriculture 2013;93(3):449-56.
62. Ge, XJ, Xing YZ, Xu CG, He YQ. QTL analysis of cooked rice grain elongation,
volume expansion, and water absorption using a recombinant inbred
population. Plant Breeding. 2005;124:121–6.
63. Tian F, Li DJ, Fu Q, Zhu ZF, Fu YC, Wang XK, et al. Construction of
introgression lines carrying wild rice (Oryza rufipogon Griff.) segments in
cultivated rice (Oryza sativa L.) background and characterization of
introgressed segments associated with yield-related traits. Theor Appl
Genet. 2006;112(3):570–80.
Page 19 of 19
64. Liu L, Yan X, Jiang L, Zhang W, Wang M, Zhou S, et al. Identification of
stably expressed quantitative trait loci for cooked rice elongation in
non-Basmati varieties. Genome. 2008;51(2):104–12.
65. He P, Li SG, Qian Q, Ma YQ, Li JZ, Wang WM, et al. Genetic analysis of rice
grain quality. Theor Appl Genet. 1999;98:502–8.
66. Hsu YC, Tseng MC, Wu YP, Lin MY, Wei FJ, Hwu KK, et al. Genetic factors
responsible for eating and cooking qualities of rice grains in a recombinant
inbred population of an inter-subspecific cross. Mol Breeding
2014;34(2):655-73.
67. Zheng X, Wu JG, Lou XY, Xu HM, Shi CH. The QTL analysis on maternal and
endosperm genome and their environmental interactions for characters
of cooking quality in rice (Oryza sativa L.). Theor Appl Genet.
2008;116(3):335–42.
68. Nakamura Y. Towards a better understanding of the metabolic system for
amylopectin biosynthesis in plants: rice endosperm as a model tissue. Plant
Cell Physiol. 2002;43(7):718–25.
69. Paterson AH, Damon S, Hewitt JD, Zamir D, Rabinowitch HD, Lincoln SE,
et al. Mendelian factors underlying quantitative traits in tomato: comparison
across species, generations, and environments. Genetics. 1991;127(1):181–97.
70. Xiao J, Li J, Yuan L, Tanksley SD. Identification of QTLs affecting traits of
agronomic importance in a recombinant inbred population derived from
a subspecific rice cross. Theor Appl Genet. 1996;92(2):230–44.
71. Shu XL, Shen SQ, Bao JS, Wu DX, Nakamura Y, Shu QY. Molecular and
biochemical analysis of the gelatinization temperature characteristics of rice
(Oryza sativa L.) starch granules. J Cereal Science. 2006;44:40–8.
72. Kovacha MJ, Calingacionb MN, A. FM, S.R. M. The origin and evolution of
fragrance in rice (Oryza sativaL.). Proceedings of the National Academy of
Sciences USA 2009;106(34):14444–9.
73. Wang A, Garcia D, Zhang H, Feng K, Chaudhury A, Berger F, et al. The VQ
motif protein IKU1 regulates endosperm growth and seed size in
Arabidopsis. Plant J. 2010;63(4):670–9.
74. Ohto M, Fischer RL, Goldberg RB, Nakamura K, Harada JJ. Control of seed
mass by APETALA2. Proc Natl Acad Sci U S A. 2005;102(8):3123–8.
Submit your next manuscript to BioMed Central
and take full advantage of:
• Convenient online submission
• Thorough peer review
• No space constraints or color figure charges
• Immediate publication on acceptance
• Inclusion in PubMed, CAS, Scopus and Google Scholar
• Research which is freely available for redistribution
Submit your manuscript at
www.biomedcentral.com/submit