Báo cáo hóa học: " Research Article Clustering and Symbolic Analysis of Cardiovascular Signals: Discovery and Visualization of " potx
Bạn đang xem bản rút gọn của tài liệu. Xem và tải ngay bản đầy đủ của tài liệu tại đây (4.05 MB, 16 trang )
Hindawi Publishing Corporation
EURASIP Journal on Advances in Signal Processing
Volume 2007, Article ID 67938, 16 pages
doi:10.1155/2007/67938
Research Article
Clustering and Symbolic Analysis of Cardiovascular Signals:
Discovery and Visualization of Medically Relevant Patterns in
Long-Term Data Using Limited Prior Knowledge
Zeeshan Syed,1 John Guttag,1 and Collin Stultz1, 2
1 Massachusetts
2 Brigham
Institute of Technology, Cambridge, MA 02139-4307, USA
and Women’s Hospital, Cambridge, MA 02115, USA
Received 30 April 2006; Revised 18 December 2006; Accepted 27 December 2006
Recommended by Maurice Cohen
This paper describes novel fully automated techniques for analyzing large amounts of cardiovascular data. In contrast to traditional medical expert systems our techniques incorporate no a priori knowledge about disease states. This facilitates the discovery
of unexpected events. We start by transforming continuous waveform signals into symbolic strings derived directly from the data.
Morphological features are used to partition heart beats into clusters by maximizing the dynamic time-warped sequence-aligned
separation of clusters. Each cluster is assigned a symbol, and the original signal is replaced by the corresponding sequence of
symbols. The symbolization process allows us to shift from the analysis of raw signals to the analysis of sequences of symbols.
This discrete representation reduces the amount of data by several orders of magnitude, making the search space for discovering
interesting activity more manageable. We describe techniques that operate in this symbolic domain to discover rhythms, transient
patterns, abnormal changes in entropy, and clinically significant relationships among multiple streams of physiological data. We
tested our techniques on cardiologist-annotated ECG data from forty-eight patients. Our process for labeling heart beats produced
results that were consistent with the cardiologist supplied labels 98.6% of the time, and often provided relevant finer-grained distinctions. Our higher level analysis techniques proved effective at identifying clinically relevant activity not only from symbolized
ECG streams, but also from multimodal data obtained by symbolizing ECG and other physiological data streams. Using no prior
knowledge, our analysis techniques uncovered examples of ventricular bigeminy and trigeminy, ectopic atrial rhythms with aberrant ventricular conduction, paroxysmal atrial tachyarrhythmias, atrial fibrillation, and pulsus paradoxus.
Copyright © 2007 Zeeshan Syed et al. This is an open access article distributed under the Creative Commons Attribution License,
which permits unrestricted use, distribution, and reproduction in any medium, provided the original work is properly cited.
1.
INTRODUCTION
The increasing prevalence of long-term monitoring in both
ICU and ambulatory settings will yield ever increasing
amounts of physiological data. The sheer volume of information that is generated about an individual patient poses a
serious challenge to healthcare professionals. Patients in an
ICU setting, for example, often have continuous streams of
data arising from telemetry monitors, pulse oximeters, SwanGanz catheters, and arterial blood gas lines—to name just a
few sources.
Any process that requires humans to examine more than
small amounts of data is highly error prone. It is therefore
not surprising that errors have been associated with “information overload” and that clinically relevant events are often
missed [1, 2]. Computer-based systems can be used to detect
some events, but most conventional algorithms are tailored
to detect specific classes of disorders.
In this paper, we describe a new approach to analyzing
large sets consisting of physiological data relating to the cardiovascular system. We rely on morphologic characteristics
of the physiological signal. However, unlike traditional expert systems, which can be used to search for a prespecified
set of events using a priori knowledge, our approach allows
for the discovery of events that do not need to be specified in
advance. Our interest in techniques that do not incorporate
knowledge about the events to be detected is motivated by
a desire to uncover physiological activity that may have potential impact on patient care, but would not be detected by
conventional methods.
The techniques that we present can be used to discover interesting events over long periods of time. We focus
EURASIP Journal on Advances in Signal Processing
(a)
Amplitude (mV)
2
50
0
−50
0
5
10
15
Time (min)
20
25
30
(b)
(d)
θγβαθγβαθγββθγβαθγβαθγαθγβαθγβθγβαθγββθγβαθγββθγβαθγβα
Amplitude (mV)
(c)
40
θ
20
γ
β
α
0
−20
0
0.5
1
1.5
2
2.5
Time (min)
3
3.5
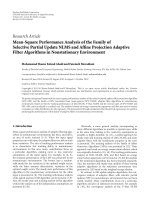
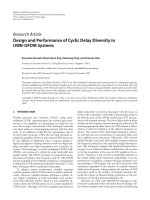
Figure 1: Overview of symbolic analysis: (a) raw data corresponding to Patient 106 in the MIT-BIH arrhythmia database. The red rectangle
denotes a particular pattern hidden within the raw data. This pattern is difficult to identify by visual examination alone. (b) The raw ECG
data is mapped into a symbolic representation (11 lines of the symbol sequence are elided from this figure). (c) An example rhythm of
a repeating sequence, found in the symbolized representation of the data corresponding to the boxed area of the raw data in (a). (d) An
archetypal representation, created using the techniques in [3], of the repeating signal.
primarily on the analysis of ECG data, extending our work to
other signals in multiparameter datasets to find cross-signal
interactions.
We propose a two-step process for discovering relevant
information in cardiovascular datasets. As a preliminary step,
we segment physiological signals into basic quasiperiodic
units (e.g., heart beats recorded on ECG). These units are
partitioned into classes using morphological features. This
allows the original signal to be reexpressed as a symbolic
string, corresponding to the sequence of labels assigned to
the underlying units.
The second step involves searching for significant patterns in the reduced representation resulting from symbolization. In the absence of prior knowledge, significance is assessed by organization of basic units as adjacent repeats, frequently occurring words, or subsequences that cooccur with
activity in other signals. The fundamental idea is to search
for variations that are unlikely to occur purely by chance as
such patterns are most likely to be clinically relevant. The abstraction of cardiovascular data as a symbolic string allows
efficient algorithms from computational biology and information theory to be leveraged.
Figure 1 presents an overview of this approach. We start
by using conventional techniques to segment an ECG signal
into individual beats. The beats are then automatically partitioned into classes based upon their morphological prop-
erties. For the data in Figure 1(a), our algorithm found five
distinct classes of beats, denoted in the figure by the arbitrary symbols θ, γ, β, α, and Ψ (Figure 1(b)). For each
class an archetypal beat is constructed that provides an easily understood visible representation of the types of beats in
that class. The original ECG signal is then replaced by the
corresponding sequence of symbols. This process allows us
to shift from the analysis of raw signals to the analysis of
symbolic strings. The discrete symbolic representation provides a layer of data reduction, reducing the data rate from
3960 bits/second (sampling at 360 Hz with 11 bit quantization) to n bits/second (where n depends upon the number of
bits needed to differentiate between symbols, three for this
example). Finally, various techniques are used to find segments of the symbol sequence that are of potential clinical
interest. In this example, a search for approximate repeating
patterns found the rhythm shown in Figure 1(c). The corresponding archetypal representation in Figure 1(d) allows this
activity to be readily visualized in a compact form.
The remainder of this paper is organized as follows. The
process of symbolizing signals is described in Section 2 and
the higher level analysis techniques that operate on this representation of the data in Section 3. An evaluation of our
methods is presented alongside the technical details. A discussion of related work appears in Section 4, and a summary
and conclusions are provided in Section 5.
Zeeshan Syed et al.
2.
SYMBOLIZATION
An extensive literature exists on the subject of symbolization
[4]. Essentially, the task of symbolizing data can be divided
into two subtasks. As a first step, the signal needs to be segmented into intervals of activity. Following this, the set of
segments is partitioned into classes and a label associated
with each class.
The segmentation stage decomposes the continuous input signal into intervals with biologically relevant boundaries. A natural approach to achieve this is to segment the
physiological signals according to some well-defined notion.
In this work, we use R-R intervals for heart beats and peaks of
inspiration and expiration for respiratory cycles. Since most
cardiovascular signals are quasiperiodic, we can exploit cyclostationarity for data segmentation [5].
We treat the task of partitioning as a data clustering
problem. Roughly speaking, the goal is to partition the set
of segments into the smallest number of clusters such that
each segment within a cluster represents the same underlying physiological activity. For example, in the case of ECG
data, one cluster might contain only ventricular beats (i.e.,
beats arising from the ventricular cavities in the heart) and
another only junctional beats (i.e., beats arising from a region of the heart called the atrioventricular junction). Each
of these beats has different morphological characteristics that
enable us to place them in different clusters.
There is a set of generally accepted labels that cardiologists use to differentiate distinct kinds of heart beats. Although cardiologists occasionally disagree about what label
should be applied to some beats, labels supplied by cardiologists provide a useful way to check whether or not the beats
in a cluster represent the same underlying physiological activity. However, in some cases, finer distinctions than provided by these labels can be clinically relevant. Normal beats,
for example, are usually defined as beats that have morphologic characteristics that fall within a relatively broad range;
for example, QRS complex less than 120 milliseconds and PR
interval less than 200 milliseconds. Nevertheless, it may be
clinically useful to further divide “normal” beats into multiple classes since some normal beats have subtle morphological features that are associated with clinically relevant states.
One example of this phenomenon is Wolff-Parkinson-White
(WPW) syndrome. In this disorder, patients have ECG beats
that appear grossly normal, yet on close inspection, their
QRS complexes contain a subtle deflection called a δ-wave
and a short PR interval [5]. Since such patients are predisposed to arrhythmias, the identification of this electrocardiographic finding is of interest [5]. For reasons such as this,
standard labels cannot be used to check whether or not an
appropriate number of clusters have been found.
We first extract features from each segment by sampling
the continuous data stream at discrete points, and then group
the segments based upon the similarity of their features.
Many automated techniques exist for the unsupervised partitioning of a collection of individual observations into characteristic classes. In [6], a comprehensive examination of a
number of methods that have been used to cluster ECG beats
3
is provided. These methods focus on partitioning the beats
into a relatively small number of well-documented classes.
Our work differs both in our interest in making finer distinctions than is usual, for example, between two beats that
would normally both be classified as “normal,” and in our
desire to discover classes that occur rarely during the course
of a recording. This led us to employ clustering methods with
a higher sensitivity than those described in [6]. In addition,
we implement optimizations that facilitate the clustering of
very large data sets.
We use Max-Min clustering to separate segmented units
of cardiovascular signals into groups. The partitioning proceeds in a greedy manner, identifying a new group at each iteration that is maximally separated from existing groups and
dynamic time-warping (DTW) is used to calculate the timenormalized distance between a pair of observations. This is
described in Sections 2.1-2.2. An evaluation of this work is
presented in Section 2.3.
2.1.
Dissimilarity metric
Central to the clustering process is the method used to measure the distance between two segments. For physiological
signals, this is complicated by the differences in lengths of
segments. We deal with this using dynamic time-warping,
which allows subsignals to be variably dilated or shrunk.
Given two segments x1 and x2 , we measure the dissimilarity between them as the DTW cost of alignment [7]. Denoting the length of these sequences by l1 and l2 , respectively, the
conventional DTW algorithm produces the optimal alignment of the two sequences by first constructing an l1 -by-l2
distance matrix. Each entry (i, j) in this matrix represents the
distance d(x1 [i], x2 [ j]) between samples x1 [i] and x2 [ j]. A
particular alignment then corresponds to a path, ϕ, through
the distance matrix of the form
ϕ(k) = ϕ1 (k), ϕ2 (k) ,
1 ≤ k ≤ K,
(1)
where ϕ1 and ϕ2 represent row and column indices into the
distance matrix, and K is the alignment length.
The optimal alignment produced by DTW minimizes the
overall cost:
C x1 , x2 = min Cϕ x1 , x2
ϕ
(2)
with
Cϕ x 1 , x 2 =
1
K
K
d x1 ϕ1 (k) , x2 ϕ2 (k) .
(3)
k=1
Cϕ is the total cost of path ϕ divided by the alignment length,
K. The division by K is necessary since some long paths
through the matrix will have large costs simply because they
have more matrix elements. Dividing by K helps to remove
the dependence of the cost on the length of the original observations. The search for the optimal path then proceeds in
O(l1 l2 ) time by dynamic programming. One problem with
this method is that some paths are long not because the segments to be aligned are long, but rather these observations
4
EURASIP Journal on Advances in Signal Processing
are time-warped differently. In these cases, dividing by K is
inappropriate because the length of a beat (or of parts of a
beat) being different often provides diagnostic information
that is complimentary to the information provided by the
morphology. Consequently, in our algorithm we omit the division by K.
Another important difference between our approach and
traditional DTW is the distance metric used. The conventional DTW algorithm defines the distance d(x1 [i], x2 [ j]) as
the Euclidean distance between the individual samples x1 [i]
and x2 [ j]. In the presence of small amounts of additive background noise, similar to what is commonly encountered in
physiological signals, a more robust measure is provided by
calculating the distance between small windows of the signals
x1 and x2 , centred at time instants i and j, that is,
W
d x1 [i], x2 [ j] =
1
x1 [i + k] − x2 [ j + k]
2W + 1 k=−W
2
.
(4)
The key idea is that the distance is computed across local windows to better capture underlying trends, as opposed
to individual samples, which are more sensitive to noise. W
is typically chosen to be a small value depending on the
sampling frequency so as to prevent the possibility of sharp
events such as the QRS complex from being diminished in
amplitude. For these studies we chose W = 4, a compromise
between the need to remove background noise and the need
to preserve important morphologic characteristics of the signal.
Essentially, this approach is equivalent to first smoothing out the signals x1 and x2 by median filtering with a small
window of length 2W +1, and may be carried out with a subsequent preprocessing step. We recognize that other methods
for removing background noise exist [8], and future applications of this work will explore these alternate approaches.
2.2. Max-Min clustering
In [9, 10], clustering methods are proposed that build on
top of the dissimilarity measure presented in Section 2.1. A
modified fuzzy clustering approach is described in [9], while
[10] explores the use of hierarchical clustering. Denoting the
number of observations to be clustered as N, both methods
require a total of O(N 2 ) comparisons to calculate the dissimilarity between every pair of observations. If each observation
has length M, the time taken for each dissimilarity comparison is O(M 2 ). Therefore, the total running time for the clustering methods in [9, 10] is O(M 2 N 2 ). Additionally, storing
the entire matrix of comparisons between every pair of observations requires O(N 2 ) space.
To reduce the requirements in terms of running time and
space, we employ Max-Min clustering [11], which can be implemented to discover k clusters using O(Nk) comparisons.
This leads to a total running time of O(M 2 Nk), with an O(N)
space requirement.
Max-Min clustering proceeds by choosing an observation at random as the first centroid c1 and setting the set S of
centroids to {c1 }. During the ith iteration, ci is chosen such
that it maximizes the minimum distance between ci and observations in S:
ci = arg maxx∈S min C(x, y),
/
y ∈S
(5)
where C(x, y) is defined as in (2). The set S is incremented at
the end of each iteration such that S = S ∪ ci .
The number of clusters discovered by Max-Min clustering is chosen by iterating until the maximized minimum dissimilarity measure in (5) falls below a specified threshold θ.
Therefore, the number of clusters, k, depends on the separability of the underlying data to be clustered.
The running time of O(M 2 Nk) can be further reduced by
exploiting the fact that in many cases two observations may
be sufficiently similar that it is not necessary to calculate the
optimal alignment between them. A preliminary processing
block that identifies c such homogeneous groups from N observations without alignment of time-samples will reduce the
number of DTW comparisons, each of which is O(M 2 ), from
O(Nk) to O(ck). This preclustering can be achieved in a computationally inexpensive manner through an initial round of
Max-Min clustering using a simple distance metric.
The running time using preclustering is given by
O(MNc) + O(M 2 ck). The asymptotic worst case behavior
with this approach is still O(M 2 Nk), for example, when all
the observations are sufficiently different that c = N. However, for the ECG data we have examined, c is an order of
magnitude less than N. For example, preclustering with a hierarchical Max-Min approach yielded a speedup factor of 12
on the data from the MIT-BIH arrhythmia database used for
the work described in Section 2.3.
2.3.
Evaluation of clustering algorithm
We applied the techniques discussed in Sections 2.1-2.2 to
electrocardiographic data in the Physionet MIT-BIH Arrhythmia database, which contains excerpts of two-channel
ECG sampled at 360 Hz per channel with 11-bit resolution.
Activity is hand-annotated by cardiologists, allowing our
findings to be validated against human specialists.
For each patient in the database, we searched for different
classes of ECG activity between consecutive R waves within
each QRS complex. A Max-Min threshold of θ = 50 was
used, with this value being chosen experimentally to produce a small number of clusters, while generally separating
out clinical classes of activity for each patient. As we report
at the end of this section, a prospective study on blind data
not used during the original design of our algorithm shows
that the value of the θ parameter generalizes quite well.
Beats were segmented using the algorithm described in
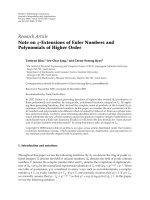
[12]. A histogram for the number of clusters found automatically for each patient is provided in Figure 2. The median number of clusters per patient was 22. For the median
patient, 2202 distinct beats were partitioned into 22 classes.
A relatively large number of clusters were found in some
Number of patients
Zeeshan Syed et al.
14
12
10
8
6
4
2
0
0
5
50
100
Number of clusters
150
Figure 2: Histogram of clusters per patient: the number of clusters
determined automatically per patient is distributed as shown, with
a median value of 22.
cases, in particular patients 105, 203, 207, and 222. These
files are described in the MIT-BIH Arrhythmia database as
being difficult to analyze owing to considerable high-grade
baseline noise and muscle artifact noise. This leads to highly
dissimilar beats, and also makes the ECG signals difficult to
segment. For patient 207, the problem is compounded by the
presence of multiform premature ventricular contractions
(PVCs). Collectively, these records are characterized by long
runs of beats corresponding to singleton clusters, which can
be easily detected and discarded (i.e., long periods of time
where every segmented unit looks significantly different from
everything else encountered).
Our algorithm clusters data without incorporating prior,
domain-specific knowledge. As such, our method was not
designed to solve the classification problem of placing beats
into prespecified clinical classes corresponding to cardiologist labels. Nevertheless, a comparison between our clustering algorithm and cardiologist provided labels is of interest. Therefore, we compared our partitioning of the data
to cardiologist-provided labels included in the MIT-BIH arrhythmia database.
There are a number of ways to compare a clustering produced by our algorithm (CA ) to the implicit clustering which
is defined by cardiologist supplied labels (CL ). CA and CL are
said to be isomorphic if for every pair of beats, the beats are
in the same cluster in CA if and only if they are in the same
cluster in CL . If CA and CL are isomorphic, our algorithm has
duplicated the clustering provided by cardiologists. In most
cases, CA and CL will not be isomorphic because our algorithm typically produces more clusters than are traditionally defined by cardiologists. We view this as an advantage of
our approach as it enables our method to identify new morphologies and patterns that may be of clinical interest.
Alternatively, we say that CA is consistent with CL if an isomorphism between the two can be created by merging clusters in CA . For example, two beats in an ECG data stream
may have abnormally long lengths and therefore represent
“wide-complex” beats. However, if they have sufficiently different morphologies, they will be placed in different clusters.
We can facilitate the creation of an isomorphism between CA
and CL by merging all clusters in CA which consists of widecomplex beats. While consistency is a useful property, it is
not sufficient. For example, if every cluster in CA contained
exactly one beat, it would be consistent with CL . As discussed
above, however, in most cases our algorithm produces a reasonable number of clusters.
To determine whether our algorithm generates a clustering that is consistent with cardiologists supplied labels, we
examined the labels of beats in each cluster and assigned the
cluster a label corresponding to its majority element. For example, a cluster containing 1381 normal beats, and 2 atrial
premature beats would be labeled as being normal. Beats in
the original signal were then assigned the labels of their clusters (e.g., the 2 atrial beats in the above example would be
labeled as normal). Finally, we tabulate the differences between the labels generated by this process and the cardiologist supplied labels in the database. This procedure identifies,
and effectively merges, clusters that contain similar types of
beats.
We considered only classes of activity that occurred in
at least 5% of the patients in the population, that is, 3 or
more patients in the MIT-BIH Arrhythmia database. Specifically, even though we successfully detected the presence of
atrial escape beats in patient 223 of the MIT-BIH Arrhythmia database and ventricular escape beats in patient 207, we
do not report these results in the subsequent discussion since
no other patients in the population had atrial or ventricular
escape activity and it is hard to generalize from performance
on a single individual. During the evaluation process, labels
that occur fewer than three times in the original labeling for
a patient (i.e, less than 0.1% of the time) were also ignored.
Tables 1 and 2 show the result of this testing process. We
document differences between the labeling generated by our
process and the cardiologist supplied labels appearing in the
database. Differences do not necessarily represent errors. Visual inspection of these differences by a board-certified cardiologist, who was not involved in the initial labeling of beats in
the Physionet MIT-BIH arrhythmia database, indicates that
experts can disagree on the appropriate labeling of many of
the beats where the classification differed. Nevertheless, for
simplicity we will henceforth refer to “differences” as “errors.”
In Table 1, for the purpose of compactly presenting results, we organize clinical activity into the following groups:
(i) normal;
(ii) atrial (atrial premature beats, aberrated atrial premature beats and atrial ectopic beats);
(iii) ventricular (premature ventricular contractions, ventricular ectopic beats, and fusion of normal and ventricular beats);
(iv) bundle branch block (left and right bundle branch
block beats);
(v) junctional (premature junctional beats and junctional
escape beats);
(vi) others.
The result of clustering without this grouping (i.e., in
terms of the original annotations in the MIT-BIH Arrhythmia database) is presented in Table 4. The overall misclassification percentage in both cases is approximately 1.4%.
6
EURASIP Journal on Advances in Signal Processing
Table 1: Beats detected for each patient in the MIT-BIT Arrhythmia database using symbolization. To compactly display results we group
the clinical classes (N = normal, Atr. = atrial arrhythmias, Ven. = ventricular, Bbb. = bundle branch block, Jct. = junctional beats,
Oth. = others, Mis. = mislabeled beat). For each group, the number of correctly detected beats is shown relative to the total beats originally
present. The aggregate detection performance is given in terms of both beats (i.e., total number of beats for each group correctly detected
across population) and patients (i.e., total number of patients for whom the group of activity was correctly detected to occur).
Patient
100
101
102
103
104
105
106
107
108
109
111
112
113
114
115
116
117
118
119
121
122
123
124
200
201
202
203
205
207
208
209
210
212
213
214
215
217
219
220
221
222
223
228
230
231
232
233
234
Total beats
Total patients
N
2234/2234
1852/1852
14/99
2076/2076
51/163
2530/2534
1500/1500
—
1748/1748
—
2117/2117
2533/2533
1782/1782
1815/1815
1946/1946
2281/2281
1528/1528
—
1540/1540
1858/1858
2475/2475
1510/1510
—
1737/1739
1605/1605
2043/2046
2432/2442
2564/2565
—
1507/1575
2603/2617
2411/2416
920/920
2632/2635
—
3190/3191
229/242
2077/2077
1942/1947
2028/2028
1939/1977
2021/2025
1685/1687
2249/2249
312/312
—
2219/2220
2695/2696
76 430/76 802
41/41
Atr.
30/33
3/3
—
—
—
—
—
—
1/4
—
—
—
5/5
4/8
—
—
—
82/96
—
—
—
—
—
1/29
65/76
32/48
—
1/3
114/116
—
317/383
14/21
—
4/28
—
—
—
0/7
91/93
—
121/187
20/89
0/3
—
—
1407/1423
0/7
—
2312/2662
18/21
Ven.
—
—
4/4
—
—
39/40
508/511
59/59
17/18
37/40
—
—
—
47/48
—
107/107
—
16/16
443/443
—
—
—
52/52
796/815
184/185
18/20
318/345
76/77
190/208
1327/1348
—
164/183
—
321/581
260/261
156/159
138/157
31/63
—
381/382
—
462/484
366/371
—
—
—
814/828
3/3
7334/7808
29/29
Bbb.
—
—
—
—
—
—
—
—
—
2486/2486
—
—
—
—
—
—
—
2147/2161
—
—
—
—
1523/1526
—
—
—
—
—
1538/1559
—
—
—
1821/1824
—
1980/1993
—
—
—
—
—
—
—
—
—
1246/1247
435/437
—
—
13 176/13 233
8/8
Jct.
—
—
—
—
—
—
—
—
—
—
—
—
—
—
—
—
—
—
—
—
—
—
6/34
—
3/11
—
—
—
—
—
—
—
—
—
—
—
—
—
—
—
125/216
—
—
—
—
—
—
35/50
169/311
4/4
Oth.
—
—
2077/2079
—
2027/2040
—
—
2074/2075
—
—
—
—
—
—
—
—
—
—
—
—
—
—
—
—
—
—
—
—
—
—
—
—
—
—
—
—
1720/1802
—
—
—
—
—
—
—
—
—
—
—
7898/7996
4/4
Mis.
3/2267
0/1855
87/2182
0/2076
125/2203
5/2574
3/2011
1/2134
4/1770
3/2526
0/2117
0/2533
0/1787
5/1871
0/1946
0/2388
0/1528
28/2273
0/1983
0/1858
0/2475
0/1510
31/1612
49/2583
20/1877
21/2114
37/2787
4/2645
41/1883
89/2923
80/3000
31/2620
3/2744
287/3244
14/2254
4/3350
114/2201
39/2147
7/2040
1/2410
195/2380
95/2598
10/2061
0/2249
1/1559
18/1860
22/3055
16/2749
1493/108 812
—
Mis. %
0.13%
0.00%
3.99%
0.00%
5.67%
0.19%
0.15%
0.05%
0.23%
0.12%
0.00%
0.00%
0.00%
0.27%
0.00%
0.00%
0.00%
1.23%
0.00%
0.00%
0.00%
0.00%
1.92%
1.90%
1.07%
0.99%
1.33%
0.15%
2.18%
3.04%
2.67%
1.18%
0.11%
8.85%
0.62%
0.12%
5.18%
1.82%
0.34%
0.04%
8.19%
3.66%
0.49%
0.00%
0.06%
0.97%
0.72%
0.58%
1.37%
—
Zeeshan Syed et al.
7
Table 2: Summary comparison of detection through symbolization to cardiologist supplied labels. The labels used correspond to the
original MIT-BIH Arrhythmia database annotations (N = normal, L = left bundle branch block, R = right bundle branch block,
A = atrial premature beats, a = aberrated atrial premature beats, V = premature ventricular complex, P = paced beat, f =
fusion of normal and paced beat, F = fusion of ventricular and normal beat, j = junctional escape beat). The top row is indicative of how
well the clustering did at identifying the presence of classes of clinical activity identified by the cardiologists for each patient. The bottom
row indicates how well the clustering did at assigning individual beats to the same classes as the cardiologists.
N
Percentage of total
beats detected
L
R
A
a
V
P
f
F
j
100.0
Percentage of total
patients detected
100.00
100.00
84.21
100.00
100.00
100.00
100.00
75.00
100.00
99.50
99.67
87.30
85.11
96.80
99.91
78.75
99.52
46.69
56.96
Patients (%)
100
90
80
70
60
N
50
40
30
20
10
0
0
<1
<2
<3 <4 <5 <6
Mislabeled beats (%)
<7
<8
<9
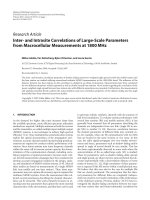
Figure 3: Mislabeling error: over a quarter of the patients had no
mislabeling errors using our clustering approach, over 65% had less
than 1% mislabeled beats relative to cardiologist labels.
Figure 3 also illustrates how the mislabeling error associated with our clustering approach is distributed across patients. In the majority of the patients, there is less than 1%
error.
As Tables 1 and 2 indicate, our symbolization technique
does a reasonably good job both at identifying clinically
relevant clusters and at assigning individual beats to the appropriate cluster.
The data in the first row of Table 2 sheds light on critical errors, that is, errors that cause one to conclude that a
patient does not exhibit a certain type of beat when, in fact,
their ECG signal does contain a significant number of the
beats in question. More precisely, we say that a critical error
has occurred when a patient has at least three instances of
a clinically relevant type of beat and there does not exist at
least one cluster in which that beat is a majority element. For
example, for each patient for whom the cardiologists found
three or more “premature ventricular complexes,” the algorithm formed a cluster for beats of that type. On the other
hand, for one quarter of the patients with at least three “fusion of ventricular and normal beats,” the algorithm did not
form a cluster for that type of beat.
In 43 out of 48 patients there were no critical errors. This
is important because, in the presence of critical errors, an
F
N
N
N
F
N
N
N
N
N
N
N
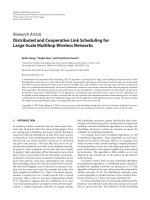
Figure 4: Raw tracing of ECG for patient 213 in the MIT-BIH
database with fusion of ventricular and normal beats: a sequence
of ECG is shown containing beats labeled as both normal (N) and
fusion (F). The morphological differences between the two classes
of beats are subtle. This excerpt corresponds to time 4 : 15 in the
recording.
R
R
R
R
R
R
J
J
J
J
J
Figure 5: Raw tracing of ECG for patient 124 in the MIT-BIH
database with junctional escape beats: a sequence of ECG is shown
containing both right bundle branch block (R) and junctional premature (J) beats. The morphological differences between the two
classes of beats are again subtle. This excerpt corresponds to time
4 : 39 in the recording.
inspection of the data through visualization of the cluster
representatives would conceal the presence of some activity
in the dataset. Avoiding critical errors is a challenge, because
for some patients, the number of elements in different clinical classes varies by a few orders of magnitude. For example,
as can be seen in the appendix, for patient 101, the process
correctly identifies the three atrial premature beats amidst
the 1852 normal beats.
For some classes of activity, however, our morphologybased clustering generated labels different from those provided by the cardiologists. Figure 4 presents an example
where morphology-based clustering differed from the labels
in the database. However, given the similarity between the
beats labeled F and N in the database, it is not clear that our
algorithm is in error. Similarly, our algorithm also failed to
distinguish right bundle branch block and junctional premature beats, as shown in Figure 5.
8
EURASIP Journal on Advances in Signal Processing
Table 3: Summary comparison of detection through symbolization to cardiologist supplied labels for the MGH/MF waveform
database. The labels of the columns match those in Table 2 with
J = junctional premature beats.
N
N
N
N
N
N
N
N
N
N
N
Figure 6: Raw tracing of ECG for patient 115 in the MIT-BIH
database with normal beats: a sequence of ECG is shown containing normal beats. This sequence represents an example where
morphology-based analysis separates the beats into short (first 7
beats) and long (last three beats) classes. The beats still fall in the
same clinical class, but this separation, which indicates an abrupt
change in heart rate, may potentially be of interest for the purpose
of higher level analysis. This excerpt corresponds to time 7 : 40 in
the recording.
N
N
N
N
N
(a)
N
N
N
N
N
(b)
Figure 7: Raw tracing of ECG for patient 106 in the MIT-BIH
database with normal beats: (a) ECG corresponding to time 16 : 54
in the file. (b) ECG corresponding to time 21 : 26 in the file.
Morphology-based analysis places the beats shown in (a) and (b)
into separate clusters based on changes in amplitude.
Sometimes our algorithm places beats for which cardiologists have supplied the same label into different clusters.
As was discussed above, this is not necessarily a bad thing
as subtle distinctions between “normal” beats may contain
useful clinical information. Figures 6 and 7 present instances
in which our algorithm separated beats that were assigned
the same label by cardiologists. In Figure 6, morphologybased analysis is able to distinguish changes in length. In
Figure 7, changes in amplitude are discerned automatically.
These morphological differences may represent clinically
important distinctions. In each instance, beats which are
classified as “normal” have very different morphologic features that may be associated with important disease states.
Abrupt changes in the R-R interval, like that noted in
Figure 6, correspond to rapid fluctuations in the heart—a
finding which can be associated with a number of clinically
important conditions such as Sick sinus Syndrome (SSS) or
sinus arrhythmia [5]. Similarly, significant changes in QRS
amplitude, like that seen in Figure 7, can be observed in
V
Percentage of total
clust. detected
100.00
100.00
Percentage of total
beats detected
99.91
96.51
P
J
F
100.00 100.00 100.00
98.84 100.0
100.0
patients with large pericardial effusions [5]. Both of these
diagnoses are important syndromes that can be associated
with adverse clinical outcomes. Therefore, we view the ability to make such distinctions between beats as a benefit of the
method.
Data from the MIT-BIH arrhythmia database were used
during the initial design of the symbolization algorithm, and
the results reported in Tables 1 and 2 were generated on this
data set. To test the robustness of the method, we also tested
our algorithm on ECG data on the first forty patients from
the MGH/MF waveform database (i.e., mgh001–mgh040),
which was not used in design of the algorithm. This dataset
contains fewer episodes of interesting arrhythmic activity
than the MIT-BIH arrhythmia database and is also relatively
noisy, but contains ECG signals sampled at the same rate
(i.e., 360 Hz) with 12-bit resolution, that is, a sampling rate
and resolution similar to that of the MIT-BIH arrhythmia
database. The recordings are also typically an hour long instead of 30 minutes for the MIT-BIH arrhythmia database.
Table 3 shows the performance of the symbolization algorithm on this dataset. The results are comparable to the ones
obtained for the MIT-BIH arrhythmia dataset.
The median number of clusters found in this case was 43.
We removed file mgh026 from analysis because of the many
errors in the annotation file which prevented any meaningful comparisons against the cardiologist-provided labels. We
also removed file mgh002, which was corrupted by noise
that led to errors in the segmentation of the ECG signal. We
also detected the presence of atrial escape beats for patient
mgh018, but do not report results for this class in Table 3
since no other patients revealed similar activity.
3.
HIGHER LEVEL ANALYSES
Symbolization leads to a discrete representation of the original cardiovascular signals. The goal of this analysis is to develop techniques that operate on these symbolic data to discover subsequences that correspond to clinically relevant activity in the original signal. A key aspect of our approach is
that no domain expertise is used to identify subsequences in
the original data stream.
Since our intent is to apply these techniques to massive
data sets, computational efficiency is an important consideration. The techniques also need to operate robustly on
noisy symbolic signals. There are two important sources of
noise, noisy sensors and imperfections in the symbolization
Zeeshan Syed et al.
9
process, that assign distinct symbols to beats that should have
been assigned the same symbol.
In this section, we present two classes of techniques:
techniques designed to extract relevant information from
individual signals (Section 3.1); and techniques designed
to extract relevant information across multiple signals
(Section 3.2). We evaluate the techniques in Section 3.3. We
provide examples showing that the techniques can indeed
be used to find segments of the original signal (or signals)
that correspond to activity described by cardiologists as clinically relevant. We would have liked to perform a quantitative
analysis of sensitivity and specificity. However, since we were
unable to find a public domain database in which all of the
events in the signals were marked (e.g., correlation amongst
signals, the presence of rhythms such as cardiac ballet, etc.),
such an analysis was not carried out.
The mining of physiological signals for recurrent transient patterns can be mapped to the task of detecting statistically significant subsequences that occur with sufficient frequency. The challenge is to discover complexes w1 w2 · · · wH
with shared spatial arrangement that occur more frequently
in the symbolic signal v1 v2 · · · vN than would be expected
given the background distribution over the symbols in the
data. The ranking function for this criterion considers two
factors: (1) the significance of a pattern relative to the background distribution of symbols; and (2) the absolute count
of the number of times the pattern was observed in the data
stream. Denoting the probability operator by Pr, the first criterion is equivalent to evaluating the expression
3.1. Analyzing single signal streams
The second criterion is necessary to deal with situations
where the pattern contains a very rare symbol. Depending
on the length of the pattern, the probability ratio in (8) may
be unduly large in such instances. Hence, the absolute number of times that the pattern occurs is explicitly considered.
Exact patterns that occur with high frequency can be found
by a linear traversal of v1 v2 · · · vN while maintaining state to
record the occurrence of each candidate pattern. Inexact patterns can be handled by searching in the neighborhood of a
candidate pattern in a manner similar to BLAST [15].
An example of a clinical condition that can be detected
by this approach is paroxysmal atrial tachycardia.
In this section, we examine ways for finding rhythms, recurrent transient patterns, and segments with high or low entropy in a single data stream.
3.1.1. Rhythms
A sequence w1 w2 · · · wH constitutes an exact or perfect repeat in a symbolic signal v1 v2 · · · vN with L > 1 periods if for
some starting position s,
L
vs vs+1 · · · vs+HL−1 = w1 w2 · · · wH .
(6)
The number of repeating periods L can be chosen to trim
the set of candidate repeats. We define rhythms as repeating subsequences in a symbolic signal. To address the issue of
noise, we generalize the notion in (6) to approximate repeats,
which allow for mismatches between adjacent repeats. A sequence w1 w2 · · · wH is an approximate repeat with L periods
if there exists a set of strictly increasing positions s1 , . . . , sL+1
such that for all 1 ≤ i ≤ L,
ϕ w1 w2 · · · wH , vsi vsi +1 · · · vsi+1 −1 ≤ γ,
(7)
where φ(p, q) represents a measure of the distance between
sequences p and q (e.g., the Hamming distance [13]) and γ is
a threshold constraining the amount of dissimilarity allowed
across the repeats. The final position sL+1 can be at most one
more than the length of v1 v2 · · · vN .
The problem of detecting all approximate repeats in a
symbolic signal can be solved using the algorithm presented
in [14] with a running time of O(Nγa log(N/γ)), where a
corresponds to the maximum number of periods in the signal. Examples of clinical conditions that can be detected by
this approach are bigeminy, trigeminy, and heart block.
3.1.2. Recurrent transient patterns
A related problem to detecting rhythms is detecting short recurrent patterns. These subsequences may be comprised of
repeats that are not sustained long enough to be discovered
by the techniques in Section 3.1.1.
Pr w1 w2 · · · wH
.
H
i=1 Pr wi
(8)
3.1.3. Entropy
Short bursts of irregular activity can be detected by searching for episodes of increased entropy. We search for subsequences in symbolic signals with an alphabet of size Λ in
which the entropy approaches log2 Λ. An example of a clinical condition that can be detected by this approach is atrial
fibrillation.
Conversely, the absence of sufficient variation (e.g., changes in the length of heart beats arising due to natural fluctuations in the underlying heart rate) can be recognized by the
lack of entropy over long time scales.
3.2.
Multisignal trends
The presence of massive datasets restricts visibility of multimodal trends. Most humans are restricted in their ability
to reason about relationships between more than two inputs
[16]. Automated systems can help address this limitation,
but techniques to analyze raw time-series data are computationally intensive, particularly for signals with high sampling
rates. Mutual information analysis cannot readily be applied
to raw data, particularly in the presence of time warping. As
shown in [17] (see Section 4), the symbolic representation of
the signal can greatly simplify this problem.
For example, one can examine the mutual information
across M sequences of symbols by treating each sequence as
a random variable Vi , for 1 ≤ i ≤ M, and examining the
10
EURASIP Journal on Advances in Signal Processing
multivariate mutual information I(V1 , . . . , VM ) [18]:
X
(−1) j+1 H Vi1 , . . . , Vi j ,
where H denotes the joint entropy between random variables. Computing I(V1 , . . ., VM ) in this manner is intractable
for large values of M. For computational efficiency, it is possible to employ k-additive truncation [19], which neglects corrective or higher order terms of order greater than k.
An alternative formulation of the problem of detecting
multimodal trends involves assessing the degree of association of sequences in M with activity in a sequence not in M
(denoted by VNEW ). Consider a set of symbols Ui , each corresponding to a realization of the random variable Vi , for 1
τ
≤ i ≤ M. Let H(VNEW ) be the entropy in VNEW at all time
instants t that are some specified time-lag, τ, away from each
τ
joint occurrence of the symbols Ui . That is, H(VNEW ) measures the entropy in VNEW at all time instants t satisfying the
predicate
(10)
We then define the time-lagged association between the
joint occurrence of the symbols Ui and signal VNEW as
X
Y
Y
Y
B
A
B
B
B
B
C
D
A
B
C
D
X
Y
Y
Y
X
Y
Y
Y
A
B
B
B
A
B
B
B
A
B
C
D
A
B
C
D
(b) Time-lagged association
Figure 8: Different formulations of correlation: (a) traditional correlation compares activity at every time instant. In this case, the
sequence at the top is perfectly correlated with the one just below
it, but the correlation is weaker with the sequence at the bottom.
(b) In this case, the time-lagged association with the sequence at
the top relative to the symbol X is the same for each of the other
two sequences. In the first case, for a time-lag of zero and a window length of 4, the subsequence ABBB is always associated with
the occurrence of X. In the second case, for a time-lag of zero and
a window length of 4, the subsequence ABCD is always associated
with the occurrence of X. In both cases, a consistent subsequence
is associated with X and the entropy of activity associated with X is
consequently 0.
(11)
If a time-lagged association exists, the entropy in VNEW
at all time instants t that obey the predicate in (10) will be
less than the entropy across the entire signal, that is, activity
at these time instants will be more predictable and consistent
with the underlying event in signals V1 through VM .
The difference between the formulations described by (9)
and (11) can be appreciated by considering two signals V1
and V2 . Equation (9) essentially determines if the two are
correlated. In (11), the focus is on identifying whether a specific class of activity in V1 is associated with a consistent
event in V2 , even if the signals may otherwise be uncorrelated. Figure 8 indicates the differences. Searching for timelagged associations using the method in (11) is likely to be
important for discovering activity that is associated with clinical events.
An example of a clinical condition that can be detected
by this approach is pulsus paradoxus.
3
2
1
0
−1
23.5
Amplitude
(mV)
τ
H VNEW − H VNEW .
Y
B
(a) Traditional correlation
Symbols
V1 [t − τ] = U1 ∧ · · · ∧ VM [t − τ] = UM .
Y
B
A
(9)
j =1 {i1 ,...,i j }⊆{1,...,M }
Y
A
M
23.55
23.6
23.65 23.7 23.75
Time (min)
23.8
23.85
23.9
γ
θ
23.5
23.55
23.6
23.65 23.7 23.75
Time (min)
23.8
23.85
23.9
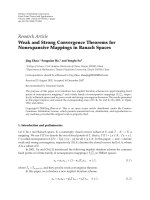
Figure 9: A patient with ventricular bigeminy.
3.3. Evaluation of symbolic analysis
The techniques for single-signal analysis discussed in Section
3.2 were tested on the MIT-BIH arrhythmia database.
3.3.1. Analysis of single ECG signals
Figures 9 and 10 provide examples of applying the approximate repeat detection techniques described in Section 3.1.
The figures show a fragment of the raw signal and a pictorial representation of the symbol stream for that fragment.
The pictorial representation provides a compact display of
the symbol string and facilitates viewing the signal over
long time intervals. In each case, the repeating sequence in
the symbolic signal corresponds to a well-known cardiac
rhythm that can be recognized in the raw tracings. Figure 9
presents a signal showing a ventricular bigeminy pattern,
while Figure 10 shows trigeminy. The associated symbolic
streams provided for both figures show the repetitious activity in the reduced symbolic representations.
Figure 11 shows that our automated methods can be used
to discover complex rhythms that are easy for clinicians to
miss. In this case, approximate repeat detection identifies an
Zeeshan Syed et al.
11
3
2
1
0
−1
Amplitude
(mV)
Amplitude
(mV)
4
2
0
−2
9.5 9.55
9.6
9.65
9.7 9.75 9.8
Time (min)
9.85
9.9
9.95
10
20.6 20.8
21
21.2 21.4 21.6 21.8
Time (min)
22
22.2 22.4 22.6
Symbols
β
Symbols
γ
θ
9.5 9.55
9.6
9.65
9.7 9.75 9.8
Time (min)
9.85
9.9
9.95
10
γ
θ
20.6 20.8
21
21.2 21.4 21.6 21.8 22 22.2 22.4 22.6
Time (min)
Figure 10: A patient with ventricular trigeminy.
Figure 12: A patient with recurrent tachyarrhythmic episodes.
These episodes appear in the raw tracing as dense regions, corresponding to an increased number of heart beats during these periods owing to faster heart rate.
2
0
Symbols
27.35
27.4
27.45
Time (min)
27.5
27.55
27.4
27.45
Time (min)
0
−2
Ψ
α
β
γ
θ
27.35
2
Amplitude
(mV)
−2
27.5
27.55
Symbols
Amplitude
(mV)
4
5
5.5
6
6.5
7
7.5
Time (min)
8
8.5
9
α
β
γ
θ
5
5.5
6
6.5
7
7.5
Time (min)
8
8.5
9
5.5
6
6.5
7
7.5
Time (min)
8
8.5
9
Figure 11: A rhythm of 4 units corresponding to an ectopic atrial
rhythm.
Entropy
2
intricate pattern which likely represents episodes of an ectopic atrial rhythm with aberrant ventricular conduction superimposed on an underlying sinus rhythm. This clinically
significant rhythm was not marked by the clinicians who annotated the signal.
Figure 12 shows an example in which the detection of recurrent transient patterns in symbolic signals reveals many
short, unsustained episodes of tachyarrhythmic activity. The
tachyarrhytmic beats occur infrequently relative to normal
beats, and consecutive runs of such activity are unlikely to
have occurred merely at random.
Figure 13 presents the result of applying the techniques in
Section 3.1.3 to discover high entropy segments corresponding to atrial fibrillation. The irregularity of activity leads to
entropy increasing noticeably in windows of the symbolic
stream, owing to the unstructured nature of the underlying
disorder.
1
0
5
Figure 13: Raw ECG tracing, symbolic signal, and entropy taken
over 30-second windows for a patient with atrial fibrillation. As in
Figure 14, atrial fibrillation in the raw tracings corresponds to the
dense regions.
3.3.2.
Analysis of multiple signals
We tested our techniques designed to discover knowledge in multisignal datasets (Section 3.2) on the Physionet
MGH/MF Waveform database, comprising recordings across
3 ECG channels, ART, PAP, CVP, respiration and airway
CO2, sampled at 360 Hz per channel with 12-bit quantization.
ART
symbols
ART amplitude
(mmHg)
β
γ
θ
19.45
100
80
60
19.45
19.5
19.5
19.5
19.55
Time (min)
19.55
Time (min)
19.55
Time (min)
19.6
19.6
19.6
19.65
19.65
19.65
Ψ
α
19.45
19.5
19.55
Time (min)
19.6
19.65
ECG
symbols
Resp.
symbols
19.45
ART amplitude
(mmHg)
1
ART
symbols
1.1
ECG amplitude
(mV)
EURASIP Journal on Advances in Signal Processing
Resp.
amplitude
12
5
0
−5
11
11.2 11.4 11.6 11.8 12 12.2 12.4 12.6 12.8
Time (min)
γ
θ
11
100
50
0
11
Ψ
α
β
11
11.2 11.4 11.6 11.8 12 12.2 12.4 12.6 12.8
Time (min)
11.2 11.4 11.6 11.8 12 12.2 12.4 12.6 12.8
Time (min)
11.2 11.4 11.6 11.8 12 12.2 12.4 12.6 12.8
Time (min)
Figure 14: Respiration and arterial blood pressure signals for a patient with pulsus paradoxus.
Figure 15: ECG and arterial blood pressure signals for a patient in
whom fast heart rate leads to increased arterial blood pressure.
Figures 14 and 15 demonstrate multisignal trend detection. In Figure 14, the search for correlated activity revealed a case of pulsus paradoxus, where inspiration is associated with a significant drop in arterial blood pressure. This
is often associated with cardiac tamponade, severe COPD,
pulmonary embolism, or right ventricular infarction. In
Figure 15, episodes of faster heart rate can be seen to occur in
conjunction with increased arterial blood pressure, a finding
indicative of a hemodynamically significant rhythm. In both
cases, associations between the symbolic representations allow for these phenomena to be easily detected.
trace segmentation, polygonal approximation, and wavelet
coefficients is discussed, and nonlinear alignment is also suggested to improve the quality of the clustering. We further examine morphology-based clustering through DTW from the
perspective of separating clusters with a widely varying number of elements, for example long-term patient data where
some groups of activity may have several orders of magnitude more members than others.
The goal addressed in [6] is to identify salient classes of
activity. The resulting sequences are not further analyzed. In
[21], stationary segments of EEG are clustered, and the original signal is replaced by the resulting sequences in a way resembling our approach. The focus of that work is to compress
the original signal, and not on the analysis of the resulting sequence of symbols.
In [22] a method is presented for clustering QRS complexes using a basis function representation. The approach
consists of: (1) segmenting ECG data streams according to
the R-R interval; (2) expressing each beat as a linear combination of Hermite basis functions; and (3) clustering these
beats using self-organizing neural networks [22]. Application
to the MIT-BIH arrhythmia database results in 25 clusters
with an overall misclassification error of only 1.5%.
An important aspect of the method in [22] is that it
performs electrocardiographic feature extraction using a basis set containing at most 6 Hermite functions. Each Hermite function contains a “width parameter” that enables one
4.
RELATED WORK
The process of creating symbolic representations of physiologic signals has been extensively studied in the context of
ECG. Holter monitors [20] use special purpose algorithms to
distinguish between different clinical classes of electrophysiological activity. In contrast, we have developed generic techniques that do not assume any prior knowledge, and instead
discriminate among activities based on nonparametric morphological differences. Our techniques are designed both to
reproduce the results of these specialized techniques, and to
obtain complementary information. In this sense, our work
is closely related to [6], which presents a fairly comprehensive evaluation of various approaches to morphology-based
clustering. The use of visual features such as time samples,
Zeeshan Syed et al.
to effectively model QRS complexes with very different
lengths. However, since the method relies on a relatively
small set of basis functions, it may not fully capture subtle morphologic differences between beats. For example, in
[22] the misclassification error for ventricular escape beats
(E) is 37.7%. The majority of these errors involve misclassifying ventricular beats as right bundle branch block (R). While
beats belonging to the classes E and R both have long QRS
durations, ventricular escape beats and right bundle branch
block beats typically have significantly different morphologies [5].
Overall, our clustering approach performs marginally
better on the MIT-BIH database. We found twenty-two clusters for the median patient (versus twenty-five in [22]) and
had an overall misclassification error of 1.4% (versus 1.5%
in [22]). Moreover, our method is based on comparing morphological characteristics of each beat and therefore does not
make any assumption about the underlying form of each
QRS complex. Consequently, our approach seems to be more
sensitive to subtle variations in beat morphology. On the
MIT-BIH database, for example, the misclassification error
for beats within class E is only 6.7%—considerably lower
than the 37.7% reported for the same database in [22].
We did not discover much prior work in the area of highlevel analysis of physiological symbolic sequences to uncover
rhythms, patterns, and cross-signal interactions. A recent effort addressing this goal is described in [17]. In this case,
symbolic strings are created corresponding to beat-by-beat
changes in heart rate and blood pressure, and the evolution
of the two signals is examined by means of joint symbolic dynamics, which measure simultaneous increases and decreases
in both quantities.
5.
SUMMARY AND CONCLUSIONS
In this paper, we presented and evaluated fully automated
techniques for analyzing large amounts of cardiovascular
data. Unlike traditional medical expert systems, which are
aimed at detecting a prespecified set of events using a priori
knowledge, we address the issue of discovering events with
limited prior knowledge. Furthermore, since our techniques
are intended to be applied to large data sets, for example,
multiple days of continuous high-resolution ECG data, we
place considerable emphasis on computational efficiency.
We focussed on transforming continuous waveform signals into symbolic strings derived directly from the data.
Morphological features are used to partition beats into
classes by maximizing the sequence-aligned separation of
clusters, and the original signal is replaced by the corresponding sequence of symbols.
The symbolization process allows us to shift from the
analysis of raw signals to the analysis of sequences of symbols.
A discrete representation provides a layer of data reduction,
making the search space for discovering interesting activity
more manageable.
We described techniques that operate in this symbolic
domain to discover cardiac activity of potential clinical im-
13
portance. Our techniques automatically detect rhythms,
transient patterns, high-entropy regions, and multisignals relationships.
We evaluated our techniques on files from 48 different
patients drawn from the MIT-BIH arrhythmia public domain database of annotated ECG tracings. Our symbolization process placed beats in the same class as the cardiologist supplied annotations over 98.6% of the time, and for
many of the differently classified beats the correct classification was arguable. In addition, our techniques allow for
distinctions within clinical classes that could be relevant. We
further tested our algorithm on a blind set of 40 patients from
the MGH/MF waveform database who were not used during
the algorithm design process. In this case, our symbolization
placed beats in the same class as the cardiologist-supplied annotations over 99.1% of the time.
The use of morphological features in conjunction with a
DTW-based dissimilarity metric appeared to be sufficient for
achieving a meaningful partitioning of the data in the case
of ECG signals. Our modifications to the traditional DTW
algorithm improve performance in the presence of additive
noise and make the technique more sensitive to variations in
length. The combined use of Max-Min clustering and a fuzzy
preclustering phase allows the analysis of large amounts of
data without excessive demands in terms of time or space.
Our higher level analysis techniques proved effective at
identifying clinically relevant activity from symbolized ECG
streams. Since the database did not label all occurrences of
clinically relevant portions of the ECG, we were unable to
evaluate the sensitivity of our analysis. We did have a cardiologist verify the specificity, and all of the detected sequences
were indeed potentially clinically relevant. In one case, our
techniques detected an ectopic atrial rhythm with aberrant
ventricular conduction superimposed on an underlying sinus rhythm that had apparently gone undetected by the cardiologists compiling the data base.
We also demonstrated that our techniques aimed at
identifying potentially relevant relationships across multiple
symbolized streams, for example, streams representing ECG
and respiratory data, could be used to find clinically significant activity.
Operating on a reduced symbolic representation of the
original signals simplified the problem of discovering interesting activity. The search for many broad classes of clinical
conditions could be posed in this symbolic domain, and a
number of efficient techniques could be borrowed from computational biology and information theory.
Our techniques are intended to complement, not replace,
existing methods. In scenarios where strong priors exist regarding the activity of interest, specialized detectors can be
designed by factoring in known relationships between the
signals and the underlying physiological activity may well
out-perform our generic techniques. Furthermore, our techniques are not designed to provide definitive diagnoses, but
rather to help professionals by making it easier for them to
focus on the most relevant data. Correct interpretation of the
data requires information, for example, clinical history, that
is not currently incorporated in our methods.
14
EURASIP Journal on Advances in Signal Processing
Table 4: Beats detected for each patient in the MIT-BIT arrhythmia database using symbolization. The error in this case is similar to that
reported in Table 1, with an overall error once again of 1.37%. The labels are identical to those in Table 2.
Patient
100
101
102
103
104
105
106
107
108
109
111
112
113
114
115
116
117
118
119
121
122
123
124
200
201
202
203
205
207
208
209
210
212
213
214
215
217
219
220
221
222
223
228
230
231
232
233
234
Tot. Bts.
Tot. Clu.
N
2234/2234
1852/1852
14/99
2076/2076
51/163
2530/2076
1500/1500
—
1748/1748
—
2117/2117
2533/2533
1782/1748
1815/1815
1946/1946
2281/2281
1528/1528
—
1540/1540
1858/1858
2475/2475
1510/1510
—
1737/1739
1605/1605
2043/2046
2432/2442
2564/2565
—
1507/1575
2603/2617
2411/2416
920/920
2632/2635
—
3190/3191
229/242
2077/2077
1942/1947
2028/2028
1939/1977
2021/2025
1685/1687
2249/2249
312/312
—
2219/2220
2695/2696
76 430/76 802
41/41
L
—
—
—
—
—
—
—
—
—
2486/2486
—
—
—
—
—
—
—
—
—
—
—
—
—
—
—
—
—
—
1453/1470
—
—
—
—
—
1980/1993
—
—
—
—
—
—
—
—
—
—
—
—
—
5919/5949
3/3
R
—
—
—
—
—
—
—
—
—
—
—
—
—
—
—
—
—
2147/2161
—
—
—
—
1523/1526
—
—
—
—
—
85/89
—
—
—
1821/1821
—
—
—
—
—
—
—
—
—
—
—
1246/1247
435/437
—
—
7257/7281
6/6
A
30/33
3/3
—
—
—
—
—
—
1/4
—
—
—
—
4/8
—
—
—
82/96
—
—
—
—
—
1/29
15/24
18/35
—
1/3
114/116
—
317/383
—
—
3/25
—
—
—
0/7
91/93
—
121/187
19/72
0/3
—
—
1407/1423
0/7
—
2227/2551
16/19
ACKNOWLEDGMENTS
We would like to thank Manolis Kellis and Piotr Indyk
for their insightful suggestions regarding the clustering process. We would also like to thank the anonymous reviewers and the editor whose many constructive suggestions led
a
—
—
—
—
—
—
—
—
—
—
—
—
5/5
—
—
—
—
—
—
—
—
—
—
—
49/52
10/13
—
—
—
—
—
14/21
—
2/3
—
—
—
—
—
—
—
—
—
—
—
—
—
—
80/94
5/5
V
—
—
4/4
—
—
39/40
508/511
59/59
15/16
37/38
—
—
—
42/44
—
107/107
—
16/16
443/443
—
—
—
47/47
796/814
183/183
18/19
318/344
66/66
92/103
949/977
—
154/172
—
192/219
259/260
156/159
138/157
31/62
—
381/382
—
457/470
366/371
—
—
—
806/817
3/3
6682/6903
29/29
P
—
—
2022/2023
—
1375/1375
—
—
2074/2075
—
—
—
—
—
—
—
—
—
—
—
—
—
—
—
—
—
—
—
—
—
—
—
—
—
—
—
—
1540/1544
—
—
—
—
—
—
—
—
—
—
—
7011/7017
4/4
f
—
—
6/56
—
601/665
—
—
—
—
—
—
—
—
—
—
—
—
—
—
—
—
—
—
—
—
—
—
—
—
—
—
—
—
—
—
—
164/258
—
—
—
—
—
—
—
—
—
—
—
771/979
3/3
F
—
—
—
—
—
—
—
—
—
—
—
—
—
0/4
—
—
—
—
—
—
—
—
3/5
—
—
—
—
9/9
—
311/371
—
4/10
—
39/362
—
—
—
—
—
—
—
0/14
—
—
—
—
1/11
—
367/786
6/8
j
—
—
—
—
—
—
—
—
—
—
—
—
—
—
—
—
—
—
—
—
—
—
3/5
—
3/10
—
—
—
—
—
—
—
—
—
—
—
—
—
—
—
125/215
—
—
—
—
—
—
—
131/230
3/3
to considerable improvement in the manuscript. This work
was supported by the Center for Integration of Medicine
and Innovative Technology (CIMIT), the MIT Project Oxygen Partnership, the Burrough’s Wellcome Fund and the
Harvard-MIT Health Sciences and Technology (HST) Division.
Zeeshan Syed et al.
15
REFERENCES
[1] D. Kopec, M. H. Kabir, D. Reinharth, O. Rothschild, and J.
A. Castiglione, “Human errors in medical practice: systematic
classification and reduction with automated information systems,” Journal of Medical Systems, vol. 27, no. 4, pp. 297–313,
2003.
[2] G. D. Martich, C. S. Waldmann, and M. Imhoff, “Clinical informatics in critical care,” Journal of Intensive Care Medicine,
vol. 19, no. 3, pp. 154–163, 2004.
[3] Z. Syed and J. Guttag, “Prototypical biological signals,” in Proceedings of IEEE International Conference on Acoustics, Speech,
and Signal Processing (ICASSP ’07), Honolulu, Hawaii, U.S.A.,
April 2007.
[4] C. S. Daw, C. E. A. Finney, and E. R. Tracy, “A review of symbolic analysis of experimental data,” Review of Scientific Instruments, vol. 74, no. 2, pp. 915–930, 2003.
[5] E. Braunwald, D. Zipes, and P. Libby, Heart Disease: A Textbook of Cardiovascular Medicine, WB Saunders, Philadelphia,
Pa, USA, 2001.
[6] D. Cuesta-Frau, J. C. P´ rez-Cort´ s, and G. Andreu-Garc´a,
e
e
ı
“Clustering of electrocardiograph signals in computeraided Holter analysis,” Computer Methods and Programs in
Biomedicine, vol. 72, no. 3, pp. 179–196, 2003.
[7] C. S. Myers and L. R. Rabiner, “A comparative study of several
dynamic time-warping algorithms for connected-word recognition,” The Bell System Technical Journal, vol. 60, no. 7, pp.
1389–1409, 1981.
[8] D. L. Donoho, “De-noising by soft-thresholding,” IEEE Transactions on Information Theory, vol. 41, no. 3, pp. 613–627,
1995.
[9] G. Chen, Q. Wei, and H. Zhang, “Discovering similar timeseries patterns with fuzzy clustering and DTW methods,” in
Proceedings of Joint 9th IFSA World Congress and 20th NAFIPS
International Conference (NAFIPS ’01), vol. 4, pp. 2160–2164,
Vancouver, BC, Canada, July 2001.
[10] E. J. Keogh and M. J. Pazzani, “Scaling up dynamic time warping for data mining applications,” in Proceeding of the 6th ACM
SIGKDD International Conference on Knowledge Discovery and
Data Mining (KDD ’00), pp. 285–289, Boston, Mass, USA, August 2000.
[11] T. F. Gonzalez, “Clustering to minimize the maximum intercluster distance,” Theoretical Computer Science, vol. 38, no. 23, pp. 293–306, 1985.
[12] J. Fraden and M. R. Neuman, “QRS wave detection,” Medical
and Biological Engineering and Computing, vol. 18, no. 2, pp.
125–132, 1980.
[13] R. Hamming, “Error-detecting and error-checking codes,” The
Bell System Technical Journal, vol. 29, no. 2, pp. 147–160, 1950.
[14] G. M. Landau, J. P. Schmidt, and D. Sokol, “An algorithm for
approximate tandem repeats,” Journal of Computational Biology, vol. 8, no. 1, pp. 1–18, 2001.
[15] S. F. Altschul, W. Gish, W. Miller, E. W. Myers, and D. J. Lipman, “Basic local alignment search tool,” Journal of Molecular
Biology, vol. 215, no. 3, pp. 403–410, 1990.
[16] D. Jennings, T. Amabile, and L. Ross, “Informal covariation
assessments: data-based versus theory-based judgements,” in
Judgement Under Uncertainty: Heuristics and Biases, pp. 211–
230, Cambridge University Press, Cambridge, UK, 1982.
[17] M. Baumert, V. Baier, S. Truebner, A. Schirdewan, and A. Voss,
“Short- and long-term joint symbolic dynamics of heart rate
and blood pressure in dilated cardiomyopathy,” IEEE Transac-
[18]
[19]
[20]
[21]
[22]
tions on Biomedical Engineering, vol. 52, no. 12, pp. 2112–2115,
2005.
N. Abramson, Information Theory and Coding, McGraw Hill,
New York, NY, USA, 1963.
I. Kojadinovic, “Relevance measures for subset variable selection in regression problems based on k-additive mutual information,” Computational Statistics & Data Analysis, vol. 49,
no. 4, pp. 1205–1227, 2005.
N. J. Holter, “New method for heart studies,” Science, vol. 134,
no. 3486, pp. 1214–1220, 1961.
R. Agarwal, J. Gotman, D. Flanagan, and B. Rosenblatt, “Automatic EEG analysis during long-term monitoring in the ICU,”
Electroencephalography and Clinical Neurophysiology, vol. 107,
no. 1, pp. 44–58, 1998.
M. Lagerholm, C. Peterson, G. Braccini, L. Edenbrandt, and
L. Să rnmo, Clustering ECG complexes using hermite funco
tions and self-organizing maps,” IEEE Transactions on Biomedical Engineering, vol. 47, no. 7, pp. 838–848, 2000.
Zeeshan Syed received the S.B. and M.Eng.
degrees in electrical engineering and computer science from the Massachusetts Institute of Technology (MIT), Cambridge, MA,
in 2003, and is currently working towards
a Ph.D. in the Harvard-MIT Health Sciences and Technology (HST) Division between the Department of Electrical Engineering and Computer Science, MIT, and
Harvard Medical School. He has conducted
research at the Computer Science and Artificial Intelligence Laboratory (formerly Laboratory for Computer Science) at MIT, since
2001, working on projects related to the analysis and modeling
of physiological signals, tools for the structured discovery of diagnostic markers, prototypical representations of biological activity, and the efficient detection of multimodal patterns in long-term
data. His research interests include biomedical signal processing,
machine learning, algorithms and computational biology. He is a
Member of Sigma Xi, Tau Beta Pi, and Eta Kappa Nu. He is also a
Recipient of the William A. Martin, Morris J. Levin Masterworks,
and the Global Technovators awards at MIT.
John Guttag is the Dugald C. Jackson Professor of electrical engineering and computer science and a Member of the Computer Science and Artificial Intelligence
Laboratory at the Massachusetts Institute of
Technology (MIT), Cambridge, MA. Professor Guttag received A.B. and S.M. degrees
from Brown University and his doctorate
from the University of Toronto. He was on
the faculty of the University of Southern
California from 1975–1978, and joined the MIT faculty in 1979.
From 1993–1998, he served as Associate Department Head from
Computer Science of MIT’s Electrical Engineering and Computer
Science Department, and served as Head of that department from
1999–2004. His current research interests include the application of
wireless networking in healthcare, the development of techniques
for the early detection of and interventions to control epileptic
seizures, and techniques for analyzing large amounts of physiological data to discover information that can be used to assist in improving the management of chronic illness.
16
Collin Stultz received his A.B. in mathematics and philosophy from Harvard College, magna cum laude, in 1988 and a Ph.D.
in biophysics from the Graduate School of
Arts and Sciences at Harvard University
in 1997. That same year, he also earned
an M.D., magna cum laude, from Harvard
Medical School. He is a board certified cardiologist who trained at the Brigham and
Women’s Hospital in Boston. He is on the
faculty in the Division of Health Sciences and Technology (HST)
and MIT’s Department of Electrical Engineering and Computer
Science. He is a Member of the American Society for Biochemistry and Molecular Biology, the Federation of American Societies
for Experimental Biology, the American Heart Association, and the
American College of Cardiology. His research interests include the
analysis of complex biological phenomena, including the structural
dynamics of proteins and the interpretation of biological signals.
EURASIP Journal on Advances in Signal Processing