An approach based on machine learning techniques for forecasting Vietnamese consumers’ purchase behaviour
Bạn đang xem bản rút gọn của tài liệu. Xem và tải ngay bản đầy đủ của tài liệu tại đây (359.52 KB, 10 trang )
Uncertain Supply Chain Management 8 (2020) 495–504
Contents lists available at GrowingScience
Uncertain Supply Chain Management
homepage: www.GrowingScience.com/uscm
The effect of IS SERVQUAL and user information satisfaction (UIS) adoption on user
satisfaction
Yohan Wismantoroa*, Heribertus Himawana and Karis Widiyatmokoa
a
Universitas Dian Nuswantoro, Semarang, Indonesia
CHRONICLE
Article history:
Received January 29, 2020
Received in revised format March
20, 2020
Accepted April 21 2020
Available online
April 21 2020
Keywords:
Information System
User Information Satisfaction
Service Quality
ABSTRACT
Information systems are essential resources for business organizations. Besides, user
information satisfaction will have an impact on service quality. This research used a
Myerscough study, which combined user information satisfaction and SERVQUAL
instruments, which was to measure the quality of information system services and investigated
the correlation between the quality of information system service and user satisfaction. The
survey was conducted on traditional Batik and textile artisans in Central Java, Indonesia. The
results of this research reported a model that is slightly in accordance with previous studies.
The only variable, which influenced the quality of information system services through
SERVQUAL was empathy. However, information system user satisfaction was proven to be
affected by the quality of information system services. This study also recommends further
research on better instruments for assessing the quality of information system services.
© 2020 by the authors; license Growing Science, Canada.
1. Introduction
The current paradigm regarding company strategy is not only how to defeat the competitors but also
how to build satisfaction of customers (Alegre, 2013; Vu, 2014; Blank, 2014; O, Malley, 2014; Shao,
2016; Escrig, 2018; Putri, Udin, & Djastuti, 2019). With the creation of customers’ satisfaction, it will
encourage them always to use the product or the services again. In general, every company believes in
one of concept or philosophy marketing, which become the basis of every activity in satisfying the
needs and desires of customers, including in the market place (e-commerce), which has begun to
become a business platform. With the broader acceptance of smartphone and tablets in people lifestyle,
mobile shopping has become increasingly popular in recent years (Gandhi, 2016; Kanaanm, 2017;
Ferdinand, 2002). Shopping services via mobile devices using wireless facilities allow shopping to be
done everywhere and provide consumers convenience in shopping. As a result, mobile commerce is a
behavior of using mobile technology as well as consuming behavior. The importance of mobile
commerce increases, and it broadens the power of consumers in shopping. Different with traditional
electronic commerce, cellular trading allows the emergence of shopping everywhere through various
mobile devices, such as smartphones, tablets, notebook computers, etc. The mobile device eliminates
the time and location limits for shopping. Consumers can easily get the latest product
information/promotions for their shopping needs and, of course, save time shopping in accordance with
* Corresponding author
E-mail address: (Y. Wismantoro)
© 2020 by the authors; licensee Growing Science.
doi: 10.5267/j.uscm.2020.4.003
496
their lifestyle. However, the literature to view mobile commerce behavior in the perspective of
consumer behavior is still limited (Agrebi dan Jallais, 2015; Faqih dan Jaradat, 2014). Besides, not all
perceived usefullness motives all group of mobile shopping service users (Shangand Wu, 2017; Park
et al., 2019; Choe, 2018). The perspective of consumer behavior, consumer users, and user satisfaction
are the concern in mobile commerce (Ardiansah, Chariri, Rahardja, & Udin, 2020). In this case, the
success model of information system (IS) shows the importance of system and user satisfaction in
achieving user benefits. To explore the impact of usage and user satisfaction on mobile shopping
platforms, therefore, this study conducted an empirical survey based on the success model of
information system (IS).
Many studies have been accomplished to measure service quality and information system user
satisfaction. Instruments for measurement have also been extensively studied. Ives et al. (1983)
researched to measure the satisfaction of information system users. The instrument was called UIS
(User Information Satisfaction). They conducted an exploratory factor analysis of the variables
affecting the quality of information system services. Besides, many other scientists researched service
quality in the field of marketing called SERVQUAL (e.g. Parasuraman, Zeithaml, Berry, 1988; Pitt,
Kavan, & Watson, 1995; Becker & Pizzutti, 2017; Burns et al., 1992; Babacus & Mangold, 1992). In
this study, it can be said that SERVQUAL met the requirements to be used as an instrument to measure
the quality of information system services. Also, Kettinger and Lee (1995) tried to use SERVQUAL as
an instrument to measure the quality of information system services. In their research, the tangible
dimension is a dimension that is not suitable to be applied, but the other four dimensions are
scientifically proven to be suitable for use. Moreover, Kettinger and Lee (1994) also suggested that
SERVQUAL can be combined with User Information Satisfaction (UIS) as an instrument to measure
the quality of information system services.
This study tries to investigate the effect of service quality on user satisfaction. The instrument used was
an instrument developed by Myerscough (2002), which was a combination of UIS and SERVQUAL
instruments as tools to measure service quality. Further, the question of global quality assessment from
UIS would be used as an instrument to measure user satisfaction. The dependent variable was the
overall quality, which would be measured using UIS and SERVQUAL indicators, while the
independent variable was user satisfaction. In the overall quality variable as an unobserved variable,
UIS indicators were grouped into three dimensions; namely knowledge and involvement, product
quality information, and attitude of EDP staff and services, whereas indicators for SERVQUAL would
only use two dimensions, namely: reliability and empathy.
2. Literature Review and Hypotheses Development
2.1 Management of information systems
Information management can be defined as the activity of obtaining information, using it as effectively
as possible and discarding it when appropriate. O'Brien (1999) divided the information system area into
five major parts, namely: management of information systems, development of information systems,
application of information systems, the technology of information systems, and foundation concepts of
information systems. Thus, information systems are a combination of organizing people, hardware,
software, communication networks, and data sources, where information is called, transformed, and
distributed within an organization (Avgerou, 2000; Maguire, 2000; DeLone, 2003; Gupta et al., 2019).
In addition, data is a collection of unprocessed facts and figures that are relatively meaningless to the
user. Meanwhile, information is data that has been managed and processed so that it has a particular
meaning for the user. The system itself is a collection of integrated elements with the same intention to
achieve the goal (McLeod, 1995). However, concerning computer-based information systems, two
knowledge is needed, namely: knowledge of computers and information literacy (O'Brien, 1999). Both
of these knowledges are different information for each domain. Knowledge of information in the field
Y. Wismantoro et al. /Uncertain Supply Chain Management 8 (2020)
497
of construction companies is undoubtedly different from information knowledge in the medical field.
For this reason, we need expertise from each party to develop information system.
2.2 User information satisfaction (UIS)
Information systems can be used as one of the competitive advantages in a strategic organization. The
decision to install an information system is an option to determine whether an information system is
indeed needed, and after that, the system must function properly. The UIS is described where system
users believe that the available information system can be used to meet their information needs. This
instrument was developed by Ives et al. (1983). They tried to examine the difference between using
two and four question items in one variable without reducing validity based on the results of Pearson’s
research. It aimed to reduce the number of indicator items in the Pearson model, which reached to 39
items. The method used was the exploratory factor analysis. From the results of Ives et al. (1983), it
was found that the validity and reliability of the data was not affected by measurements using two items
per scale. Nevertheless, this instrument was still considered for years. For this reason, the selection of
genuinely relevant indicators without reducing validity and reliability was needed. Some less
meaningful indicators were excluded from the indicators. As a result, 22 indicator items are still
maintained. The results of this simplification are often referred to as short-form UIS (UIS Short Form)
(Ives et al., 1983; Groß, 2015).
2.3 IS SERVQUAL
Consumer perceptions of service quality levels have been the focus of research in marketing
(Myerscough, 2002; Carr, 2002; Senthil, 2017). Parasuraman et al. (1988) found that service quality is
determined by the comparison between what customers feel about what should be offered/provided
with what has been offered/provided. The perception of service quality is seen from the level and
direction of the difference between customer perceptions and expectations. There is a difference
between service quality and customer satisfaction, where the perception of service quality is a global
assessment or behavior related to service superiority. In contrast, satisfaction is related to specific
transactions. In their research, Parasuraman et al. (1988) used a model that included ten dimensions,
namely: tangibles, reliability, responsiveness, communication, credibility, security, competence,
courtesy, understanding/knowing the customer, and access. Measurements were made using 97
question items. The final results of the study prove that only tangibles, reliability, responsiveness,
assurance, and empathy had validity to the quality of service. As for measurement instruments, it used
22 question items.
a. Tangibles are the appearance of physical facilities, including equipment, personal, and means
of communication.
b. Reliability is the company's ability to keep and fulfill promises given to customers convincingly.
c. Responsiveness is quickly responsive in reading and serving the desires or needs of consumers.
d. Assurance, namely knowledge, reliability, and courtesy of employees which can be trusted and
confident.
e. Empathy is personal care and attention given by personal/individuals in the company to
consumers.
Information systems researchers often face the risk of incorrect measurement of the effectiveness of
information systems, because they often ignore the quality of information system services (Pitt et al.,
1995; Maguire, 2000; Chrisanthi, 2000). Pitt et al. (1995) suggest the use of SERVQUAL as an
instrument to measure the quality of information system services. It is because the information systems
department provides broader services, where previously, they only acted as developers and operations
managers as service providers. The effectiveness of information systems is a multi-dimensional
construct. Virtually, all tangible products have intangible attributes, and all services have tangible
498
values (Pitt et al., 1995; Fawcett, 2011). In some cases, the product is only a bridge to get services. For
example, personal computer users do not just want a computer machine. They also expect installation
services, training in the use of software, technical support, and so on. Goods and services are not things
that can be clearly separated. They exist in the tangibility spectrum, ranging from pure products to
services as a whole, with a combination somewhere near the midpoint. Frequent measurements are
focused on the final spectrum in terms of tangibility. Pitt et al. (1995) argued that service quality, as a
spectrum on the reverse side, needs to be considered as an additional measure of information system
success. There are two possible units for analyzing the quality of information system services, which
are the Department of Information Technology and Information Systems itself (Fawcett, 2011;
Hummel, 2015; Hoda, 2016; Hoda, 2017). When a user only interacts with one system (for example, a
salesclerk who serves customers via the telephone), the user’s impression of the quality of service is
limited to that one system. In this case, the unit of analysis is the information system itself. On the other
hand, if the user interacts with various systems (e.g., personnel managers) that uses human resource
information systems, word processors, spreadsheets, etc., the unit of analysis can be either the system
itself or the information systems department. However, the separation of multi-system users is
irrelevant. For example, a user who has difficulty getting repair services, then attention is not directed
to the existing system, but the services of the information systems department. Although the quality of
the system and the information quality are often associated with specific software products, it does not
always mean the quality of service. Regardless of whether users interact with one or many systems,
service quality can affect user usage and satisfaction (Hoda 2016; Hoda 2017). The difference between
the service expected and received is the gap. Parasuraman et al. (1988) operated a conceptual model of
service quality through gap measurement as a measurement of marketing constructs. The measurement
uses two statements, where one statement is to measure expectations, and one statement is to measure
perception.
2.4 Service-dominant logic (SDL)
Dominant Logic Service theory tries to revise various theories, including SERVQUAL, which has long
been used by researchers. The service industry is a pillar of the current global economy; thus, the
concept of service-dominant logic does not separate between the goods-dominant logic and servicedominant logic. Service-dominant logic plays a key role in the intangible role, namely, service
excellence in matters related to intangible marketing programs, such as values, co-creation, how to
provide satisfaction to customers, how to focus on customers, and so on. When a company fails to
provide satisfaction to its customers, it requires hard efforts to improve it (Cheung & To, 2016; Aryanto
et al., 2018; Soliha et al., 2019; Sekaran, 2006; Wong et al., 2012). Wu et al. (2018) examined the
relationship between co-creation values that are part of the service-dominant logic and the customercentric concept. S-D logic is expanded into an exchange relationship between a company and its
customers formed from the perspective of an ecosystem that integrates corporate resources and the cocreation values of customers (Lusch & Vargo, 2014; Grönroos, 1991; Kaplan, 1991; Van Dyke et al.,
1997, 1999). S-D logic is essentially not universally adopted by service marketers. Co-creation values
are created because of interactions with customers. Value is defined as value-in-use (value of benefits)
in the universal sense. At the same time, the understanding of S-D logic emphasizes that value is created
dynamically between the company and its customers by combining value-in-use with value-in-context
(value is created due to a specific context). As mentioned above, value-ini-use (customer-centric) and
value-exchange (supplier centric) are the main components in the value-in-context of an embodiment
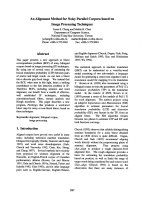
of the co-creation network. According to the review of literature and previous research, the researcher
developed the conceptual framework in this study, as follows:
Based on the construct above, the hypotheses proposed were:
H1: Knowledge and involvement affect user information satisfaction.
H2: Quality of information product affects user information satisfaction.
H3:Attitude toward EDP staff and service affect. user information satisfaction.
Y. Wismantoro et al. /Uncertain Supply Chain Management 8 (2020)
499
H4: Reliability affects IS SERVQUAL.
H5: Empathy affects IS SERVQUAL.
H6: User information satisfaction affects the overall quality.
H7: IS SERVQUAL affects the overall quality.
H8: Overall quality affects user satisfaction.
ζ1
1
Knowledge &
Involvement-UIS
(X1)
ζ2
1
Quality of Information
Product-UIS
(X2)
ζ3
1
Attitude Toward EDP
Staff & Service-UIS
(X3)
ζ4
1
Reliability
Servqual
(X4)
1
Empathy
Servqual
(X5)
λ1.1
λ1.2
User Information
Satisfaction (ξ2)
1
λ1.3
Overall Quality
(ξ1)
γ1
User satisfaction
(ή1)
λ2.1
IS Servqual (ξ3)
ζ5
ζ6
λ1
λ2
λ2.2
Fig. 1. Research Framework
3.
Research Methods
The population in this study were all traditional Batik and Textile artisans in Klaten, Central Java,
Indonesia. The number of samples in this study was 260 people. Then, the data were processed
employing structural equation modeling (SEM) analysis with Amos 19 software.
Table 1
Hypotheses Testing
IS SERVQUAL
UIS
Kn & In-UIS
QIP-UIS
AESS-UIS
Rel-SQ
Emp-SQ
User Satisfaction
UIS3
UIS4
UIS5
UIS7
UIS8
UIS9
UIS10
UIS6
UIS11
SQ1
SQ3
SQ4
SQ14
SQ16
SQ17
SQ18
E1
E2
E3
E4
Overall Quality
Overall Quality
UIS
UIS
UIS
IS SERVQUAL
IS SERVQUAL
Overall Quality
Kn & In-UIS
Kn & In-UIS
Kn & In-UIS
QIP-UIS
QIP-UIS
QIP-UIS
QIP-UIS
AESS-UIS
AESS-UIS
Rel-SQ
Rel-SQ
Rel-SQ
Emp-SQ
Emp-SQ
Emp-SQ
Emp-SQ
UserSatisfaction
UserSatisfaction
UserSatisfaction
UserSatisfaction
Estimate
.842
1.000
1.000
.925
.485
1.000
1.311
1.492
1.000
.807
.682
1.000
1.036
.951
1.326
1.000
.502
1.000
1.553
1.540
1.000
1.081
1.096
.884
1.000
1.050
1.021
1.029
S.E.
.111
C.R.
7.569
P
***
.099
.076
9.354
6.344
***
***
.149
.161
8.824
9.289
***
***
.077
.067
10.527
10.164
***
***
.069
.074
.098
14.924
12.877
13.515
***
***
***
.105
4.790
***
.130
.130
11.922
11.866
***
***
.100
.105
.140
10.808
10.469
6.334
***
***
***
.084
.054
.084
12.465
18.839
12.197
***
***
***
500
Furthermore, Table 2 shows the result of calculations on the goodness of fit criteria in the AMOS 19
program. It indicated that confirmatory factor analysis and structural equation modeling in this study
could be accepted according to the model fit (Table 2). Based on this fit model, the hypotheses proposed
in this study could be examined.
Table 2
Goodness o Fit Index
Goodness of Fit Index
Chi-Square
Probability
CMIN/DF
GFI
AGFI
TLI
CFI
RMSEA
Cut-off Value
P=5% df=98 Chi-Square 124.342
0.05
2.00
0.90
0.90
0.95
0.95
0.08
Results
573.675
0.000
5.845
0.781
0.696
0.762
0.806
0.140
Evaluation
Marginal
Marginal
Marginal
Marginal
Marginal
Marginal
Marginal
Marginal
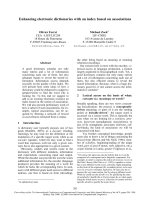
The overall model feasibility test was carried out using the Structural Equation Model (SEM) analysis,
which was also used to analyze the proposed hypotheses (Ghozali, 2004). The results of testing the
model through SEM are as shown in Fig. 2 as follows:
.54
eu1
er1
.73
UIS3
.54
eu4
.74
UIS4
.88
Kn&In-UIS
.70
.49
eu5
UIS5
.94
.59
eu7
UIS7
.77
.77
eu8
UIS8
eu9
UIS9
eu10
UIS10
.65
.81
.93
QIP-UIS
er6
UIS
.84
.70
ee1
er3
UIS6
E1
.82
.20
.95
OverallQuality
.71
.92
.84
.84
SQ4
SQ14
ISServqual
.58
es16
SQ16
es17
SQ17
es18
SQ18
.74
.54
.68
.76
er5
1.06
1.12
.50
.77
Rel-SQ
.46
es14
.70
.88
er4
.85
SQ3
.88
.78
es4
UserSatisfaction
SQ1
.69
er9
.90
.00
.47
es3
E2
er8
UIS11
.72
.50
.88 .71
AESS-UIS
.95
es1
ee2
.78
.45
.36
.60
eu11
.67
.87
.91
eu6
er2
.88
er7
Emp-SQ
.44
.19
Fig. 2. Results of Analysis Using SEM
E3
E4
ee3
ee4
Y. Wismantoro et al. /Uncertain Supply Chain Management 8 (2020)
4.
501
Discussion
From the analysis results, a positive and significant relationship was found between the quality of
information system services and user satisfaction. From these results, it can be seen that a successful
information system is not enough only to provide adequate hardware, software, or networks (Blank,
2014; O, Malley, 2014; Shao, 2016; Escrig, 2018). Users will not be satisfied with only being provided
with the most sophisticated software, hardware, or networks, without getting an adequate quality of
service. In this case, the role of the information system officer is crucial in providing adequate quality
of service (Gupta et al., 2019).
In terms of service quality, from the model, the overall quality of the service information systems, which
was measured through the UIS variable and the IS SERVQUAL variable, can be seen. From the
analysis, it can be seen that hypothesis six, namely user information satisfaction, did not affect the
quality of information system services (overall quality). As for hypothesis seven, IS SERVQUAL
affected the quality of information system services (overall quality) positively and significantly. It
shows that the factors contained in the variable UIS (knowledge and involvement, quality of
information products, and attitudes of service personnel) did not affect the overall quality of
information system services (overall quality). Meanwhile, the IS SERVQUAL variable was positively
and significantly proven to affect the overall quality of information system services.
The UIS variable was actually measured through the variables of knowledge and involvement, the
quality of information products, and the attitude of officers in providing services. Regardless of the
UIS variable was not significant and did not affect overall service quality, it is essential to note that of
three variables, only the variables quality of information products and the attitude of officers which
served positively and significantly affected the UIS variable.
Besides the UIS variable, overall service quality was measured through the IS SERVQUAL variable.
The IS SERVQUAL variable consisted of two measurement variables, namely reliability and empathy.
However, the reliability variable proved to affect the IS SERVQUAL variable significantly. Thus, it
made the factor of empathy played an essential role in the overall quality of information system
services. In providing services, information services, information system officers are expected to offer
more personal and adequate service. It will greatly affect user satisfaction. Users can realize that the
information systems are not machines that can work continuously without interruption and can meet
all the user's information needs. However, by empathizing with the user’s need and being able to
understand the importance of the information system in the user’s daily activities, the information
system officer can provide the best service and satisfy the information system user.
Empirically, the results of the study are indeed in accordance with existing conditions in batik and
textile artisans in Klaten. The majority of information systems users were not people who had good
knowledge of information systems. Generally, they used information systems to enter data (data entry).
They did not know the product system outside the system they used every day. They also did not feel
the need to be involved or have knowledge about of information systems. They generally also did not
really care about the quality of the information available. These factors might cause the UIS variable
not to affect the quality of information system services significantly. Cultural factors that are not too
demanding in Javanese society might cause the reliability factor to be insignificant. They generally
could accept and assumed that it was natural if there was a delay regarding services. It was considered
reasonable and was something that could be tolerated. It is different from Western societies, which
demand more punctuality. Whereas, the empathy factor was one thing considered important in Javanese
culture, so it caused the empathy factor to be crucial in service quality.
As for the differences in the results of this study with previous research, there have been theories that
can explain this phenomenon. Several studies show that the exploration results of the use of information
502
systems indicating that several dimensions of IT users and performance in different approaches will
produce unequal levels of acceptance (Jia et al., 2018).
Starting from Kettinger et al. (1995), they conducted a study to prove that the SERVQUAL information
system (IS SERVQUAL) is a valid instrument for measuring the quality of information system services.
They researched in four countries, namely the United States, the Netherlands, Korea, and Hong Kong.
The results of research in Hong Kong and Korea showed that the model studied was not fit. Whereas,
in the Netherlands revealed a marginal fit. They found that a valid and reliable research design in the
United States (USA) was not valid to be used in all countries. There is one factor, called the “Asian
Factor”, which was suspected as a distinguishing factor from the “Western Factor”. Possible reasons
are cultural differences in the maturity and/or evolution of information systems (Au et al., 2008;
Canevello, 2010; Jia, 2018).
5. Conclusion
The results of this study support the research of Kettinger and Lee (1994,1995,1997,1999) that the
empathy dimension had a vital position in Asia. In contrast, the reliability dimension had no or less
effect. The dimensions mentioned above also explained why the factors of knowledge and involvement
were also less influential in this study. The results of this study raised the suspicion that there were still
other factors influencing the quality of information system services that have not been covered in this
study. These factors may be more specific and local, according to the situation in Indonesia. In addition,
it increases the opportunities for further researchers to conduct exploratory factor analysis research on
these factors. Kettinger and Lee (1999) also suggested that the development of local versions of
measurement instruments could be studied to cover the natural conditions of perceptions of information
systems services abroad.
Acknowledgment
This research is a National Strategic Competitive Grant Research (STRANAS), number
085/A.38.04/UDN-09/IV/2019 Ristekdikti in the 2019 fiscal year.
References
Agrebi, S., & Jallais, J. (2015). Explain the intention to use smartphones for mobile shopping. Journal
of retailing and consumer services, 22, 16-23.
Ardiansah, M. N., Chariri, A., Rahardja, S., & Udin, U. (2020). The effect of electronic payments
security on e-commerce consumer perception: An extended model of technology acceptance.
Management Science Letters, 10(7), 1473-1480.
Au, N., Ngai, E.W.T., & Cheng, T.C.E. (2008). Extending the understanding of end user information
systems satisfaction formation: an equitable needs fulfillment model approach. MIS Quarterly,
32(1), 43-66.
Aryanto, V.D.W., Wismantoro, Y., & Widyatmoko, K. (2018). Implementing eco-innovation by using
internet to enhance firm’s marketing performance: Study of green batik small and medium
enterprises. International Journal of e-Business Research, 1(8), 10-28.
Babacus, E. & Mangold, W. G. (1992). Adapting The Servqual Scale to Hospital Services: An
Empirical Investigation. Health Science Research
Becker, L.C., & Pizzutti, C. (2017). C2C value creation: social anxiety and retail environment. Journal
of Research in Interactive Marketing, 11(4), 398-415.
Burns, J. M., Couger, D., Ma, L. (1992). Motivating IT Profesionals: The Hong Kong Chalange.
Information & Management.
Canevello, A., & Crocker, J. (2010), Creating good relationships: responsiveness, relationship quality,
and interpersonal goals. Journal of Personality and Social Psychology, 99(1), 78-106.
Y. Wismantoro et al. /Uncertain Supply Chain Management 8 (2020)
503
Carr, C. L. (2002). A psychometric evaluation of the expectations, perceptions, and difference‐scores
generated by the IS‐adapted SERVQUAL instrument. Decision Sciences, 33(2), 281-296.
Chrisanthi, A. (2000). IT and organizational change: an institutionalist perspective. Information
Technology & People, 13(4), 234 – 262.
Cheung, F. Y. M., & To, W. M. (2016). A customer-dominant logic on service recovery and customer
satisfaction. Management Decision, 54(10), 2524-2543.
Delone, W. H., & McLean, E. R. (2003). The DeLone and McLean model of information systems
success: a ten-year update. Journal of Management Information Systems, 19(4), 9-30.
Faqih, K. M., & Jaradat, M. I. R. M. (2015). Assessing the moderating effect of gender differences and
individualism-collectivism at individual-level on the adoption of mobile commerce technology:
TAM3 perspective. Journal of Retailing and Consumer Services, 22, 37-52.
Fawcett, S. E., Wallin, C., Allred, C., Fawcett, A. M., & Magnan, G. M. (2011). Information technology
as an enabler of supply chain collaboration: a dynamic‐capabilities perspective. Journal of Supply
Chain Management, 47(1), 38-59.
Ferdinand, A. (2002). Structural equation modeling dalam penelitian manajemen. Semarang: Badan
Penerbit Universitas Diponegoro.
Gandhi, S. K. (2016). India's Jumbo Jump from E-Commerce to Mobile Enabled Services (MES): A
Review. Productivity, 56(4), 326-331.
Ghozali, I. (2004), Model Persamaan Struktural: Konsep & Aplikasi Dengan Program AMOS 16.0.
Badan Penerbit Universitas Diponegoro Semarang
Grönroos, C. (1991). The marketing strategy continuum: towards a marketing concept for the
1990s. Management Decision, 29(1). />Groß, M. (2015). Mobile shopping: a classification framework and literature review. International
Journal of Retail & Distribution Management, 43(3), 221-241.
Gupta, A., & Arora, N. (2017). Understanding determinants and barriers of mobile shopping adoption
using behavioral reasoning theory. Journal of Retailing and Consumer Services, 36, 1-7.
Hair, J. F., Black, W. C., Babin, B. J., Anderson, R. E., & Tatham, R. L. (1998). Multivariate data
analysis (Vol. 5, No. 3, pp. 207-219). Upper Saddle River, NJ: Prentice hall.
Hoda, R., & Murugesan, L. K. (2016). Multi-level agile project management challenges: A selforganizing team perspective. Journal of Systems and Software, 117(1), 245-257.
Hoda, R., Salleh, N., Grundy, J., & Tee, H. M. (2017). Systematic literature reviews in agile software
development: A tertiary study. Information and Software Technology, 85, 60-70.
Hummel, M., & Epp, A. (2015, January). Success factors of agile information systems development:
A qualitative study. In 2015 48th Hawaii International Conference on System Sciences (pp. 50455054). IEEE.
Ives, B., Olson, M. H., & Baroudi, J. J. (1983). The measurement of user information
satisfaction. Communications of the ACM, 26(10), 785-793.
Jia, L., Hall, D., Yan, Z., Liu, J., & Byrd, T. (2018). The impact of relationship between IT staff and
users on employee outcomes of IT users. Information Technology & People.
Kaplan, J. G. (1991). Effectiveness, Accountability, And Efficiency (Medical Care Management
Information System). Physician Executive
Kanaanm, E. (2017). (2017). A shifting landscape. Criteo, New York, NY, available at:
www.criteo.com/ media/6443/criteo-digital-commerce-marketing-trends-2017.pdf
Kettinger, W. J., & Lee, C. C. (1994). Perceived service quality and user satisfaction with the
information services function. Decision Sciences, 25(5‐6), 737-766.
Kettinger, W. J., Lee, C. C., & Lee, S. (1995). Global measures of information service quality: a cross‐
national study. Decision Sciences, 26(5), 569-588.
Kettinger, W. J., & Lee, C. C. (1997). Pragmatic perspectives on the measurement of information
systems service quality. MIS Quarterly, 21(2), 223-240.
Kettinger, W. J., & Lee, C. C. (1999). Replication of measures in information systems research: the
case of IS SERVQUAL. Decision Sciences, 30(3), 893-899.
504
Lee, J. (2007). Servqual vs Servperf: round 2 in a multi-cultural setting. Journal of Academy of
Bussiness and Economics, 7(3), 77-87.
Vargo, S. L., & Lusch, R. F. (2014). Service-dominant logic: What it is, what it is not, what it might
be. In The service-dominant logic of marketing (pp. 61-74). Routledge.
Mcleod Jr, R. (1995). Management Information System A Study of Computer-Based Information
System 6 th, edition Prentice-Hall inc. New Jersey.
Myerscough, M. (2002). Information systems quality assessment: REPLICATING Kettinger and Lees
USISF/SERVQUAL combination. AMCIS 2002 Proceedings, 153.
O’Brien, J. A. (1999). Management Information System: Managing Information Technology in the
Internetworhed Enterprise, United States: Irwin Mc.
Parasuraman, A., Zeithaml, V. A., & Berry, L. L. (1988). SERVQUAL: A multiple–item scale for
measuring consumer perceptions of Service quality. Journal of Retailing, 64(1).
Pitt, L. F., Watson, R. T., & Kavan, C. B. (1995). Service quality: a measure of information systems
effectiveness. MIS quarterly, 173-187.
Putri, E. R., Udin, & Djastuti, I. (2019). Structural empowerment and service-oriented organizational
citizenship behavior: The mediating roles of innovativeness and job satisfaction. Quality-Access to
Success, 20(170), 112-117.
Sekaran, U. (2006). Research Methods For Business. 4th ed., Wiley.
Senthil, T.N., Dharun, A.B., & Kasilingam, L. (2017). Understanding the intention to use mobile
shopping applications and its influence on price sensitivity. Journal of Retailing and Consumer
Services, 37, 8-22.
Soliha, E., Basiya, R., Rochmani, R., Darmawan, A. D., & Udin, U. (2019). The effect of product
quality and customer value on satisfaction and loyalty. Transylvanian Review, 27(45), 13052-13057.
Gupta, S., Kumar, S., Kamboj, S., Bhushan, B., & Luo, Z. (2019). Impact of IS agility and HR systems
on job satisfaction: an organizational information processing theory perspective. Journal of
Knowledge Management.
Maguire, S. (2000). Towards a “business‐led” approach to information systems
development. Information Management & Computer Security, 8(5), 230 – 238
Van Dyke, T. P., Kappelman, L. A., & Prybutok, V. R. (1997). Measuring information systems service
quality: concerns on the use of the SERVQUAL questionnaire. MIS quarterly, 195-208.
Van Dyke, T. P., Prybutok, V. R., & Kappelman, L. A. (1999). Cautions on the use of the SERVQUAL
measure to assess the quality of information systems services. Decision sciences, 30(3), 877-891.
Wong, C. H., Lee, H. S., Chua, B. H., Chai, B. H., & Tan Han, G. W. (2012). Predicting the consumers'
intention to adopt mobile shopping: an emerging market perspective. International Journal of
Network and Mobile Technologies, 3(3), 24-39.
Wu, P. L., Yeh, S. S., & Woodside, A. G. (2014). Applying complexity theory to deepen service
dominant logic: Configural analysis of customer experience-and-outcome assessments of
professional services for personal transformations. Journal of Business Research, 67(8), 1647-1670.
© 2020 by the authors; licensee Growing Science, Canada. This is an open access
article distributed under the terms and conditions of the Creative Commons Attribution
(CC-BY) license ( />