Redundancy and metabolic function of the glutamine synthetase gene family in poplar
Bạn đang xem bản rút gọn của tài liệu. Xem và tải ngay bản đầy đủ của tài liệu tại đây (2.13 MB, 14 trang )
Castro-Rodríguez et al. BMC Plant Biology (2015) 15:20
DOI 10.1186/s12870-014-0365-5
RESEARCH ARTICLE
Open Access
Redundancy and metabolic function of the
glutamine synthetase gene family in poplar
Vanessa Castro-Rodríguez, Angel García-Gutiérrez, Rafael A Cañas, Ma Belén Pascual, Concepción Avila
and Francisco M Cánovas*
Abstract
Background: Glutamine synthetase (GS; EC: 6.3.1.2, L-glutamate: ammonia ligase ADP-forming) is a key enzyme in
ammonium assimilation and metabolism in higher plants. In poplar, the GS family is organized in 4 groups of
duplicated genes, 3 of which code for cytosolic GS isoforms (GS1.1, GS1.2 and GS1.3) and one group that codes for the
choroplastic GS isoform (GS2). Our previous work suggested that GS duplicates may have been retained to increase the
amount of enzyme in a particular cell type.
Results: The current study was conducted to test this hypothesis by developing a more comprehensive understanding
of the molecular and biochemical characteristics of the poplar GS isoenzymes and by determinating their kinetic
parameters. To obtain further insights into the function of the poplar GS genes, in situ hybridization and laser capture
microdissections were conducted in different tissues, and the precise GS gene spatial expression patterns were
determined in specific cell/tissue types of the leaves, stems and roots. The molecular and functional analysis of the
poplar GS family and the precise localization of the corresponding mRNA in different cell types strongly suggest that
the GS isoforms play non-redundant roles in poplar tree biology. Furthermore, our results support the proposal that a
function of the duplicated genes in specific cell/tissue types is to increase the abundance of the enzymes.
Conclusion: Taken together, our results reveal that there is no redundancy in the poplar GS family at the whole plant
level but it exists in specific cell types where the two duplicated genes are expressed and their gene expression
products have similar metabolic roles. Gene redundancy may contribute to the homeostasis of nitrogen metabolism in
functions associated with changes in environmental conditions and developmental stages.
Keywords: Populus, Gene family, Gene duplication, Glutamine, Ammonium assimilation
Background
Woody plants constitute one of the most important economic and ecological resources on Earth. The forest
ecosystems play an important role in the production of
the world’s biomass. Therefore, they are a necessary factor
that must be considered when addressing climate change
and the maintenance of biological diversity. Trees are an
inestimable resource in various industries such as wood,
pulp, paper, biofuel and other useful material of commercial importance [1]. The molecular biology of trees is a
field that is experiencing extraordinary advances especially because different genomic and transcriptomic projects are providing a huge amount of valuable information
* Correspondence:
Departamento de Biología Molecular y Bioquímica, Facultad de Ciencias,
Campus Universitario de Teatinos, Universidad de Málaga, 29071 Málaga,
Spain
to understand the molecular basis underlying the physiological regulation of gene expression.
Nitrogen metabolism is a fundamental area of research
in plant biology. Nitrogen, a constitutive element of amino
acids and nucleotides, is a limiting factor in the growth and
development of land plants and constitutes a true challenge for their survival [2]. Terrestrial plants have evolved
metabolic pathways to assimilate and distribute nitrogen
for the biosynthesis of a wide range of molecules. Nitrogen
is both essential and limiting, and plants have developed
systems to guarantee its economy such as the glutamine
synthetase (GS)/glutamate synthase (GOGAT) cycle [3].
The enzyme GS (EC: 6.3.1.2) synthesizes glutamine incorporating ammonium to glutamate in the presence of
ATP, while GOGAT (EC: 1.4.7.1) generates glutamate by
transferring the amide group of glutamine to αketoglutarate. The amino acids glutamine and glutamate
© 2015 Castro-Rodriguez et al.; licensee BioMed Central. This is an Open Access article distributed under the terms of the
Creative Commons Attribution License ( which permits unrestricted use,
distribution, and reproduction in any medium, provided the original work is properly credited. The Creative Commons Public
Domain Dedication waiver ( applies to the data made available in this
article, unless otherwise stated.
Castro-Rodríguez et al. BMC Plant Biology (2015) 15:20
are the main nitrogen donors for the biosynthesis of a
wide variety of nitrogenous compounds. X-ray crystallography of maize ZmGS1a [4] and Medicago MtGS1a [5]
demonstrated that plant GS is a decameric enzyme. The
protein is composed of two face-to-face pentameric rings
with active sites located at the interfaces between the Nterminal and C-terminal domains of two neighboring subunits within a pentameric ring, which results in a total of
10 active sites per GS decamer [4].
Plants have also developed systems for ammonium
reassimilation from secondary sources to avoid losing
biological nitrogen. During photorespiration the mitochondrial decarboxylation of glycine generate important
quantities of ammonium, which are then incorporated
to carbon skeletons in the chloroplast through the GS/
GOGAT cycle [6]. These metabolic activities are combined because of the strict spatial association of mitochondria, peroxisome and chloroplast, and because they
prevent the toxic accumulation of ammonium and nitrogen loss [7]. Even though lignin, a polymeric compound
especially important in woody plants, does not contain
nitrogen, phenylalanine metabolism is required to channel photosynthesis-derived carbon to phenylpropanoid
biosynthesis. The ammonium released in the reaction
catalyzed by phenylalanine ammonia lyase is recycled by
the GS/GOGAT cycle, which allows it to be reincorporated into the continuous synthesis of phenylalanine,
and consequently lignin and other phenolic compounds
[8,9]. Furthermore, GS is also expressed in different
physiological situations such as pathogen attack [10,11]
or senescence [12].
In plants, cytosolic (GS1) and chloroplastic (GS2)
glutamine synthetase isoenzymes have been identified
and are found in different intracellular locations that
are related to their specialized roles. The chloroplastic
GS2 is coded by a single gene in most plant species and
has been detected in photosynthetic tissues where it assimilates the ammonium released from photorespiration or nitrate/nitrite reduction [13]. Conversely, GS1
is coded by a small gene family which varies in number
among species, and the different isoenzymes are found
in different types of cells and tissues according to their
different physiological functions [14]. GS1 is mainly
found in heterotrophic organs such as roots, seeds,
stems, nodules, flowers and fruits, where it assimilates
the ammonium from the soil, lignin biosynthesis, stress
and senescence [15].
In a previous study [16], it was reported that the GS
gene family in poplar is organized into 4 groups of duplicated genes, 3 of which code for cytosolic GS isoforms
(GS1.1, GS1.2 and GS1.3) and 1 that codes for the chloroplastic GS isoform (GS2). Our previous findings suggested that the GS duplicates may have been retained to
increase the amount of enzyme in particular cell types.
Page 2 of 14
The aim of the current study was to develop a more
comprehensive understanding of the molecular structure,
biochemical properties, and kinetic parameters of GS isoenzymes and to evaluate the cell- and tissue-specific
spatial expression of the individual members of the GS
gene family in poplar. The molecular and functional analysis of the GS family and the precise locations of the corresponding mRNA strongly support that GS isoforms play
non-redundant roles in poplar tree biology. Our results
also support the proposal that the function of the duplicated genes in specific cell types is to increase the
abundance of the enzymes. Therefore, while there is no redundancy in the poplar GS family at the plant level, redundancy does exist in specific cell types that express two
duplicated genes. This gene redundancy may contribute to
maintaining the homeostasis of nitrogen metabolism during processes associated with the changes in glutamine
use in multiple metabolic pathways.
Results
Expression of active poplar GS isoforms
The poplar genome contains 4 groups of duplicated genes
of GS named GS1.1, GS1.2, GS1.3 and GS2, which are
expressed in different organs of the tree [16]. Total intact
RNA was isolated from Populus trichocarpa clone INRA
101–74 and full-length cDNA (FLcDNA) representatives
of GS genes were isolated by RT-PCR using specific
primers (see the Methods section for further information).
The identity of GS cDNAs was confirmed by sequencing
analysis and the corresponding data are presented in
Additional file 1. Constructs of His-tag fusion proteins
for GS1.1 (PtGS1.1-710678), GS1.2 (PtGS1.2-819912,
PtGS1.2-716066), GS1.3 (PtGS1.3-834185), GS2 (PtGS2725763) were expressed in Escherichia coli (Additional
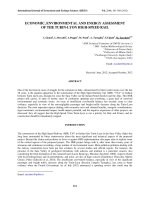
file 2: Table S1 and Figure 1a). All poplar GS isoforms
were active in bacteria and the specific activities observed
varied among the different isoforms, with higher values
for GS1 isoforms than for GS2 (Figure 1b, upper panel).
The western blot analysis of the bacterial protein extracts
demonstrated a parallel accumulation of plant GS polypeptides (Figure 1b, lower panel). Poplar GS1.1, GS1.2,
GS1.3 and GS2 holoenzymes were purified to homogeneity by affinity chromatography (Figure 1c). These highly
purified enzyme preparations were used for molecular and
kinetic analysis.
Molecular size of poplar GS isoforms
The molecular sizes of the poplar GS polypeptides are
shown in Table 1. The predicted values derived from
the poplar genome sequence (JGI) were compared with
the values derived from cDNA sequencing of the individual FLcDNA (PtGS1.1-710678, PtGS1.2-819912/
PtGS1.2-716066, PtGS1.3-834185 and PtGS2-725763)
and with the experimental values determined by mass
Castro-Rodríguez et al. BMC Plant Biology (2015) 15:20
Page 3 of 14
Figure 1 Recombinant overproduction of poplar glutamine synthetases. a) Schematic representation of constructs made with Populus
trichocharpa FLcDNA from N- (left) to C-(right) terminals. White rectangle: FLcDNA; black rectangle: His-tag. b) Expression of poplar GS2, GS1.1,
GS1.2 and GS1.3 isoenzymes in E. coli. Levels of GS activity for each isoenzyme are shown in the upper part of the Figure. The maximum level
(100%) of activity was 67 nkatals. Values are the mean ± SD of at least three independent determinations. Immunoblot of the same protein
extracts is shown in the lower part of the Figure. c) Electrophoretic analysis of the homogenous preparations of poplar GS2, GS1.1, GS1.2 and
GS1.3 isoenzymes. Molecular markers were loaded on the left.
spectrometry analysis of purified preparations of GS1.1,
GS1.2, GS1.3 and GS2 recombinant proteins (MS/MALDI).
The sizes of the GS1 (39–40 kDa) and GS2 (42 kDa) isoforms determined by MS/MALDI were similar to the
values predicted based on the cDNA and JGI (Table 1).
The molecular sizes of the poplar GS holoenzymes were
determined by gel filtration chromatography through a
calibrated column with proteins standards (Figure 2). The
GS2 holoenzyme was observed to be 454 kDa and the estimated sizes of the GS1 holoenzymes ranged from 400 to
Table 1 Molecular sizes of poplar GS polypeptides (kDa)
Polypeptide
Genome(JGI)
cDNA
MS/MALDI
GS2
42.29
42.29
42.17
GS1.1
39.45
39.21
39.97
GS1.2
38.97
38.96
39.98
GS1.3
39.09
39.19
38.95
415 kDa. Considering the sizes of the poplar GS polypeptides determined by mass spectrometry (Table 1), the
resulting values for the GS holoenzymes are compatible
with a decameric structure of the enzyme oligomer.
Catalytic properties of poplar GS isoenzymes
We were interested in determining whether poplar GS
holoenzymes differ in their kinetic parameters against
substrates because this finding would support their potentially different metabolic roles. The kinetic properties
were determined by assaying the biosynthetic GS activity
and the most significant results are presented in Table 2.
The poplar isoforms did not differ in their affinity for
ATP but did demonstrate contrasting kinetic behaviors
for ammonium and glutamate. The GS1.1, GS1.2 and
GS1.3 enzymes had responses to changes in the concentrations of glutamate which did not follow hyperbolic
saturation. The kinetic data were further analyzed using
Castro-Rodríguez et al. BMC Plant Biology (2015) 15:20
Page 4 of 14
Figure 2 Molecular mass estimation of poplar GS holoenzymes. Samples (100 μg) of purified GS2, GS1.1, GS1.2 and GS1.3 native isoenzymes
were subjected to Sephacryl S-300 chromatography. The molecular masses were calculated by comparison of the partition coefficient (Kav) of the
GS isoenzymes with proteins of known molecular size. The protein standars used to calibrate the column were: Thyroglobulin (669 kDa),
Apoferritin (443 kDa), β-Amylase (200 kDa), Alcohol Dehydrogenase (150 kDa), Albumin (66 kDa) and Carbonic Anhydrase (29 kDa).
Lineweaver-Burk and Hill plots which indicated the existence of negative cooperativity (Table 2). In contrast, GS2
demonstrated a typical Michaelis-Menten saturation curve
for glutamate with a Km value of 26 mM and sigmoidal
kinetics against ammonium with calculated parameters of
nH = 1.7; S0.5 = 0.3. The kinetic analysis also revealed that
the poplar cytosolic isoforms of GS exhibited a high affinity for ammonium, particularly GS1.1 with an extremely
low Km value (5 μM). Because the final preparations of the
enzymes were homogenous and the molecular masses
were previously determined (Table 1), it was possible to
determine the corresponding catalytic (Kcat) and specificity
Table 2 Kinetic parameters of poplar GS recombinant
enzymes
GS1.1
Ammonium
Glutamate
ATP
Km = 5 μM
Negative cooperativity
Km = 1.4 mM
nH = 0.6
Kcat/ Km = 1.2 x10⁷ a
GS1.2
819912
Km = 200 mM
Negative cooperativity
Km = 0.9 mM
716066
Km = 190 mM
nH = 0.6
Km = 1.0 mM
Negative cooperativity
Km = 1.0 mM
6 a
Kcat/ Km = 0.8 x10
GS1.3
Km = 110 μM
nH = 0.6
Kcat/ Km = 1.1 x10⁶ a
GS2
Positive cooperativity
Km = 26 mM
nH = 1.7; S0.5 = 0.3
The biosynthetic assay was used [39,40].
a −1 −1
M s .
Km = 0.7 mM
constants (Kcat/Km) for ammonium and are also presented in Table 2. The specificity constant for GS1.1
(1.2 × 10⁷ M−1 s−1) is within a range that is typical of a very
efficient catalytic and specific enzyme [17]. In a previous
paper [16] we proposed that duplicated genes in poplar
may play redundant roles in nitrogen metabolism. If this
hypothesis is correct the isoforms encoded by the duplicated genes should have similar metabolic roles, and
consequently similar kinetics. To test this hypothesis we
recombinantly expressed and characterized the enzymes
encoded by the PtGS1.2 duplicated genes (PtGS1.2-819912;
PtGS1.2-716066). The observed kinetic parameters for both
expression products were nearly identical (Table 2).
Optimal temperature and pH of poplar GS enzymes
The effect of temperature on the activity of the recombinant GS isoforms was examined (Figure 3a). The profiles of
the three cytosolic isoforms were quite similar with sustained increases in enzyme activity in response to increases
in temperature until a maximum level was reached. However, the profile for GS2 did not demonstrate similar sustained increases in GS activity. The following activation
energies were calculated for the cytosolic and chloroplastic
GS isoforms: −57.9 kJ mol−1 for GS1.1, −41.9 kJ mol−1 for
GS1.2, −50.4 kJ mol−1 for GS1.3 and −107.4 kJ mol−1 for
GS2 (Additional file 3: Figure S1). Consistent with the observed profiles, similar values were found for GS1.1, GS1.2
and GS1.3, and GS2 exhibited much higher activation energy. GS1.2 and GS1.3 demonstrated maximal activity at
50°C. In contrast, the optimal temperature for GS1.1 was
37°C, which is similar to the observed value for GS2. Poplar GS isoforms were active at a wide range of pH levels,
Castro-Rodríguez et al. BMC Plant Biology (2015) 15:20
Page 5 of 14
Figure 3 Effect of temperature and pH in the activity of poplar GS holoenzymes. a) The activity of purified native isoenzymes were
determined at different temperatures from 10°C to 70°C. The maximum level (100%) of activities for GS1.1, GS1.2, GS1.3 and GS2 were 23 nkatal,
65 nkatal, 50 nkatal and 34 nkatal, respectively. Values are the mean ± SD of at least three independent determinations. b) The activity of purified
native isoenzymes were determined at different pH values. The maximum level (100%) of activity for GS1.1, GS1.2, GS1.3 and GS2 were 38 nkatal,
56 nkatal, 48 nkatal and 25 nkatal, respectively. The following buffers were used: ◆ Acetate (4.5 ), ∎ Mes (5.5-6.5 ), ▲ MOPS (6.6-8), ● Tris (8–9),
□ Sodium carbonate (10). Values are the mean ± SD of at least three independent determinations.
Castro-Rodríguez et al. BMC Plant Biology (2015) 15:20
from 5.0 to 9.0 (Figure 3b). The cytosolic enzymes GS1.2
and GS1.3 demonstrated maximal activity at a pH 6.0-6.5
In contrast, the optimal pH for GS1.1 and the GS2
was 7.5.
Stability of poplar GS isoforms
To further examine the differences in the poplar isoforms as molecular catalysts the heat stabilities of GS1.1,
GS1.2, GS1.3 and GS2 were examined (Figure 4). All enzymes were stable at 37°C, the temperature of the enzymatic assay. The cytosolic enzymes GS1.2 and GS1.3
exhibited a certain degree of thermal stability. They
retained more than 50% of their activity when incubated
at 42°C and were immediately inactivated at higher temperatures. In contrast, GS1.1 was extremely sensitive to
heat, even more sensitive than GS2, and retained only
20% of its activity after 5 min of incubation at 42°C.
Oxidation catalyzed by metals can be used as an indicator of the structural stability of GS enzymes [18]. Therefore, we further examined the tolerance of poplar GS
isoforms to metal-mixed oxidation (Additional file 4:
Figure S2). As observed for temperature stability, GS1.1
was completely inactived after 180 min of metal-oxidation
exposure. In contrast, GS1.2 and GS1.3 were much more
tolerant and retained more than 50% of their initial activity
level after 240 min of treatment. In this context, it is
Page 6 of 14
interesting that the chloroplastic isoform (GS2) was also
sensitive to metal-oxidation (Additional file 4: Figure S2).
Localization of poplar GS transcripts in different cell types
The precise distribution of the GS transcripts in the different cell types of the leaves, stems and roots of poplar was
examined by in situ hybridization (ISH) using specific
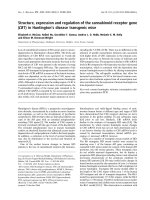
probes (Figure 5). The specific labeling for PtGS2 transcripts was observed in the lamina, external phloem and
parenchyma cells of leaves (Figure 5a). A magnified view
of a leaf blade hybridized with the antisense probe reveals
that PtGS2 mRNA is localized in spongy and palisade cells
and that there is a lack of labeling in the lower and upper
epidermis (Figure 5d). A similar expression pattern was
also observed for the PtGS1.1 transcripts with enhanced signals in the leaf blade (Figure 5c). PtGS1.3
mRNA was highly abundant in the vascular bundles of
stems (Figure 5g). A strong labeling was observed in
phloem cells (Figure 5h). PtGS1.2 transcripts were localized in the cells of the root vascular cylinder (Figure 5j
and k). The specificity of the ISH was confirmed by an absence of signal in the target tissues probed with the sense
probes for PtGS2 (Figure 5b and e), PtGS1.1 (Figure 5f),
PtGS1.3 (Figure 5i) and PtGS1.2 (Figure 5l). In a previous
paper [16] we proposed that duplicated genes expressed
in the same cell types of poplar may play redundant
roles in nitrogen metabolism. To test this hypothesis,
Figure 4 Thermal stability of poplar GS holoenzymes. Samples (50 μg) of purified GS2, GS1.1, GS1.2 and GS1.3 native isoenzymes were
incubated at different temperatures: ◆ 37°C; ∎ 42°C; ▲ 50°C; ● 60°C. At the indicated periods of incubation (0, 5, 10, 15 and 20 min) samples
were removed from the bath and stored on ice until GS activity was determined. The maximum level (100%) of activity for GS1.1, GS1.2, GS1.3
and GS2 was 38 nkatal, 56nkatal, 48 nkatal and 25 nkatal, respectively. Values are the mean ± SD of at least three independent determinations.
Castro-Rodríguez et al. BMC Plant Biology (2015) 15:20
Page 7 of 14
Figure 5 Cell-type distribution of poplar GS expression analyzed by in situ hybridization. Cross-sections (10 mm thick) of different poplar
organs were subjected to in situ hybridization analysis using RNA probes. Leaves: PtGS2 (a, d) and PtGS1.1 (c) antisense; PtGS2 (b, e) and PtGS1.1
(f) sense. Stem: PtGS1.3 (g, h) antisense; PtGS1.3 (i), sense. Root: PtGS1.2 (j, k) antisense; PtGS1.2 (l) sense probe.
we performed simultaneous ISH analyses of the two duplicate PtGS1.3 genes (PtGS1.3-834185 and PtGS1.3827781), and the results obtained revealed that these
genes displayed identical spatial expression patterns.
ISH is a powerful technique for studying the spatial
expression patterns of genes in plants but the ability to
reliably quantify gene expression levels by ISH is quite
limited. We were interested in comparing the relative
expression levels of each pair of duplicated poplar genes
in the specific cell types to complement the results from
the ISH analyses and to investigate the roles of the GS
family members in poplar ammonium assimilation. To
overcome this limitation, we have developed protocols
for the Laser Capture Microdissection (LCM) of poplar
tissue sections. Total RNA was isolated from LCM samples, and the expression levels of the entire GS gene
family were analyzed by real-time qPCR (Figure 6). The
maximum level of PtGS1.1 expression was observed in
the leaf lamina and a decreased level was observed in
the parenchyma cells of the leaf (Figure 6, leaf ). Transcripts for PtGS1.1 duplicates were also found at lower
abundance in the phloem cells and cortical parenchyma
of the stems (Figure 6, stem). PtGS1.2 transcripts were
exclusively detected in the vascular cylinder of the root
(Figure 6, root). PtGS1.3 demonstrated the highest levels
of gene expression in the LCM samples taken from the
Castro-Rodríguez et al. BMC Plant Biology (2015) 15:20
Page 8 of 14
Figure 6 Cell and tissue distribution of poplar GS expression examined by LCM and qPCR analysis. Tissue sections from poplar leaves,
stems and roots were processed for LCM and total RNA isolated as described in Methods. Three independent biological replicates were
processed. The expression levels of duplicated genes PtGS2, PtGS1.1, PtGS1.2 and PtGS1.3 were determined by qPCR using oligonucleotide primers
designed to amplify the transcripts encoded by each pair of genes [16]. Leaf: L, Lamina; V, vascular cells; P, parenchyma. Stem: P, pith; X, xylem;
F, phloem; CP cortical parenchyma, Root: CR, cortical root; VC, vascular cylinder. Higher magnification shows the presence of numerous plastids in
the cortical cells. Each value represents the mean ± SD of 3 biological replicates. Statistics analysis were performed by Anova and the significative
diferences were calculated by Tukey’s t test (p < 0.01).
leaf and stem and was only detected at low levels in the
root (Figure 6). In the leaf, PtGS1.3 transcripts were exclusively detected in the vascular bundles, but in the
stem, PtGS1.3 transcripts were abundant in all of the cell
types examined, with higher levels in the phloem and
xylem (Figure 6, stem). A maximum level of PtGS2 expression was observed in the parenchyma cells of the
leaf with a lower level observed in the vascular bundles
(Figure 6, leaf ). Decreased levels of PtGS2 transcripts
were also found in the pith and cortical parenchyma of
the stems (Figure 6, stems). Similar levels of PtGS2 transcripts were also detected in the cortical parenchyma of
the root, where a high abundance of amyloplasts was
evident (Figure 6, root inset). It is interesting that the expression profiles of PtGS1.1 and PtGS2 in the leaf were
complementary with maximum expression levels of
PtGS1.1 in the lamina and maximum expression levels
of PtGS2 in parenchyma cells.
Nitrogen regulation of poplar GS expression
To further investigate the functional properties of GS1.1
in the poplar leaves the expression patterns of the entire
gene family of duplicated genes were examined under conditions of adequate (10 mM) and low (0.3 mM) nitrate
availability. As Table 3 shows, PtGS1.1 was predominantly
expressed in both young and mature leaves at low nitrogen. Interestingly, the PtGS1.1 transcripts were particularly abundant in the young leaves. Under conditions of
adequate nitrogen nutrition, PtGS2 transcripts were the
most abundant in young leaves, and PtGS1.1 was the predominant gene expressed in mature leaves.
Discussion
The evolution of gene families for enzymes should be
considered in the context of the metabolic and regulatory networks of the organism and the environment it
inhabits.
Castro-Rodríguez et al. BMC Plant Biology (2015) 15:20
Page 9 of 14
Table 3 Regulation of the poplar GS gene family by nitrogen availability
Low nitrogen
Adequate nitrogen
Gene
Young leaves
Mature leaves
Young leaves
Mature leaves
PtGS1.1
2.71 ± 0.15
0.56 ± 0.05
0.06 ± 0.01
0.38 ± 0.02
PtGS1.2
0.19 ± 0.09
0.03 ± 0.00
0.08 ± 0.02
0.05 ± 0.01
PtGS1.3
0.82 ± 0.40
0.22 ± 0.02
0.32 ± 0.24
0.18 ± 0.01
PtGS2
0.28 ± 0.03
0.10 ± 0.00
1.82 ± 0.21
0.07 ± 0.00
Expression levels of poplar GS genes in young and mature leaves under low (0.3 mM) and adequate (10 mM) supply of nitrate.
In poplar, the GS gene family consists of 3 groups of
duplicated genes for GS1 (GS1.1, GS1.2 and GS1.3) and
1 duplicated gene for GS2 [16]. A microsynteny analysis
of the genomic regions where the GS genes are located
suggested that the origin of the duplicated genes was a
whole genome-wide duplication (WGD) event that occurred approximately 65 millions year ago and is still detectable over approximately 92% of the poplar genome
[19]. The structure of each pair of Populus duplicated
GS genes is well conserved in both the coding and regulatory regions, and they demonstrate identical spatial
and seasonal gene expression patterns [16].
In the first part of this study, we isolated Populus
trichocarpa GS FLcDNA, produced recombinant poplar
isoenzymes in bacteria, and conducted a comparative
analysis of their structural and kinetic properties. The
aim was to highlight the physiological roles of each isoenzyme according to the previously determined differential expression profile of the duplicated GS genes. The
FLcDNA for GS1.1 (PtGS1.1-710678), GS1.2 (PtGS1.2819912; PtGS1.2-716066), GS1.3 (PtGS1.3-834185) and
GS2 (PtGS2-725763) were expressed in E. coli to overproduce recombinant isoenzymes. All poplar GS isoforms were active in bacteria, which is consistent with
results previously described for other GS holoenzymes
[20-22], and the observed specific activity levels varied
among the different isoforms, with much higher values
for the GS1 isoforms than for GS2 (Figure 1). Note that
for GS1.2, both of the duplicated genes were produced
in E. coli for a detailed evaluation of the molecular and
kinetic characteristics of both expression products. This
analysis was of particular interest considering that isoforms catalyzing the same metabolic reaction are present
in the same cell types.
The amounts of available recombinant proteins were
sufficient for estimating the molecular sizes of holoenzymes and accurately determining the molecular masses
of the poplar GS polypeptides by mass spectrometry analysis. The resulting values (Table 1) are compatible with a
decameric structure of the enzyme oligomer, which was
previously reported for the cytosolic GS holoenzymes in
maize [4] and Medicago [5]. The recombinant expression
of poplar GS genes also provided a good source of unlimited amounts of the isoenzymes for the comparative
analysis of their biochemical properties. The cytosolic enzymes GS1.2 and GS1.3 exhibited maximal activity levels
at high temperatures (50°C) and slightly acidic pH (6.06.5). In contrast, the optimal temperature and pH for
GS1.1 activity was much lower and closer to GS2. In regard to stability, the cytosolic enzymes GS1.2 and GS1.3
were much more tolerant to thermal inactivation and
metal-catalyzed oxidation than GS1.1. Again, the biochemical behavior of GS1.1 was similar to GS2. Previous
studies have reported that cytosolic are generally more
stable proteins than chloroplastic isoenzymes [23]. Taken
together these results indicate that GS1.1 differs from the
other poplar cytosolic GS exhibiting an unusually low conformational stability, which is a molecular feature usually
characteristic of chloroplastic isoenzymes. It is tempting
to speculate that this finding may be related to the possible roles of GS in different environmental conditions or
developmental stages.
To understand the correlation between the molecular
characteristics and physiological functions, the catalytic
properties of the enzymes were examined. According to
the kinetic data (Table 2), the turnover number is much
smaller for GS2 than for GS1 isoenzymes, which implies
that it has a slower production rate of glutamine. The
specific positive cooperativity of GS2 for ammonium,
however, demonstrates that this enzyme is able to rapidly respond to changes in the ammonium availability in
the plastid. Cytosolic GS exhibited negative cooperativity
for glutamate as previously observed for the pine GS1b
enzyme [21]. This kinetic behavior serves to insulate an
enzyme from the effects of changes in substrate concentration [24]. Consequently, GS1.1, GS1.2 and GS1.3
would provide a constant flux of glutamine independently of fluctuations in the celular levels of glutamate.
Overall, poplar cytosolic enzymes exhibited similar kinetic characteristics except in their ammonium affinity.
Studies in Arabidopsis thaliana have shown that the
presence of glutamine at residue 49 and serine at residue
174 is related to the high affinity ammonium properties
of two GS1 isozymes and that the presence of lysine and
alanine in equivalent positions were found in the low affinity GS1 enzymes [25]. Based on these findings, it has
been thought that the presence or absence of these residues in the primary structure of the polypeptides may be
Castro-Rodríguez et al. BMC Plant Biology (2015) 15:20
indicative of the relative ammonium affinity of GS1. For
example, in the barley GS family, HvGS1_3 has been proposed to be a low affinity isozyme because it lacks both of
these residues and would therefore require a greater
concentration of ammonia for maximal activity compared
with HvGS1_1 and HvGS1_2 [26]. Differences have also
been suggested in the ammonium affinity properties of the
GS1 large family of Brassica napus because of the presence of these two polar residues at conserved positions
[27]. Poplar GS1.1 exhibits an extremely high affinity for
ammonium even though it contains lysine and alanine residues at positions that are equivalent to the positions in
Arabidopsis isoenzymes. Furthermore, a low-affinity GS1
isoform expressed in Sorghum roots has a glutamine residue at position 49 [28]. Based on these results, we conclude that the determinant residues of ammonium affinity
vary from one GS1 to another depending on the plants
species.
To further understand the function of poplar GS genes,
the precise gene expression patterns were determined by
in situ hybridization and laser-capture microdisection analyses. PtGS2 transcripts were mainly localized in the lamina and parenchyma cells of leaves and found at much
lower level in the vascular bundles (Figure 5a, d and
Figure 6, stem), which suggest that it plays an essential
role in nitrogen metabolism associated with photosynthetic activity [13,14]. Interestingly, the highest levels of
the transcripts for PtGS1.1 duplicates were also observed
in the leaf lamina, with decreased levels observed in the
parenchyma cells (Figure 5c and Figure 6, leaf). These results suggest that PtGS1.1 plays a relevant role in the
photosynthetic metabolism of the leaf likely complementing the role of PtGS2. Indeed, PtGS1.1 transcripts were
highly abundant in young and mature leaves with low nitrogen, which suggests that the GS1.1 isoform with a high
affinity for ammonium plays an important role under
these metabolic conditions. OsGln1;1, the predominant
isoform in rice leaves [29], is mainly involved in the remobilization of nitrogen released during senescence. In contrast, the predominant GS1 isoform in poplar leaves,
PtGS1.1, does not appear to be involved in senescence.
When poplar leaves were infected with the bacterial
pathogen Pseudomonas syringae, the relative abundance
of PtGS2, PtGS1.3, and especially PtGS1.1 transcripts decreased considerably, which most likely reflects the impact
of pathogen attack. In contrast, the levels of PtGS1.2
transcripts increased dramatically and were greater than
10 times the levels observed in non-infected leaves
(Additional file 5: Figure S3). These results are consistent
with the enhanced expression of PtGS1.2 observed in senescent poplar leaves [16] and suggest an essential role for
the GS1.2 isoform in nitrogen remobilization. Under conditions of vegetative growth, however, PtGS1.2 transcripts
were almost exclusively expressed in roots, especially in
Page 10 of 14
the secondary roots. PtGS1.2 transcripts were localized in
the cells of the root vascular cylinder (Figure 5j and k,
Figure 6, root), suggesting that GS1.2 is the principal isoform involved in the primary assimilation of nitrogen from
soil. Transcripts for the PtGS1.3 duplicates were highly
expressed in the vascular bundles of leaves and stems
(Figure 5g, h, and Figure 6) but were also present at lower
levels in the vascular elements of the roots (Figure 6).
This specific localization and the particular abundance of
PtGS1.3 in phloem and xylem cells of the stems suggest
that the enzyme plays an essential role in generating glutamine and asparagine for nitrogen transport [14,30] and
in the reassimilation of ammonium released in phenylalanine metabolism [31,32].
In a previous study [16], we proposed that duplicated
genes in poplar may play redundant roles in the nitrogen
metabolism of specific cell-types. The analysis of the recombinant isoenzymes encoded by the duplicates PtGS1.2716066 and PtGS1.2-819912 revealed that they exhibit
nearly identical kinetic parameters. These findings strongly
suggest that the poplar GS duplicates encode isoenzymes
functionally equivalent. It was also of interest to determine
whether the duplicated genes displayed identical gene expression patterns. The in situ hybridization analysis of
transcripts for the PtGS1.3 duplicates (PtGS1.3-834185
and PtGS1.3-827781) strongly support that poplar gene
duplicates are expressed in the same cell-types. Furthermore, the gene expression studies of the duplicated genes
in laser microdissected samples from leaves, stems and
roots fully support this hypothesis that is consistent with
the presence of conserved regulatory elements in the promoters of each pair of genes [16]. Similar results were recently reported for GS genes in Brassica napus, in which
most of the homologous duplicated genes displayed similar
expression patterns in different tissues [27].
Conclusions
Taken together, the previously reported gene expression
analysis of the entire GS family [16], the molecular and
functional analysis of the recombinant GS isoenzymes,
and the precise locations of the corresponding mRNA in
different cell types reported in this study strongly suggest that the poplar GS isoforms play non-redundant
roles in tree biology. Furthermore, all these studies further support the proposal that the expression of the duplicated genes in specific cell types serves to increase the
abundance of the enzymes. Therefore, while there is no
redundancy in the poplar GS family at the whole plant
level, it clearly exists in specific cell types that express
the two duplicated genes. The preservation of duplicated
genes involved in central pathways may be related to the
high enzyme copy number needed to maintain metabolic
flux [33]. Consequently, GS gene redundancy may contribute to maintaining the homeostasis of nitrogen
Castro-Rodríguez et al. BMC Plant Biology (2015) 15:20
metabolism during processes associated with the changes
in glutamine use in multiple metabolic pathways.
Genome duplications are usually followed by a massive
gene loss in which some of the duplicated genes are
retained and evolve to new functions [34]. Alternatively,
duplicated genes can remain largely redundant and serve
to increase the abundance of encoded proteins, or the redundancy could also be related to enhanced robustness
against mutations [34]. Functionally, the redundancy in
the poplar GS family that appeared after the last WGD
most likely favoured the adaptation of poplar trees to faster growth and new ecological niches. This proposal is
supported by the increase in growth observed in transgenic poplars overexpressing constitutively a pine GS gene
[35]. Furthermore, enhanced GS expression in poplar resulted in an enhanced efficiency in nitrogen assimilation
and stress tolerance [36,37]. All these data indicate that increased levels of GS confer selective metabolic advantages
in poplar trees. Whereas massive gene loss occurred in the
GS gene family of Brassica napus [27] following a wholegenome triplication event after divergence from Arabidopsis, all of the duplicated genes were retained in Populus
after the last WGD, and these paralogous genes conserved their expression profiles with no apparent signs
of neofunctionalization.
Methods
Plant materials
All experiments in this study were performed using hybrid
poplar (Populus tremula x Populus alba, clone INRA 717
1-B4), and black cottonwood (Populus trichocarpa, clone
INRA 101–74) micropropagated in vitro on half-strength
Murashige and Skoog medium (MS) as previously described [16]. Rooted shoots were transferred to plant
growth chambers in plastic pots containing a potting mix
(HM3-Agromálaga, Málaga, Spain) and vermiculite in a
1:1 ratio. Plantelets were grown for 2 months in environmentally controlled chambers under previously described
conditions [16]. Plants were regularly supplied with a nutrient solution containing 10 mM potassium nitrate.
Cloning of poplar GS FLcDNA and insertion into
expression vectors
Total RNA from Populus trichocarpa leaves was used to
generate cDNA [16]. The cDNA obtained was used as a
template to obtain coding sequences (CDS) of GS using a
PCR strategy. The PCR reaction was conducted using
AccuSure DNA polymerase (Bioline, London, United
Kindom). The PCR conditions were: 1 cycle: 95°C, 10 min;
35 cycles: 95°C, 30 s; 55°C, 30 s; 72°C, 90 s; 1 cycle: 72°C,
10 min.
The primers were designed according the GS sequences
from the Populus trichocarpa genome ( Numeric identifiers for the CDS are the same
Page 11 of 14
previously used for the corresponding genes [16]. The forward primer sequences were redacted beginning with the
ATG triplet except for the chloroplastic protein, in which
the codon encoding the first common amino acid obtained in an alignment of plant GS2 sequences was used.
A restriction site in the 5′ region was then added to these
primer sequences (underlined). The reverse primers were
also designed to end in the stop codon, except for the
GS1.1 in which the penultimate codon was selected.
Restriction sequences were then also added in the 5′ antisense regions (underlined).
The PCR products were first subcloned in the SmaI site
of the pGEM-3Zf(+) vector using the blunt end strategy
except the GS1.2 CDS, which had a forward primer with a
previously inserted 5′ PstI site (double underlined) for the
insertion of the PCR product into the corresponding site
of the vector. The pGEM-3Zf(+) constructs and a pET28a(+) expression vector (Invitrogene, CA, USA) were
then treated with the restriction enzymes to subclone the
CDS in this vector. This strategy generated recombinant
polypeptides with a poly-His-tag in the N-terminal region,
except GS1.1, which harbored the tag in the C-terminal
region (Additional file 1: Table S1).
Real-Time quantitative PCR
The relative quantification of the gene expression was performed exactly as previously described using the primers
designed to amplify specifically the transcripts encoded by
each pair of duplicated genes [16].
Overproduction of recombinant enzymes in bacteria
The transformed E. coli strain BL21(DE3)-RIL with the
pET-28a(+) vectors were grown at 25°C in 3 liters of LuriaBertani medium supplemented with kanamycin (ml-1) and
chloramphenicol (ml-1). When the O.D. of the cultures
was 0.4 at 600 nm, the temperature was lowered to 10°C,
and then 0.1 mM of Isopropyl-β-D-thiogalactoside (IPTG)
was supplied to induce the expression of the recombinant
proteins. The cells were incubated for hours until an O.D.
value of 0.9 was reached.
Extraction and purification of recombinant enzymes from
bacteria
All operations were carried out at 4°C. Cells were collected
by centrifugation (10 min, 4,000 × g) and resuspended (1 g
of pellet in 3 mL of buffer A: 25 mM Tris pH 8, 5 mM
mercaptoethanol, 1 mM MnCl2). The bacteria were lysed
by incubation 30 min with 1 mg/mL lysozyme and then
sonication with a microprobe emitting 10 pulses of 4
seconds and 10 s intervals, at the intensity level 4 from a
Branson sonifier-250 (Branson Ultrasonics, CT, USA). The
soluble fraction was cleared by centrifugation (22,000 × g,
30 min).
Castro-Rodríguez et al. BMC Plant Biology (2015) 15:20
Proteins were purified on the basis of the His-tag tail. A
total 30 mg of total protein from bacterial soluble fraction
were loaded on a column prepared with 7.5 mL of protino
Ni-IDA resin (Macherin-Nagel, Düren, Germany) equilibrated with buffer A. The column was washed with 20 volumes of bed, and the protein was eluted using a 0–50 mM
imidazole gradient in buffer A. The eluted protein was
concentrated using Amicon Ultra 0.5 mL centrifugal filters
MWCO 10 kDa from Millipore corporation (Maryland,
MD, USA), and the final preparations were stored in 30%
glycerol in buffer A at 4°C. Protein concentration was determined using the Bradford’s procedure [38]. Immunoblots were performed as described elsewhere [39].
Determination of enzyme activity
GS activity was determined using the synthetase and
biosynthetic assays [39,40]. Different buffers were used
instead when determining the GS activity at different pH
levels.
Gel filtration chromatography
Purified proteins were loaded on a Sephacryl S-300 gel
filtration column (100 cm × 1.8 cm) equilibrated in buffer A using a flux of 10 ml/h. The column was calibrated
with molecular weight protein standards (Gel Filtration
Markers Kit MWGF1000 Sigma-Aldrich St. Louis, MO,
USA). The fractions were collected and GS elution was
determined by the synthetase assay.
Page 12 of 14
In situ hybridization
Stem and leaf tissues of poplar plants growing in growth
chambers were fixed in 4% formaldehyde and 0.25% glutaraldehyde for 3 h at room temperature. Plant tissue was
vacuum-infiltrated for 15 min once an hour and remained
in fixative at 4°C overnight to allow complete substitution.
Next, the samples were washed in PBS, dehydrated in a
graded ethanol series, gradually infiltrated with paraplast
X-TRA® (Sigma-Aldrich) and sectioned (10 μm thick) for
in situ mRNA localization according to Cantón et al. [41]
and Craven-Bartle et al. [32].
A 3′-end, non-coding fragment from a cDNA encoding
the P. trichocarpa isoforms GS were subcloned into the
pGEM®−3Zf (+) vector (Promega) and this construct was
used for synthesis of digoxigenin-labeled antisense and
sense RNA probes using the DIG RNA Labelling mix
(Roche). The probes were purified with the NucleoSpin®
RNA Clean-Up XS kit (Macherey-Nagel). The DIGlabeled RNA probe yields were estimated by comparing
the intensity of the sample to the defined control made
with DIG-labeled control RNA (Roche). Hybridization was
conducted at 55°C over night. Probe bound to the section
was detected using anti-digoxigenin Fab conjugated with
alkaline phosphatase and NBT/BCIP as chromogenic
substrates (Roche). Brightfield images were captured
using an Eclipse E-800 microscope (Nikon, Kingston
upon Thames, UK).
Laser capture microdissection (LCM)
Metal catalyzed oxidation assays
Samples used for metal oxidation analysis were fractions
with GS activity collected from ionic exchange chromatography, concentrated with ammonium sulfate, and dialyzed three times in buffer A (without Mn2+) for a total
of 6 h. The incubations were carried out in a final volume of 1 ml for 6 h at 4°C. The incubated samples contained the sample, 15 mM ascorbate, and 0.2 mM FeCl3.
Mass-spectrometry analysis
Purified recombinants proteins (100 ng/μL) were loaded
onto the MALDI plate followed by 1 μL of the alphacyano-4-hydroxycinnamic acid matrix (5 mg/mL in
ACN/TFA 0.2%, 1:1); acetonitrile LS-MS CHROMASOLV (ACN) and trifluoroacetic acid were purchased
from FLUKA (Sigma-Aldrich, St. Louis, MO, USA). The
MS analyses were conducted in a 4700 Proteomics
Analyzer mass spectrometer (ABSCIEX, Foster City, CA,
USA) working in the linear positive ion mode at 20 kV
Source 1 acceleration voltage. The Grid 1 voltage was
set to 92.5% of the acceleration voltage. The delay time
was 850 ns, the low mass gate was enabled with an offset
of 0.0 and data were accumulated between 2000 and
60000 Da. Each data point was the summation of 20
spectra, acquired with 50 laser shots.
Two-month-old plantelets of hybrid poplar (Populus
tremula x Populus alba) were sampled and 0.5 cm tissue
sections were processed for LCM. The leaf and stem sections were fixed with acetone and paraffin embedded. The
root sections were mounted in a specimen holder with embedding medium Tissue-Tek optimal cutting temperature
(OCT) (Sakura Finetek, The Netherland) and snap-frozen
in liquid nitrogen for cryostat sectioning.
The paraffin embedded samples were fixed in acetone by
freeze substitution at −80°C during 3 weeks, and then were
tempered to 4°C o/n. The acetone was then sequentially replaced with acetone for 1 h, acetone:Histolemon (1:1) for
1 h, pure Histolemon (Carlo Erba, Milan, Italy) for 1 h, and
then 5 to 6 pearls of Paraplast X-tra (Leica Microsystems,
Wetzlar, Germany) were add to the Histolemon and
incubated for 1 h at RT. Later, an equal volume of molten
Paraplast X-tra was added to the samples at 58°C and incubated for 2 h. Finally the Histolemon:Paraplast X-tra mix
was replaced by pure liquid Paraplast X-tra at 58°C. The liquid Paraplast X-tra was replaced 4 times during one day
before forming the blocks. The embedded samples were
stored at 4°C before sectioning. The samples were cut with
a rotary microtome and the sections (10 μm thick) were
mounted on PET-membrane 1.4 μm steel frames (Leica
Microsystems, Wetzlar, Germany) and dried for 1–2 h at
Castro-Rodríguez et al. BMC Plant Biology (2015) 15:20
37°C. Dry slides were deparaffinized twice in Histolemon
for 5 min each. Subsequently the samples were incubated
in ethanol 100% for 5 min, and air dried for 5 min. Laser
microdissection was performed with a LMD700 instrument
(Leica, Germany).
The root samples were embedded in OCT medium,
snap-frozen in liquid nitrogen and stored at −80°C. One
day before the cryostat-sectioning, the samples were tempered at −20°C. Fourteen μm thick sections were made
with a Thermo Scientific HM 525 Cryostat (VWR International, PA, USA) at −20°C, and mounted on PETmembrane 1.4 μm steel frames using a Plexiglass frame
Support (Leica, Germany). The steel frames containing the
samples were used immediately or stored at −80°C until
use. Prior to the microdissection operations, the samples
were fixed in cold ethanol 100% for 10 sec, deprived of
OCT medium with DEPC treated water for 2 minutes,
and refixed in ethanol 100% for 1 minute. Subsequently
the samples were air dried and microdissected with a
LMD700 instrument.
The microdissected samples were placed into the caps
of 0.5 mL tubes containing 10 μL of lysis buffer from an
RNAqueous-Micro RNA Isolation Kit (Ambion, TX,
USA). These samples could be stored at −80°C to use
later. The RNA was obtained with the same Kit. LCM
protocol of the kit was followed for the paraffin-embedded
samples, and non-LCM protocol for the snap-frozen samples. RNA quality was assessed using the RNA Pico Assay
for the 2100 Bioanalyzer (Agilent, CA, USA).
Availability of supporting data
All the supporting data of this article are included as
additional files.
Additional files
Additional file 1: Nucleotide sequences of the full-length cDNA
encoding members of the poplar GS family.
Additional file 2: Table S1. Poplar GS accession numbers, primers and
restriction treatments for poplar GS cloning.
Additional file 3: Figure S1. Values of activation energy of poplar GS
holoenzymes. The activation energy (Ea) for each recombinant GS was
calculated from the slope of the Arrhenius plots.
Additional file 4: Figure S2. Effect of metal-catalyzed oxidation on
poplar GS holoenzymes. ◆: 0 mM FeCl3 . ∎: 1 mM FeCl3.
Additional file 5: Figure S3. GS transcript levels in poplar leaves
infected with the pathogen Pseudomonas syringae. Each value represents
the mean ± SD of 3 biological replicates. Statistics analysis were
performed by Anova and the significative diferences were calculated by
Tukey’s t test (p < 0.01). □ Non-infected ∎: Infected.
Abbreviations
CDS: coding sequence; GS: glutamine synthetase; GS1: cytosolic glutamine
synthetase; GS2: chloroplastic glutamine synthetase; GOGAT: glutamate
synthase; IPTG: isopropyl-β-D-thiogalactoside; MS/MALDI: mass spectrometry/
matrix-assisted laser desorption/ionization; LCM: laser capture
Page 13 of 14
microdissection; OCT: optimal cutting temperature; qPCR: real-time
quantitative PCR; WGD: whole genome-wide.
Competing interest
The authors declare that they have no competing interests.
Authors’ contributions
VCR carried out experiments. AGG contributed data analyses and did illustrations.
RAC performed laser microdissection. MBP performed in situ hybridization. CA and
FMC conceived this study. AGG and FMC wrote the manuscript. CA edited the
manuscript. All authors read and approved the final manuscript.
Acknowledgments
We would like to thank Marc Villar (INRA-Orleans) for his generous gift of the P.
trichocarpa clone INRA 101–74, and the anonymous reviewers for their thorough
evaluation and constructive recommendations that helped to improve this
manuscript. We are grateful to Carlos E Rodríguez for the mass-spectrometry
analysis performed at the Proteomics unit, Functional Genomics laboratory,
Universidad de Málaga. This work was supported by Grants from the Spanish
Ministerio de Economía y Competitividad (BIO2012-33797) and Junta de
Andalucía (BIO2012-0474).
Received: 6 October 2014 Accepted: 2 December 2014
References
1. Neale D, Kremer A: Forest tree genomics: growing resources and
applications. Nat Review Genet 2011, 12:111–122.
2. Xu G, Fan X, Miller AJ: Plant nitrogen assimilation and use efficiency.
Annu Rev Plant Biol 2012, 63:153–182.
3. Yamaya T, Kasano M: Evidence supporting distinct functions of three
cytosolic glutamine synthetases and two NADH-glutamate synthases in
rice. J Exp Bot 2014, 65:5519–5525.
4. Unno H, Uchida T, Sugawara H, Kurisu G, Sugiyama T, Yamaya T, Sakakibara H,
Hase T, Kusunoki M: Atomic structure of plant glutamine synthetase: a key
enzyme for plant productivity. J Biol Chem 2006, 281:29287–29296.
5. Seabra AR, Carvalho H, Pereira PJB: Crystallization and preliminary
crystallographic characterization of glutamine synthetase from Medicago
truncatula. Acta Crystallogr Sect F 2009, 65:1309–1312.
6. Lea PJ, Blackwell RD, Chen FL, Hetch U: Enzymes of ammonia assimilation.
In Methods in Plant Biochemistry. Volume 3. Edited by Lea PJ. London:
Academic Press; 1990:257–276.
7. Givan CV, Joy KW, Kleczkowski LA: A decade of photorespiratory nitrogen
cycling. Trends Biochem Sci 1988, 13:433–437.
8. Singh S, Lewis NG, Towers GH: Nitrogen recycling during
phenylpropanoid metabolism in sweet potato tubers. J Plant Physiol 1998,
153:316–323.
9. Cantón FR, Suárez MF, Cánovas FM: Molecular aspects of nitrogen
mobilization and recycling in trees. Photosynth Res 2005, 83:265–278.
10. Pérez-García A, De Vicente A, Cantón FR, Cazorla FM, Codina JC, GarcíaGutiérrez A, Cánovas FM: Light-dependent changes of tomato glutamine
synthetase in response to Pseudomonas syringae infection or
phosphinothricin treatment. Physiol Plant 1998, 102:377–384.
11. Pérez-García A, Pereira S, Pissarra J, García-Gutiérrez A, Cazorla FM, Salema R,
De Vicente A, Cánovas FM: Cytosolic localization in tomato mesophyll
cells of a novel glutamine synthetase induced in response to bacterial
infection or phosphinothricin treatment. Planta 1998, 206:426–434.
12. Buchanan-Wollaston V, Ainsworth C: Leaf senescence in Brassica napus:
cloning of senescence related genes by subtractive hybridisation.
Plant Mol Biol 1997, 33:821–834.
13. Betti B, García-Calderón M, Pérez-Delgado CM, Credali A, Pal’ove-Balang P,
Estivill G, Miroslav R, Vega JM, Galván F, Márquez AJ: Reassimilation of
ammonium in Lotus japonicus. J Exp Bot 2014, 65:5557–5566.
14. Bernard SM, Habash DZ: The importance of cytosolic glutamine
synthetase in nitrogen assimilation and recycling. New Phytol 2009,
182:608–620.
15. Lea PJ: Primary nitrogen metabolism. In Plant Biochemistry. Edited by Dey PM,
Harborne JB. San Diego: Academic Press; 1997:273–313.
16. Castro-Rodríguez V, García-Gutiérrez A, Canales J, Avila C, Kirby EG, Cánovas
FM: The glutamine synthetase gene family in Populus. BMC Plant Biol
2011, 11:119.
Castro-Rodríguez et al. BMC Plant Biology (2015) 15:20
17. Mathews CK, Van Holde KE, Appling DR, Anthony-Cahill SJ: Biochemistry.
4th edition. NJ, USA: Prentice Hall; 2013.
18. Stadtman E, Oliver CN: Metal-catalyzed oxidation of proteins:
Physiological consequences. J Biol Chem 1991, 266:2005–2200.
19. Tuskan GA, Difazio S, Jansson S, Bohlmann J, Grigoriev I, Hellsten U, Putnam N,
Ralph S, Rombauts S, Salamov A, Schein J, Sterck L, Aerts A, Bhalerao RR,
Bhalerao RP, Blaudez D, Boerjan W, Brun A, Brunner A, Busov V, Campbell M,
Carlson J, Chalot M, Chapman J, Chen GL, Cooper D, Coutinho PM, Couturier J,
Covert S, Cronk Q, et al: The genome of black cottonwood, Populus
trichocarpa (Torr. & Gray). Science 2006, 313:1596–1604.
20. Bennett M, Cullimore J: Expression of three plant glutamine synthetase
cDNA in Escherichia coli. Eur J Biochem 1990, 193:319–324.
21. de la Torre F, García-Gutiérrez A, Crespillo C, Cantón FR, Avila C, Cánovas FM:
Functional expression of two pine glutamine synthetase genes in bacteria
reveals that they encode cytosolic isoenzymes with different molecular and
catalytic properties. Plant Cell Physiol 2002, 43:802–809.
22. Seabra AR, Silva LS, Carvalho HG: Novel aspects of glutamine synthetase
(GS) regulation revealed by a detailed expression analysis of the entire
GS gene family of Medicago truncatula under different physiological
conditions. BMC Plant Biol 2013, 13:137.
23. McNally SF, Hirel B, Gadal P, Mann AF, Stewart GR: Glutamine synthetases
of higher plants evidence for a specific isoform content related to their
possible physiological role and their compartmentation within the leaf.
Plant Physiol 1983, 72:22–25.
24. Levitzki A, Koshland DE Jr: The role of negative cooperativity and half-ofthe-sites reactivity in enzyme regulation. In Current topics in cellular
regulation, Vol 10. Edited by Horecker BL, Stadman ER. New York: Academic
Press; 1976:1–40.
25. Ishiyama K, Inoue E, Yamaya T, Takahashi H: Gln49 and Ser174 residues
play critical roles in determining the catalytic efficiencies of plant
glutamine synthetase. Plant Cell Physiol 2006, 47:299–303.
26. Goodall AJ, Kumar P, Tobin AK: Identification and expression analyses of
cytosolic glutamine synthetase genes in barley (Hordeum vulgare L.).
Plant Cell Physiol 2013, 54:492–505.
27. Orsel M, Moison M, Clouet V, Thomas J, Leprince F, Canoy S, Just J,
Chalhoub B, Masclaux-Daubresse C: Sixteen cytosolic glutamine
synthetase genes identified in the Brassica napus L. genome are
differentially regulated depending on nitrogen regimes and leaf
senescence. J Exp Bot 2014, 65:3927–3947.
28. El Omari R, Rueda-López M, Avila C, Nhiri M, Cánovas FM: Ammonium
tolerance and the regulation of two cytosolic glutamine synthetases in
the roots of Sorghum. Funct Plant Biol 2010, 37:55–63.
29. Tabuchi M, Abiko T, Yamaya T: Assimilation of ammonium ions and
reutilization of nitrogen in rice (Oryza sativa L.). J Exp Bot 2007,
58:2319–2327.
30. Cánovas FM, Avila C, Cantón FR, Cañas RA, de la Torre F: Ammonium
assimilation and amino acid metabolism in conifers. J Exp Bot 2007,
58:2307–2318.
31. Gómez-Maldonado J, Avila C, Torre F, Cañas R, Cánovas FM, Campbell MM:
Functional interactions between a glutamine synthetase promoter and
MYB proteins. Plant J 2004, 39:513–526.
32. Craven-Bartle B, Pascual MB, Cánovas FM, Avila C: A Myb transcription
factor regulates genes of the phenylalanine pathway in maritime pine.
Plant J 2013, 74:755–766.
33. Bekaert M, Edger PP, Pires JC, Conant GC: Two-phase resolution of
polyploidy in the Arabidopsis metabolic network gives rise to relative
and absolute dosage constraints. Plant Cell 2011, 23:1719–1728.
34. De Smet R, Van de Peer Y: Redundancy and rewiring of genetic networks
following genome-wide duplication events. Curr Opin Plant Biol 2012,
15:168–176.
35. Jing ZP, Gallardo F, Pascual MB, Sampalo R, Romero J, Torres De Navarra A,
Cánovas FM: Improved growth in a field trial of transgenic hybrid poplar
overexpressing glutamine synthetase. New Phytol 2004, 164:137–145.
36. Man H, Boriel R, El-Khatib R, Kirby EG: Characterization of transgenic poplar
with ectopic expression of pine cytosolic glutamine synthetase under
conditions of varying nitrogen availability. New Phytol 2005, 167:31–39.
37. Cánovas FM, Gallardo F, Jing ZP, Pascual B: Transgenic approaches to
engineer nitrogen metabolism. In Tree Transgenesis. Recent Developments.
Edited by M Fladung M, Ewald S. Heildelberg, Germany: Springer Verlag;
2006:157–178.
Page 14 of 14
38. Bradford M: A rapid and sensitive method for the quantitation of
microgram quantities of protein utilizing the principle of protein-dye
binding. Anal Biochem 1976, 72:248–254.
39. Cánovas FM, Cantón FR, Gallardo F, García-Gutiérrez A, De Vicente A:
Accumulation of glutamine synthetase during early development of
maritime pine (Pinus pinaster) seedlings. Planta 1991, 185:372–378.
40. Cánovas F, Valpuesta V, Núñez de Castro I: Characterization of glutamine
synthetase from tomato leaves. Plant Sci Lett 1984, 37:79–85.
41. Cantón FR, Suárez MF, Josè-Estanyol M, Cánovas FM: Expression analysis of
a cytosolic glutamine synthetase gene in cotyledons of Scots pine
seedlings: developmental, light regulation and spatial distribution of
specific transcripts. Plant Mol Biol 1999, 40:623–634.
Submit your next manuscript to BioMed Central
and take full advantage of:
• Convenient online submission
• Thorough peer review
• No space constraints or color figure charges
• Immediate publication on acceptance
• Inclusion in PubMed, CAS, Scopus and Google Scholar
• Research which is freely available for redistribution
Submit your manuscript at
www.biomedcentral.com/submit