Regulation of Zn and Fe transporters by the GPC1 gene during early wheat monocarpic senescence
Bạn đang xem bản rút gọn của tài liệu. Xem và tải ngay bản đầy đủ của tài liệu tại đây (879.5 KB, 23 trang )
Pearce et al. BMC Plant Biology (2014) 14:368
DOI 10.1186/s12870-014-0368-2
RESEARCH ARTICLE
Open Access
Regulation of Zn and Fe transporters by the GPC1
gene during early wheat monocarpic senescence
Stephen Pearce1, Facundo Tabbita2, Dario Cantu3, Vince Buffalo1, Raz Avni4, Hans Vazquez-Gross1,
Rongrong Zhao5, Christopher J Conley6, Assaf Distelfeld7 and Jorge Dubcovksy1,8*
Abstract
Background: During wheat senescence, leaf components are degraded in a coordinated manner, releasing amino
acids and micronutrients which are subsequently transported to the developing grain. We have previously shown
that the simultaneous downregulation of Grain Protein Content (GPC) transcription factors, GPC1 and GPC2, greatly
delays senescence and disrupts nutrient remobilization, and therefore provide a valuable entry point to identify
genes involved in micronutrient transport to the wheat grain.
Results: We generated loss-of-function mutations for GPC1 and GPC2 in tetraploid wheat and showed in field trials
that gpc1 mutants exhibit significant delays in senescence and reductions in grain Zn and Fe content, but that
mutations in GPC2 had no significant effect on these traits. An RNA-seq study of these mutants at different time
points showed a larger proportion of senescence-regulated genes among the GPC1 (64%) than among the GPC2
(37%) regulated genes. Combined, the two GPC genes regulate a subset (21.2%) of the senescence-regulated genes,
76.1% of which are upregulated at 12 days after anthesis, before the appearance of any visible signs of senescence.
Taken together, these results demonstrate that GPC1 is a key regulator of nutrient remobilization which acts
predominantly during the early stages of senescence. Genes upregulated at this stage include transporters from
the ZIP and YSL gene families, which facilitate Zn and Fe export from the cytoplasm to the phloem, and genes
involved in the biosynthesis of chelators that facilitate the phloem-based transport of these nutrients to the grains.
Conclusions: This study provides an overview of the transport mechanisms activated in the wheat flag leaf during
monocarpic senescence. It also identifies promising targets to improve nutrient remobilization to the wheat grain,
which can help mitigate Zn and Fe deficiencies that afflict many regions of the developing world.
Keywords: Wheat, Senescence, GPC, Zinc transport, Iron transport, ZIP
Background
In annual grasses, monocarpic senescence is the final
stage of a plant’s development during which vegetative
tissues are degraded and their cellular nutrients and
amino acids are transported to the developing grain. The
regulation of this process is crucial for the plant’s reproductive success and determines to a large extent the
nutritional quality of the harvested grain. Among wild
diploid relatives of wheat, there exists large variation in
Zn and Fe grain content, whereas modern wheat germplasm collections exhibit comparatively lower and less
* Correspondence:
1
Department of Plant Sciences, University of California, Davis, CA 95616, USA
8
Howard Hughes Medical Institute and Gordon & Betty Moore Foundation
Investigator, Davis, CA 95616, USA
Full list of author information is available at the end of the article
variable Zn and Fe concentrations [1,2], demonstrating
that improvements in these traits are possible. Zn and
Fe deficiency afflict many parts of the developing world
where wheat constitutes a major part of the diet, making the development of nutritionally-enhanced wheat
varieties an important target for breeders tackling this
problem [3].
The main source of protein and micronutrients in
the wheat grain is the flag leaf and, to a lesser extent, the lower leaves [4,5]. When applied to the leaf tip,
radioactively-labelled Zn is efficiently translocated to the
developing wheat grain [6]. The close correlation between Zn and Fe content in the grain suggests some level
of redundancy in the regulatory mechanisms used by the
plant to transport these micronutrients [1]. However, the
regulation of gene expression associated with nutrient
© 2014 Pearce et al.; licensee BioMed Central. This is an Open Access article distributed under the terms of the Creative
Commons Attribution License ( which permits unrestricted use, distribution, and
reproduction in any medium, provided the original work is properly credited. The Creative Commons Public Domain
Dedication waiver ( applies to the data made available in this article,
unless otherwise stated.
Pearce et al. BMC Plant Biology (2014) 14:368
transport from leaves to grain during wheat monocarpic
senescence is poorly understood. A detailed understanding of these mechanisms will be required in order to engineer wheat varieties with improved nutritional quality
through biofortification [7].
Several studies in other species, including barley, rice
and Arabidopsis have revealed distinct mechanisms
regulating micronutrient transport in vegetative tissues,
which are described below according to their sub-cellular
location.
Transport between chloroplast and cytoplasm
Because of its importance to photosynthesis, Fe is particularly abundant within the chloroplasts, which harbor ~90%
of all Fe in the leaf during vegetative development [8].
Therefore, the remobilization of Fe from the chloroplast
is an important process during monocarpic senescence.
In Arabidopsis a member of the ferric chelate reductase
(FRO) gene family is highly expressed in photosynthetic tissues and localizes to the chloroplast membrane, suggestive
of a role in the reduction-based import of Fe into the chloroplasts [9]. In rice, certain FRO genes are preferentially
expressed in the leaf vasculature rather than the roots, suggesting that this may be a conserved transport mechanism
[10]. Certain members of the Heavy Metal ATPase (HMA)
family of transporters have been implicated in the reverse
process; nutrient export from the chloroplast to the cytoplasm. In Arabidopsis, AtHMA1 localizes to the chloroplast membrane and facilitates Zn export from the
chloroplast [11] and in barley, HvHMA1 facilitates both
Zn and Fe export from the chloroplast [12].
Transport between vacuole and cytoplasm
Additional mechanisms within the leaf exist to facilitate
Fe and Zn transport between the vacuole and cytoplasm
as part of a sequestration strategy, since high concentrations of either nutrient can be toxic for the plant cell. In
rice, two VACUOLAR IRON TRANSPORTER genes,
OsVIT1 and OsVIT2, encode proteins which are localized to the vacuolar membrane (tonoplast) and facilitate
Zn2+ and Fe2+ import to the vacuole [13]. Likewise, the
ZINC-INDUCED FACILITATOR-LIKE (ZIFL) genes encode Zn-transporters which are implicated in vacuole
transport. In Arabidopsis, ZIF1 localizes to the tonoplast
and zif1 mutants accumulate Zn in the cytosol, suggesting that these transporters promote vacuolar sequestration of Zn by facilitating its import into the vacuole [14].
However, several of the thirteen ZIFL genes recently described in rice are induced in the flag leaves during senescence [15]. This suggests that in monocots, certain
ZIFL genes may also play a role in promoting nutrient
remobilization during senescence. The NRAMP family
of transporters appears to regulate nutrient export from
the vacuole. In Arabidopsis, NRAMP3 and NRAMP4 are
Page 2 of 23
induced in Fe-deficient conditions and plants combining
mutations in both these genes fail to mobilize vacuolar
reserves of Fe [16].
Transport from cytoplasm to phloem
For their transport to the grain, micronutrients must be
transported from the cytoplasm across the plasma membrane to be loaded into the phloem. This process is facilitated by members of the Yellow stripe like (YSL) and
ZRT, IRT like protein (ZIP) families of membrane-bound
transporters, which transport metal-chelate complexes
across the plasma membrane in the leaves of several plant
species [17-19]. In Arabidopsis, two Fe-transporting members of the YSL gene family were shown to be essential for
normal seed development [20] and in barley, HvZIP7
knockout mutant plants exhibit significantly reduced Zn
levels in the grain, suggesting that this family may also be
important for nutrient loading into the phloem [21].
Because Zn and Fe ions exhibit limited solubility in
the alkaline environment of the phloem, they are transported in association with a chelator [19]. Nicotianamine
(NA) is one such important chelator and is a member
of the mugineic acid family phytosiderophores [22].
NA biosynthesis is regulated by the enzyme nicotianamine synthase (NAS) by combining three molecules of
S-Adenosyl Methionine [23], and can be further catalyzed
to 2’-deoxymugineic acid (DMA) by the sequential activity
of nicotianamine aminotransferase (NAAT) [24,25], which
generates a 3”-keto intermediate and DMA synthase
(DMAS, Figure 1) [26]. Although Zn has been shown to
associate with DMA in the rice phloem [27], a recent
study suggests that it is more commonly associated with
NA [28]. In contrast, the principal chelator of Fe in the
rice phloem is DMA [29]. It has been hypothesized that
phloem transport represents the major limiting factor determining Zn and Fe content of cereal grains [30] and this
is supported by several studies which demonstrate that altering NAS expression can have significant impacts on Zn
and Fe grain and seed content. In Arabidopsis, plants carrying non-functional mutations in all NAS genes exhibit
low Fe levels in sink tissues, while maintaining high levels
in ageing leaves [31]. Conversely, NAS overexpression results in the accumulation of higher concentrations of Zn
and Fe in Arabidopsis seed [32], rice grains [33,34] and
barley grains [35].
Regulation of senescence and nutrient translocation
Monocarpic senescence and nutrient translocation to
the grain occur simultaneously, requiring a precise coordination of these two processes. This is reflected in
the large-scale transcriptional changes in the plant’s vegetative tissues during the onset of senescence, as documented
in recent expression studies in Arabidopsis [36,37], barley
[38] and wheat [39,40]. These studies consistently identify
Pearce et al. BMC Plant Biology (2014) 14:368
S-Adenosyl Methionine (SAM)
NAS
Nicotianamine (NA)
NAAT
3”-keto intermediate
Page 3 of 23
stages of monocarpic senescence in tetraploid wheat. We
also identified genes that were differentially expressed
within each of these stages between tetraploid WT and
gpc mutants, which exhibited reduced Zn and Fe grain
concentrations. We identified members of different transporter families, which were differentially regulated both
during the early stages of senescence and between genotypes with different GPC alleles. Results from this study
define more precisely the role of individual GPC genes in
the regulation of transporter gene families in senescing
leaves and identify new differentially regulated targets for
Fe and Zn biofortification strategies in wheat.
Results
DMAS
2’-Deoxymugineic acid (DMA)
Figure 1 Biosynthesis of mugienic acid phytosiderophores. The
combination of three molecules of SAM to form one molecule of
NA is catalyzed by NAS. NA is converted to DMA through the action
of NAAT to form a 3”-keto intermediate and then by DMAS to form
DMA. Adapted from Bashir et al. [26].
increased expression levels of a number of transcription
factors of different classes. Particularly important roles
have been identified for members of the NAC family
[38,41-44]. In wheat, one such NAC-domain transcription
factor, Grain Protein Content 1 (GPC1, also known as
NAM1), has been shown to play a critical role in the regulation of both the rate of senescence and the levels of protein, Zn and Fe in the mature grain [44].
Originally identified as a QTL which enhances grain
protein content in wild emmer (Triticum turgidum spp.
dicoccoides) [45], the genomic region of chromosome arm
6BS including GPC1 was later shown to also accelerate
senescence in tetraploid and hexaploid wheat [44,46,47]. A
paralogous gene, GPC2 (also known as NAM2), was identified on chromosome arm 2BS, which shares 91% similarity
with GPC1 at the DNA level [44]. Transcripts of GPC1
and GPC2 are first detected in flag leaves shortly before
anthesis and increase rapidly during the early stages of senescence. In hexaploid wheat, plants transformed with a
GPC-RNAi construct targeting all homologous GPC genes
and plants carrying loss-of-function mutations in all GPC1
homoeologs, both exhibit a three-week delay in the onset
of senescence as well as significant reductions in the transport of amino acids (N), Zn and Fe to the grain [5,44,46].
Therefore, GPC mutants represent an excellent tool to dissect the mechanisms underlying Zn and Fe transport from
leaves to grains during monocarpic senescence.
In the current study, we used RNA-seq to identify genes
differentially regulated in the flag leaves during three early
GPC1 and GPC2 mutations and their effect on senescence
and nutrient translocation
Field experiments comparing wild type (WT), single
(gpc-A1 and gpc-B2), and double (gpc-A1/gpc-B2) mutants showed consistent results across the four tested
environments (UCD-2012, TAU-2012, NY-2012 and
NY-2013, Figure 2, Additional file 1: Figure S1 and S2).
None of the gpc mutants showed significant differences
in heading time relative to the WT, which is consistent
with the known upregulation of the GPC genes after anthesis [44]. Both the gpc-A1 and gpc-A1/gpc-B2 mutants
were associated with a significant delay in senescence
relative to the WT and the gpc-B2 mutant. In the Davis
field experiment (UCD-2012), these two mutants showed
a 27-day delay in the onset of senescence in comparison
to WT plants (Figure 2a), and consistent results were observed in field experiments carried out in Tel Aviv and
Newe Ya’ar (Additional file 1: Figure S1). The differences
in senescence observed between WT and gpc-B2 or between gpc-A1 and gpc-A1/gpc-B2 mutants were comparatively much smaller (Figure 2a).
To test the effects of the GPC mutations on yield
components in a tetraploid background, we measured
thousand kernel weight (TKW) in three field environments and dry spike weight in the Davis field experiment. We detected a marginally significant reduction in
TKW associated with the gpc-A1 and gpc-A1/gpc-B2 mutant genotypes (P =0.02, Additional file 1: Figure S2a).
These mutant genotypes were also associated with significant reductions in dry spike weight in the Davis field experiment which was lower in both gpc-A1 and gpc-A1/
gpc-B2 mutants at 35 DAA (P <0.001) and in the gpc-A1/
gpc-B2 mutant at 42 and 49 DAA (P <0.001, Additional
file 1: Figure S2b).
The delays in the onset of senescence in the gpc-A1
and gpc-A1/gpc-B2 mutants relative to WT plants were
associated with reductions in protein, Zn and Fe levels
in the mature grain (Figure 2, b-d). Similarly, the marginal differences in senescence between WT and gpc-B2
or between gpc-A1 and gpc-A1/gpc-B2 mutants (Figure 2a)
Pearce et al. BMC Plant Biology (2014) 14:368
Page 4 of 23
(a)
(b)
200
WT
gpc-B2
gpc-A1
gpc-A1/
gpc-B2
60
50
40
30
20
160
***
140
***
***
***
*
120
10
0
WT
gpc-B2
gpc-A1
gpc-A1/
gpc-B2
180
GPC (g Kg-1)
Chlorophyll (Relative units)
70
**
H
7
22
36
42
48
54
60
66
100
72
UCD
Days after anthesis
(c)
TAU
NY
(d)
80
***
***
*
**
70
60
Zn (ppm)
Fe (ppm)
WT
gpc-B2
gpc-A1
gpc-A1/
gpc-B2
WT
gpc-B2
gpc-A1
gpc-A1/
gpc-B2
50
40
***
***
30
20
10
0
UCD
TAU
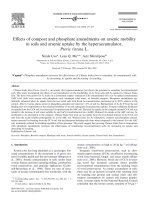
Figure 2 GPC mutations in tetraploid wheat result in significant delays in senescence and reductions in protein, Zn and Fe content in
the grain. (a) Relative chlorophyll content of flag leaves taken from the UCD-2012 field experiment (b) GPC content of mature grains harvested
from three experiments, (UCD n = 10, TAU and NY n = 4) (c) Fe and (d) Zn content of mature grains harvested from UCD-2012 and TAU-2012
experiments (n = 5). * = P < 0.5, ** = P < 0.01, *** = P < 0.001, difference when compared to WT control sample from Dunnett’s test. UCD = UC Davis
2012 experiment, TAU = Tel Aviv University 2012 experiment, NY = Newe Ya’ar research center 2012 experiment.
were paralleled by the absence of significant differences
in protein, Zn and Fe levels in the grain in the different
field experiments (Figure 2, b-d). Similar reductions
in GPC were observed across the different field experiments (Figure 2b), which ranged between 19.5%
(WT vs. gpc-A1) and 13.4% (WT vs. gpc-A1/gpc-B2).
Micronutrient concentrations in the mature grain for
each genotype in UCD-2012 and TAU-2012 experiments
are presented in Additional file 1: Table S1. Fe concentrations in the grain were significantly lower in both the
gpc-A1 (20.9% mean reduction) and gpc-A1/gpc-B2 mutants (20.8% mean reduction) when compared to WT
samples in both locations (Figure 2c). Zn grain concentrations were also lower for the same mutant genotypes
in both locations, but the differences were significant
only in the UCD-2012 experiment (Figure 2d). Interestingly, gpc-A1 and gpc-A1/gpc-B2 mutants also exhibited significantly higher grain K concentrations than
in WT plants, with increases ranging between 18 and
33% (Additional file 1: Table S1). All GPC and micronutrient values are reported as the concentration within the
grain, so are unaffected by the variation in TKW detected
between genotypes.
Taken together, these results demonstrate that a knockout mutation of the GPC1 gene alone is sufficient to delay
the onset of senescence and to perturb the translocation of
protein, Zn and Fe to the developing grain in tetraploid
durum wheat under field conditions. The gpc-B2 mutation
had no significant effect on any of these traits, even in a
genetic background with no functional GPC1 genes.
Evaluation of the mapping reference used for RNA-seq and
overall characterization of loci expressed in each sample
To identify GPC-mediated transcriptional changes associated with the onset of senescence, we carried out an
RNA-seq study focusing on three genotypes; WT and
Pearce et al. BMC Plant Biology (2014) 14:368
the two mutants that showed the largest differences in
senescence in the previous field experiments, gpc-A1
and gpc-A1/gpc-B2. None of the plants sampled at heading date (HD), 12 days after anthesis (DAA) or 22 DAA,
showed signs of chlorophyll degradation in the flag
leaves or yellowing of the peduncles (Additional file 1:
Figure S3, a-c), confirming that the selected time points
represent relatively early stages of the senescence process.
Clear differences between genotypes were apparent five
weeks later (60 DAA), when the WT plants showed more
advanced symptoms of senescence than either of the two
gpc mutants (Additional file 1: Figure S3, d-f). This result
indicates that in this greenhouse experiment, the effects of
the GPC genes were consistent with those observed in the
field experiments described above (Figure 1a).
On average, 35 million trimmed RNA-seq reads were
generated for each of the four replicates of each of the
nine genotype/time point combinations included in
this study (Additional file 1: Table S2, total 1.3 billion
reads). Most of the reads (average 99.0%) were mapped
to the reference genomic contigs generated by the
International Wheat Genome Sequencing Consortium
(IWGSC) using flow-sorted chromosomes arms of T. aestivum cv. Chinese Spring [48]. Since we were mapping
transcripts of a tetraploid wheat cultivar, only the sequences from the A and B genome chromosome arms
were used as a reference.
A large proportion of the trimmed reads (average
93.4%, Additional file 1: Table S2) mapped within the
139,828 previously defined transcribed genomic loci
within this reference (see Methods), suggesting that these
loci provide a good representation of the transcribed portion of the wheat genome. However, only 58.5% of these
reads mapped to unique locations (Additional file 1:
Table S2), most likely due to a combination of the high
level of similarity shared by the coding regions of A and
B homoeologs (average identity = 97.3%, standard deviation = 1.2%, [49]), and the short length of the reads used
in this study (50 bp). Ambiguously mapped reads were
excluded from the statistical analyses described below,
resulting in an average of 20.4 M uniquely mapped reads
per sample.
After excluding ambiguously mapped reads, only 80,168
of the genomic loci showed transcript coverage above the
selected threshold for the statistical analyses (>3 reads for
at least two biological replicates, within at least one
genotype/time point pair, see Methods). The complete
list of statistical analyses performed for these 80,168 loci
is summarized in Additional file 2. Probability values for
all four statistical tests are presented in this table so researchers can reanalyze the data using different statistical
analyses and levels of stringency for specific sets of
genes. Where available, this table also describes the highconfidence protein coding gene corresponding to each
Page 5 of 23
genomic locus, derived from the recent annotation of
these wheat genomic contigs [48].
Principal component analysis (PCA) of the uniquely
mapped reads at each time point showed limited clustering of the samples according to their genotype at HD
(Additional file 1: Figure S4a), very clear groupings at 12
DAA (Additional file 1: Figure S4b), and intermediate
clustering at 22 DAA (Additional file 1: Figure S4c). The
reciprocal analysis, to distinguish samples according to
time point within each genotype, showed that in all
three genotypes, the HD samples were more clearly separated than the two later time points (Additional file 1:
Figure S4, d-f ). The clearer separation of both gpc mutants from the WT, and of gpc-A1 from gpc-A1/gpc-B2
at 12 DAA than at either HD or 22 DAA, suggests that
both GPC1 and GPC2 genes have a major regulatory
role at this early stage of senescence (12 DAA).
Following mapping, we confirmed the genotype of
each sample by analyzing pileups of reads which mapped
to the genomic loci corresponding to the GPC-A1
and GPC-B2 genes. The expected TILLING mutations
(G561A = W114* for gpc-A1 and G516A = W109* for
gpc-B2) were confirmed in the expected mutant genotypes and were absent in all WT samples. All GPC genes
showed a low number of mapped reads at HD, with significant increases at 12 DAA and 22 DAA (Additional
file 1: figure S5). Approximately 3-4-fold more reads
mapped to GPC1 homoeologous genes than to the GPC2
genes, a pattern which was consistent across all genotypes
(Additional file 1: Figure S5).
We detected no significant differences in the expression profiles of GPC-A1 and GPC-B2 between WT and
gpc mutant genotypes suggesting that the mutations in
these genes did not affect the stability of the transcribed
mRNAs, and that neither GPC-A1 nor GPC-B2 functional proteins exhibit a feedback regulatory mechanism
on their own transcription (Additional file 1: Figure S5).
However, at 22 DAA, GPC-A2 expression was significantly
lower in WT plants than in either gpc-A1 (P = 0.024) or
gpc-A1/gpc-B2 (P = 0.004) mutants, suggesting that there
may exist some GPC-mediated feedback mechanism on
the regulation of GPC-A2 transcript levels (Additional
file 1: Figure S5).
Identification of loci differentially expressed during
monocarpic senescence in WT plants
Applying stringent selection criteria (significant according to four different statistical tests, see Methods), we
identified 3,888 contigs which were differentially expressed
(DE) in at least one pairwise comparison among sampling
times in the WT genotype (Figure 3a). As expected, the
comparison between HD and 22 DAA showed the largest
number of DE loci (2,471), followed by the comparison between HD and 12 DAA (1703). The comparison between
Pearce et al. BMC Plant Biology (2014) 14:368
(a)
Page 6 of 23
Effect of timepoint in WT
(b)
Effect of genotype
HD vs. 12 DAA
(1703)
WT vs. gpc-A1
(520)
852
168
61
718
12
321
72
1173
1349
504
508
HD vs. 22 DAA
(2471)
(c)
19
12 DAA vs. 22 DAA
(1145)
Effect of gpc-A1
and senescence
gpc-A1 vs.
gpc-A1/gpc-B2
(292)
WT vs.
gpc-A1/gpc-B2
(1913)
(d)
37
224
Effect of gpc-B2
and senescence
WT vs. gpc-A1
(520)
gpc-A1 vs.
gpc-A1/gpc-B2
(292)
114
43
121
147
66
219
1038
WT vs.
gpc-A1/gpc-B2
(1913)
535
6
96
3068
WT senescence
(3888)
1012
WT vs.
gpc-A1/gpc-B2
(1913)
658
3128
WT senescence
(3888)
Figure 3 Overlap of DE genes (a) Between time points in WT samples, (b) Between different GPC genotype comparisons, (c) Between
GPC-A1-regulated loci and senescence regulated loci and (d) Between GPC-B2-regulated loci and senescence regulated loci.
12 DAA and 22 DAA showed the lowest number of DE
loci (1,145, Figure 3a).
Of the loci which were significantly DE in the WT
plants between HD and 12 DAA, a larger proportion
were upregulated (76.2%) than were downregulated
(23.8%). The reverse was true for loci DE between 12
DAA and 22 DAA, when 30.2% of loci were upregulated
and 69.8% were downregulated. This suggests that during
the first 12 DAA different mechanisms required to actively prepare the plant for the upcoming senescence are
upregulated, which is followed by the shutdown of many
biological processes and the downregulation of a large
number of genes.
We next determined whether any previously characterized senescence associated genes were also differentially expressed in our dataset. In a wheat microarray
study, 165 annotated genes were identified which were
differentially expressed during eight stages of senescence, ranging from anthesis to yellowing leaves [40].
We identified the corresponding genes within our dataset using BLAST (P ≤ 1e−5) and found that 26 (15.8%)
were also significantly differentially expressed during
senescence in the current study (Additional file 1:
Table S3). This relatively low percent is not unexpected
since our study covers only the early stages of senescence
whereas the previous study covered a more extended
period. A second microarray experiment in barley identified a set of genes differentially expressed between NILs
divergent for a high-GPC genomic segment at 14 DAA
and at 21 DAA [38]. In the leaves, 2,276 genes were upregulated in at least one of these time-points and 1,193
were downregulated. Among the upregulated genes, we
identified 100 which were also significantly up-regulated
during senescence, and of the down-regulated genes, 96
were also significantly down-regulated within our dataset,
which used different statistical stringency criteria. The
use of different technologies (microarray vs RNA-seq)
and different species may also contribute to the different
Pearce et al. BMC Plant Biology (2014) 14:368
sets of differentially expressed genes detected in these
studies. The genes regulated by senescence in both experiments are listed in Additional file 1: Table S4.
This study in tetraploid wheat supersedes our previous
RNA-seq analysis in hexaploid wheat comparing the
transcriptomes of WT and transgenic GPC-RNAi lines
with reduced transcript levels of GPC1 and GPC2 at 12
DAA [39]. In the current study, we generated a greater
number of reads, studied additional time-points, used
targeted knockouts of individual GPC genes and had access to a more comprehensive wheat genome mapping
reference. Among the differentially expressed genes common to both studies were three genes of biological interest
selected for validation in the previous study [39].
Identification of loci differentially expressed among
GPC genotypes
We next identified loci which were DE between genotypes. The largest number of DE loci was detected between the WT and the double gpc-A1/gpc-B2 mutants
(1,913 loci), an expected result given that this comparison includes genes regulated by both GPC-A1 and GPCB2 (Figure 3b). The comparison between the WT and
the single gpc-A1 mutant, expected to detect mainly
GPC-A1-regulated genes, showed a much lower number
of DE genes (520 loci) than the previous comparison. A
total of 321 of these loci (62%, Figure 3b) were DE
in both these comparisons and are designated hereafter
as high-confidence GPC-A1-regulated genes. The third
comparison, between the gpc-A1 and gpc-A1/gpc-B2 mutant genotypes, expected to detect mainly genes regulated by GPC-B2, yielded a lower number of DE loci
(292). Most of these loci (224 = 77%, Figure 3b) were
also DE in the comparison between the WT and the gpcA1/gpc-B2 double mutant and are designated hereafter
as high-confidence GPC-B2-regulated genes. There were
19 loci which were DE in all three comparisons between genotypes, and these likely represent genes redundantly regulated by both GPC-A1 and GPC-B2 genes
(Figure 3b). Similarly, the 1,349 loci DE only between the
WT and double gpc-A1/gpc-B2 mutants but not in the
other two classes (Figure 3b), likely include loci that are
redundantly regulated by both genes, but that show significant differences in expression only when mutations in
both GPC paralogs are combined.
To determine how these differences between genotypes were distributed in time, we made pairwise comparisons between genotypes within each of the three
time points. Since both GPC1 and GPC2 expression is
relatively low at HD (Additional file 1 : Figure S5), we
expected to find a small number of DE loci among GPC
genotypes at this time point. Indeed, only ten genes were
DE between WT and the gpc-A1 single mutant, only six
between WT and the gpc-A1/gpc-B2 double mutant and
Page 7 of 23
19 between the gpc-A1 and gpc-A1/gpc-B2 mutants at
HD. Two loci were shared between the WT vs. gpc-A1/
gpc-B2 and gpc-A1 vs. gpc-A1/gpc-B2 comparisons, suggesting they may potentially be regulated by GPC-B2
and one gene was common to the WT vs. gpc-A1 and
WT vs. gpc-A1/gpc-B2 comparisons, suggesting it may
be regulated by GPC-A1. These results confirm that GPC
genes have only a marginal effect on the wheat transcriptome at this developmental stage.
By contrast, the number of DE loci between genotypes
was much greater at 12 DAA. Of the 520 loci DE between WT and the gpc-A1 single mutant, 504 (96.9%)
were DE at 12 DAA and only six (1.1%) at 22 DAA.
Similarly, of the 1,913 loci DE between WT and the gpcA1/gpc-B2 double mutant 1,525 (79.7%) were DE at 12
DAA, whereas only 385 (20.1%) were DE at 22 DAA. Of
the 292 DE genes in the comparison between the gpc-A1
single mutant and the gpc-A1/gpc-B2 double mutant,
239 were DE at 12 DAA, whereas only 38 genes were
DE at 22 DAA. These results suggest that even though
GPC1 and GPC2 expression continues to rise between
12 DAA and 22 DAA (Additional file 1 Figure S5), the
major effect of both these genes on the regulation of
downstream genes occurs at 12 DAA.
We next compared the two sets of high-confidence
GPC-regulated loci with the senescence-regulated loci. A
broad overlap was detected between GPC-A1-regulated
and senescence-regulated loci, with 206 of the 321
(64.2%) high-confidence GPC-A1-regulated loci also DE
during senescence (Figure 3c). By contrast, of the 224
high-confidence GPC-B2-regulated loci only 83 (37.1%)
were also DE during senescence (Figure 3d). Surprisingly, 81% of the genes upregulated during the first 12
DAA in WT plants (1,054 genes) were no longer significant in the gpc-A1 mutant. This observation highlights
the critical role of GPC1 in the activation of a large
number of genes during the early stages of monocarpic
senescence, possibly to prepare the plant for the upcoming senescence.
Distribution of expression profiles among different
genotypic classes
To further analyze the loci DE during senescence, we
classified them into eight classes based on their upregulation (Up), downregulation (Down) or absence of significant differences (Flat) between HD and 12 DAA, and
between 12 DAA to 22 DAA (Figure 4a). Loci which
were not significantly DE in either of these comparisons,
but were significantly up or downregulated between
HD and 22 DAA were included in the ‘Up-Up’ and
‘Down-Down’ classes, respectively. When all 3,888 loci
DE during senescence in WT plants were considered
(Figure 4, a-b) all eight classes were well represented
with slightly higher proportions in the three classes that
Pearce et al. BMC Plant Biology (2014) 14:368
Page 8 of 23
(a)
(b)
(c)
WT senescence
(3888)
(d)
GPC-A1 and senescence
(219)
GPC-B2 and senescence
(96)
% Up-Up
% Up-Flat
% Flat-Up
% Up-Down
% Down-Up
% Flat-Down
% Down-Flat
% Down-Down
Figure 4 Expression profiles during senescence. (a) Boxplot of log2 normalized counts for WT samples over three time points during senescence,
separated according to their expression profiles in 8 classes. Classes were defined based on the existence of significant (‘Up’ and ‘Down’) or
non-significant differences (‘Flat’) between time point comparisons. (b-d) Proportion of expression classes among loci DE during senescence in
(b) WT (3888 loci), (c) high-confidence GPC-A1-regulated loci (219 loci) and (d) high-confidence GPC-B2-regulated loci (96 loci). Loci included in
C and D are based on the intersections of the three classes shown in Figure 3, c and d. H = Heading Date, 12 = 12 days after anthesis, 22 = 22 days
after anthesis.
include loci upregulated between HD and 12 DAA
(‘Up-Down’: 21.2%, ‘Up-Up’: 20.3% and ‘Up-Flat’: 16.9%).
A different picture emerged when, among the loci DE during senescence, we considered only the high-confidence
GPC-A1 (219) and GPC-B2 (96) regulated genes. In both
cases the ‘Up-Down’ class was dominant, representing
63.5% and 62.5% of the DE loci, respectively (Figure 4, c
and d). However, a difference between these two groups
was evident in the second most abundant class; ‘Up-Flat’
in the high-confidence GPC-A1-regulated genes (24.7%),
and ‘Down-Up’ in the high-confidence GPC-B2-regulated
genes (26.0%, Figure 4, c and d). In both groups, the
remaining six classes represented less than 12% of the DE
loci. These data indicate that while both genes have their
greatest effect at 12 DAA, a partial differentiation exists
of the loci and processes regulated by the GPC-A1 and
GPC-B2 genes.
Gene ontology analysis
We next used BLAST2GO to generate ‘Biological Process’
Gene Ontology (GO) terms for each locus to compare the
proportions of different functional categories between loci
up- and downregulated during senescence in WT and
between high-confidence GPC-A1- and GPC-B2-regulated loci (Table 1). To simplify the description of these
functional analyses, we first combined the eight functional categories from Figure 4a into four: upregulated loci
(combining ‘Up-Up’, ‘Up-Flat’ and ‘Flat-Up’ categories),
downregulated loci (combining ‘Down-Down’, ‘Down-Flat’
and ‘Flat-Down’ categories), ‘Up-Down’, and ‘Down-Up’.
Among loci upregulated during senescence, we observed enrichment in transport functions and catabolism
of photosynthetic proteins. Four of the top five most
significantly enriched GO terms included those related
to transmembrane transporter function (Table 1). By
contrast, loci downregulated during senescence were
enriched in functions related to biosynthetic processes,
especially photosynthesis (Table 1). These results, together with the previous observation that upregulated
loci were more abundant between WT and 12 DAA
(76.2%) and downregulated loci were more abundant between 12 and 22 DAA (69.8%), are indicative of the early
activation of catabolic enzymes and transport systems
followed by the downregulation of growth promoting
processes in the leaves during these two early stages of
senescence.
Pearce et al. BMC Plant Biology (2014) 14:368
Page 9 of 23
Table 1 Top significantly enriched ‘Biological Process’ GO terms among upregulated and downregulated genes during
monocarpic senescence in wheat and in the 316 high-confidence GPC-A1- and 224 GPC-B2-regulated genes
Upregulated
Downregulated
GPC1-regulated
GPC2-regulated
Accession
Ontology
Annotated
Significant
Expected
P
GO:0055114
Oxidation-reduction process
3168
171
87.5
2.60E-18
GO:0055085
Transmembrane transport
1622
90
44.8
2.20E-10
GO:0071577
Zinc ion transmembrane transport
20
8
0.55
3.10E-08
GO:0034220
Ion transmembrane transport
369
31
10.19
4.90E-08
GO:0006829
Zinc ion transport
24
8
0.66
1.60E-07
GO:0043562
Cellular response to nitrogen levels
14
6
0.39
1.10E-06
GO:0009064
Glutamine family amino acid metabolic process
65
11
1.8
1.50E-06
GO:0006787
Porphyrin-containing compound catabolic process
76
11
2.1
7.40E-06
GO:0033015
Tetrapyrrole catabolic process
76
11
2.1
7.40E-06
GO:0051187
Cofactor catabolic process
76
11
2.1
7.40E-06
GO:0015979
Photosynthesis
502
123
11.06
<1e-30
GO:0009765
Photosynthesis, light harvesting
76
47
1.67
<1e-30
GO:0019684
Photosynthesis, light reaction
340
69
7.49
<1e-30
GO:0006091
Generation of precursor metabolites and energy
774
78
17.06
1.70E-29
GO:0033014
Tetrapyrrole biosynthetic process
183
30
4.03
9.60E-18
GO:0015977
Carbon fixation
45
17
0.99
3.40E-17
GO:0006779
Porphyrin-containing compound biosynthetic process
161
27
3.55
2.30E-16
GO:0015995
Chlorophyll biosynthetic process
122
23
2.69
2.80E-15
GO:0033013
Tetrapyrrole metabolic process
262
31
5.77
3.20E-14
GO:0055114
Oxidation-reduction process
3168
134
69.81
5.50E-14
GO:0005385
Zinc ion transmembrane transporter activity
29
13
0.14
2.00E-23
GO:0046915
Transition metal ion transmembrane transmembrane activity
68
13
0.32
7.80E-18
GO:0072509
Divalent inorganic cation transmembrane activity
95
13
0.44
7.80E-16
GO:0046873
Metal ion transmembrane transporter activity
317
15
1.48
3.00E-11
GO:0022890
Inorganic cation transmembrane transport activity
472
15
2.21
7.20E-09
GO:0022891
Substrate-specific transmembrane transport
1016
20
4.76
6.60E-08
GO:0015075
Ion transmembrane transporter activity
911
18
4.26
3.00E-07
GO:0022892
Substrate-specific transporter activity
1132
20
5.3
3.70E-07
GO:0008324
Cation transmembrane transporter activity
647
15
3.03
4.30E-07
GO:0005215
Transporter activity
1989
26
9.31
1.90E-06
GO:0009834
Secondary cell wall biogenesis
17
2
0.03
0.00041
GO:0009832
Plant-type cell wall biogenesis
52
2
0.09
0.00382
GO:0007017
Microtubule-based process
379
4
0.67
0.00446
GO:0006812
Cation transport
948
6
1.67
0.00623
GO:0071669
Plant-type cell wall organization or biogenesis
69
2
0.12
0.00664
GO:0006811
Ion transport
1285
7
2.27
0.00701
GO:0007029
Endoplasmic reticulum organization
5
1
0.01
0.00879
GO:0015801
Aromatic amino acid transport
5
1
0.01
0.00879
GO term analysis among the 321 high-confidence
GPC-A1-regulated genes showed a significant enrichment of categories similar to the patterns observed for
loci upregulated during senescence, with the ten most
significantly enriched terms all relating to transporter activity (Table 1). Although transporter functions were
also enriched among the 224 high-confidence GPC-B2regulated genes, several unrelated terms were also enriched
Pearce et al. BMC Plant Biology (2014) 14:368
in this class but not in the GPC-A1-regulated class, including genes with putative roles in cell wall biogenesis and
microtubule organization.
The closer similarity in GO term enrichment between
senescence-regulated loci and GPC-A1-regulated genes
than with GPC-B2-regulated genes is consistent with the
greater overlap between senescence-regulated and GPCregulated loci (64.2% overlap for GPC-A1 vs. 37.1%
overlap for GPC-B2, Figure 3, c and d) and with the relatively stronger effect of the gpc-A1 mutation on senescence and nutrient transport relative to the gpc-B2
mutation (Figure 1, a-d). Taken together, these results
suggest that GPC-A1 plays a more important role than
GPC-B2 in the regulation of genes controlling the early
stages of monocarpic senescence in wheat.
Identification and expression analysis of wheat
transporter genes
To categorize the wheat transporters upregulated during
senescence and to determine the role of GPC1 in their
regulation, we identified specific wheat homologues of
Fe and Zn transporters previously characterized in other
plant species and determined their expression profiles
both among different time points during senescence and
between GPC genotypes.
Chloroplastic transporters
Among genes previously known to be involved in the
reduction-based import of Fe into the chloroplasts, we
identified two FRO genes in Triticum aestivum (Ta),
one of which, TaFRO1, was highly expressed at HD
and significantly downregulated during senescence in
WT plants (Table 2). By comparison, TaFRO2 expression was lower, and although its expression also fell
during senescence, differences between time points were
not significant. Neither gene was significantly DE among
genotypes.
Among genes previously known to promote the export
of nutrients from the chloroplast to the cytoplasm, we
identified five T. aestivum members of the Zn/Co/Cd/
Pb-transporting class of HMA genes (see phylogeny
in Additional file 1: Figure S6). Two of these genes,
TaHMA2 and TaHMA2-like, which showed the highest
similarity to OsHMA2 (Additional file 1: Figure S6), were
significantly upregulated during senescence, both showing >6-fold increases in expression between HD and 22
DAA (Table 2). Furthermore, TaHMA2-like expression
was significantly reduced in both gpc mutants, implicating a role for GPC in its regulation. Two other genes,
TaHMA1 and TaHMA-like1 which are both similar to
OsHMA1 (Additional file 1: Figure S6), were not DE
during senescence and a third, TaHMA3, was not detected at any time point in this study.
Page 10 of 23
Vacuolar transporters
Two VIT transporters, which promote Fe and Zn import
in to the vacuole, were previously characterized in rice
[13]. Both of the corresponding wheat homologues of
these genes were downregulated ~4-fold during senescence, but these differences were not significant according to our stringent differential expression criteria
(Table 2). Furthermore, neither gene was DE in either of
the gpc mutant genotypes (Table 2).
Eight wheat ZIFL genes, thought to promote vacuolar
sequestration of Zn [14], were identified and annotated in this study (see phylogeny in Additional file 1:
Figure S7). Two TaZIFL genes (TaZIFL2 and TaZIFL9)
were expressed at negligible levels in all time points included in this study and were excluded from further
analyses (Table 2). Among the six TaZIFL genes which
showed higher levels of expression during senescence,
TaZIFL2-like1 and TaZIFL3 were significantly upregulated
during senescence while TaZIFL1 was significantly downregulated. Interestingly, although it was not upregulated
during senescence, TaZIFL7 expression was significantly
higher in WT plants than in both gpc mutants (Table 2).
Among the genes known to promote Fe export from
the vacuole to the cytoplasm, eight NRAMP genes were
recently described in wheat [7]. Five of these genes
showed very low levels of expression in flag leaves during the time points included in our study, suggesting
that they may play more important roles during other
developmental stages or in other tissues. Of the three
NRAMP genes with higher expression levels during senescence, TaNRAMP3 and TaNRAMP7 both exhibited
stable expression, but TaNRAMP2 was significantly upregulated, showing a ~5-fold increase in expression
between HD and 22 DAA (Table 2). No significant differences among genotypes were detected for any of the
NRAMP genes.
Plasma-membrane transporters
After being transported into the cytoplasm, Zn and Fe
must be loaded into the phloem for their transport to
different sink tissues, including the grain. In rice and
barley, the YSL and ZIP gene families appear to play a
prominent role in this process.
We identified a total of 14 YSL genes within available
wheat databases (see phylogeny in Fig S8), but one of
these genes is likely a pseudogene (Table 2). Among the
functional YSL genes, TaYSL6 and TaYSL9 were significantly upregulated during senescence and TaYSL18 was
significantly downregulated (Table 2). Although not DE
during senescence, TaYSL12 expression was significantly reduced in the gpc-A1/gpc-B2 mutant compared
to the WT.
The largest transporter gene family described in this
study is the ZIP family, with a total of 19 wheat genes
Pearce et al. BMC Plant Biology (2014) 14:368
Page 11 of 23
Table 2 Wheat transporters and their expression during senescence
Transporter
Rice
WT counts*
Differential expression**
Wheat
Chromosome
IWGSC ID
HD
12D
22D
OsFRO1
TaFRO1
2AL
Traes_2AL_2A274FDB8
40,148
22,892
16,515
2BL
Traes_2BL_C7CDCB39A
48,913
30,272
13,838
OsFRO2
TaFRO2
2AL
Traes_2AL_7E818894E
3
1
6
OsHMA1
TaHMA1
Senescence
gpc-A1
gpc-A1/B2
⬆
⬆
Chloroplastic
transporters
OsHMA2
OsHMA3
2BL
Traes_2BL_E11AA2D03
49
8
9
7AL
Traes_7AL_84D5BAE85
1,143
1,256
1,249
⬇
7BL
Traes_7BL_041308E74
674
614
600
TaHMA1-like
5AL
Traes_5AL_C89EEBE50
1
2
1
5BL‡
Traes_5BL_F83C809F0
74
78
116
TaHMA2
7AL
Traes_7AL_8304348B7
125
328
1,079
⬆
7BL
Traes_7BL_C46BC291C/
Traes_7BL_8C24C1025
185
356
1,205
⬆
TaHMA2-like
7AL
Traes_7AL_6AE850114
13
75
188
⬆
7BL
Traes_7BL_0CF58CF4E
2
13
17
⬆
TaHMA3
5BL
Traes_5BL_D6C3DC326
-
-
-
TaVIT1
2AL
Traes_2AL_A3A25F40E
59
44
36
2BL
Traes_2BL_54954138A
74
61
54
Vacuolar
transporters
OsVIT1
OsVIT2
TaVIT2
5BL
Traes_5BL_7CE3EDE29
1,938
566
450
OsNRAMP1
TaNRAMP1
7AL
Traes_7AL_76159C6DA
-
-
-
OsNRAMP2
TaNRAMP2
OsNRAMP3
TaNRAMP3
OsNRAMP4
TaNRAMP4
OsNRAMP5
TaNRAMP5
None
TaNRAMP6
OsNRAMP7
TaNRAMP7
None
TaNRAMP8
OsZIFL1
TaZIFL1
OsZIFL1
TaZIFL1-like1
7BL
Traes_7BL_03741F576
3
6
1
4AS
Traes_4AS_BBF51CA2E
437
927
3,607
4BL
Traes_4BL_C6A3F5C8A
637
743
2,252
7AL
Traes_7AL_08B2A7BB2
640
704
469
⬆
7BL
Traes_7BL_CA6B7C9E6
551
571
352
6AS
Traes_6AS_B9B4AD633
1
1
1
6BS
N/A
3
5
5
4AS
Traes_4AS_5D4904831
6
2
2
4BL
Traes_4BL_04B01EA0C/
Traes_4BL_CFD804098
4
2
2
3AS
Traes_3AS_538630B00
-
-
-
3B
Traes_3B_73F0469A5
10
9
19
5AS
Traes_5AS_213BE4D84
215
176
151
5BS
Traes_5BS_DE1CD2DA4
127
88
103
4AL
Traes_4AL_2E796609C
-
-
-
4BS
Traes_4BS_9337E9B2F
-
-
-
3AS
Traes_3AS_C25151458
378
73
19
⬇
3B
Traes_3B_BD45F6269/
Traes_3B_45F864939
249
45
5
⬇
3AS
Traes_3AS_02DE247DA
125
136
84
3B
Traes_3B_92383792E/
Traes_3B_B76607C0E
70
76
59
Pearce et al. BMC Plant Biology (2014) 14:368
Page 12 of 23
Table 2 Wheat transporters and their expression during senescence (Continued)
OsZIFL2
TaZIFL2
5BL
Traes_5BL_A0B9DE62E
1
2
2
OsZIFL2
TaZIFL2-like1
3AS
Traes_3AS_E59FB52EC
8
31
32
3B
Traes_3B_EDFDD5A12
167
305
383
None
TaZIFL3
4AL
Traes_4AL_4231650FC/
Traes_4AL_470869233
183
218
171
4BS
Traes_4BS_1DCF82CB7
525
1,019
743
None
TaZIFL7
5AL
Traes_5AL_37BFFFD9E
397
392
249
5BL
Traes_5BL_6E4AE0146
130
108
48
None
TaZIFL8
4AL
Traes_4AL_5C7A4DA54
21
19
13
4BS
Traes_4BS_44732F50F
141
112
160
None
TaZIFL9
5AL
Traes_5AL_0599F7BC5
-
-
-
5BL
N/A
-
-
-
3AS
Traes_3AS_FB4110335
10
7
8
3B
Traes_3B_17BC3E1E2
1
1
1
6AL
Traes_6AL_850660AC3
56
35
53
6BL
Traes_6BL_3DD0BA741
51
61
62
2AL
Traes_2AL_7B0F93F84
364
526
986
2BL
Traes_2BL_0CBCC13AD
68
101
203
2AL
Traes_2AL_CFCA01C76
725
995
1,517
2BL
N/A
15
18
28
⬆
⬆
⬆
⬆
Plasma membrane transporters
OsYSL1
OsYSL2
OsYSL6
OsYSL9
TaYSL1
TaYSL2
TaYSL6
TaYSL9
OsYSL10
TaYSL10
6AL
Traes_6AL_5642D5B44
42
46
35
OsYSL11
TaYSL11
2AL
Traes_2AL_377C8CDEA
0
0
0
2BL
Traes_2BL_68E0CA743
3
5
3
OsYSL12
TaYSL12
2AL‡
Traes_2AL_CC6133527
554
701
1,389
2BL
Traes_2BL_2BE05F104
437
563
454
OsYSL13
TaYSL13
2AL
Traes_2AL_F707FF2C3.3
14
20
75
OsYSL14
OsYSL15
2BL
Traes_2BL_A14EA5AE4
1
1
3
TaYSL13-like
2BL
Traes_2BL_A14EA5AE4
7
19
85
TaYSL14
6AL
Traes_6AL_7FB45D4DE
814
894
733
6BL
Traes_6BL_7FFC46B84
500
628
493
6AL
Traes_6AL_E36FCEF64
523
486
969
6BL
Traes_6BL_D65EC1432
88
95
199
1AL
Traes_1AL_C6A0E255E
4
7
9
1BL
Traes_1BL_CA93E6359
2
2
2
TaYSL15
TaYSL15-like
⬆
⬆
⬇
OsYSL16
TaYSL16
2BL
Traes_2BL_4A1181B731
2,736
2,361
2,011
None
TaYSL18
2AL
Traes_2AL_2F91AF932
225
144
84
2BL
Traes_2BL_6C5206B6D
531
499
510
OsIRT1
TaIRT-like1
4AL
Traes_4AL_9D79BE8FB
5
7
10
4BS
Traes_4BS_6527BBD54
8
6
7
OsIRT2
TaIRT-like 2
4AL
Traes_4AL_9F6B106F3
9
21
30
OsZIP10
TaZIP10
7AL
Traes_7AL_A13A246B4
333
596
531
⬆
⬆
7BL
Traes_7BL_E5CFC3DCE/
Traes_7BL_5C965DB64
267
531
482
⬆
⬆
⬇
⬆
Pearce et al. BMC Plant Biology (2014) 14:368
Page 13 of 23
Table 2 Wheat transporters and their expression during senescence (Continued)
OsZIP10
OsZIP8
TaZIP10-like1
7AL
Traes_7AL_F1D611563/
Traes_7AL_893DEB3EB
7
229
279
⬆
⬆
⬆
7BL
Traes_7BL_12C63350C
5
654
647
⬆
⬆
⬆
TaZIP13-like1
6BS
Traes_6BS_7D630200B
2
2
2
TaZIP13-like2
2AS
Traes_2AS_4CA7607E5
277
4,469
3,207
⬆
⬆
⬆
⬆
⬆
⬆
⬆
⬆
⬆
2BS
Traes_2BS_9D8F265EC
79
916
787
TaZIP13-like3
2AL
Traes_2AL_BE05B34FF
125
129
135
2BL
Traes_2BL_A1BCBD2BE
102
1,613
1,466
OsZIP1
TaZIP1†
3AL
Traes_3AL_DC3D5F65E
2
1
4
3B
Traes_3B_3C18D89F8
3
4
8
OsZIP2
TaZIP2†
5BL
N/A
17
9
9
OsZIP2
TaZIP2-like
6AS
Traes_6AS_75C6428051
-
-
-
6BS
N/A
73
65
34
2AL
Traes_2AL_3983FD077
21
115
138
2BL
Traes_2BL_23F1C8743
61
130
291
4AS
Traes_4AS_F5F7D2A8D
0
1
3
4BL
Traes_4BL_68691F1FC
10
76
176
1AS
Traes_1AS_A6EF18CC1
527
488
439
1BS
Traes_1BS_B734EDEA7
413
532
478
1AS
Traes_1AS_EC8891094/
Traes_1AS_50323685E
216
606
880
1BS
Traes_1BS_D68F0BED6
317
1,194
1,566
1AS
Traes_1AS_7DC2CB902
378
357
519
1BS
N/A
193
186
281
6AS
Traes_6AS_4E1D574BC
322
354
332
6BS
Traes_6BS_147BF2D07
726
678
513
3AS
Traes_3AS_F46E02204/
Traes_3AS_15A221AD0
97
77
103
OsZIP3
OsZIP5
OsZIP6
TaZIP3†
TaZIP5
TaZIP6†
OsZIP7
TaZIP7†
OsZIP11
TaZIP11
OsZIP13
TaZIP15
OsZIP14
TaZIP14†
OsZIP16
TaZIP16
3B
Traes_3B_B7D3B69FD
229
192
213
7AL
Traes_7AL_DFE86911E
15
14
9
7BL
Traes_7BL_2637B2942/
Traes_7BL_EB231D8FF
12
13
6
2AS
Traes_2AS_D50EEDA84
2
5
4
⬆
⬆
⬆
⬆
⬆
⬆
⬆
⬆
⬆
⬆
⬆
⬆
⬆
PS biosynthesis genes
OsNAS1
TaNAS1
2BS
N/A
121
117
117
OsNAS3
TaNAS3
2AS
Traes_2AS_DEDC612AE/
Traes_2AS_452FED53F
2,056
2,694
4,495
2BS
Traes_2BS_CB79BAFB1
5,362
5,109
7,789
OsNAAT1
TaNAAT1
1AL
Traes_1AL_9D6B86169
47
88
102
OsNAAT1
TaNAAT2
1AL
Traes_1AL_BCD7C5B8B
127
280
269
1BL
Traes_1BL_D8276D3DB
188
453
602
4AS
Traes_4AS_887399584
27
26
17
4BL
N/A
1222
883
1134
OsDMAS1
TaDMAS1
⬆
⬆
⬆
⬆
⬆
⬆
⬆
⬆
⬆
† Source: Tiong et al. [21]. All NRAMP genes from Borrill et al. [7]. TaDMAS from Bashir et al. [26]. ‡ Predicted non-functional protein.
*Counts are normalized values of reads uniquely mapped to the genomic loci corresponding to each wheat transporter gene. **Arrows indicate whether the gene
was significantly upregulated (⬆) or downregulated (⬇) during senescence in WT plants or in WT vs. gpc-A1 or WT vs. gpc-A1/gpc-B2 comparisons (⬆ = significantly
higher in WT).
Pearce et al. BMC Plant Biology (2014) 14:368
identified (see phylogeny in Additional file 1: Figure S9),
including seven which had been described previously
[21]. This family also includes the Iron Regulated Transporter (IRT) genes, which share high similarity to the
ZIPs. One gene (TaZIP13) was absent from the genomic
reference so was excluded from the analysis, but five of
the remaining 18 TaZIP genes were significantly upregulated during senescence (Table 2). Some of these genes
showed very large increases in expression between time
points. For example, TaZIP3 was upregulated 5-fold and
TaZIP5 8-fold between HD and 12 DAA (Table 2). Strikingly, the expression of all five of these upregulated
genes, as well as TaZIP10 and TaZIP5, was significantly
higher in WT plants than in either gpc mutant genotype.
Additionally, TaIRT2 expression was significantly lower
in the gpc-A1/gpc-B2 mutant than in the WT. These
results strongly implicate a role for GPC1 in the regulation of the ZIP family of transporters during senescence
(Table 2).
Phytosiderophore biosynthesis genes
Since the association of Zn and Fe with PS chelating ligands facilitates their transport through the phloem, we
searched for wheat homologs of genes encoding enzymes acting in the PS biosynthetic pathway (Figure 1).
Searches of available wheat genomic databases yielded
two TaNAS, two TaNAAT and one TaDMAS genes.
Expression of TaNAS3 more than doubled between 12
DAA and 22 DAA, (although this difference was not significant according to our criteria) and was significantly
reduced in gpc-A1/gpc-B2 mutant compared to the WT
(Table 2). In contrast, TaNAS1 was expressed at much
lower levels and did not vary during senescence or
among genotypes (Table 2).
Both of the identified wheat NAAT genes were upregulated during senescence, although only for TaNAAT2
was this significant (Table 2). Interestingly, TaNAAT2
was upregulated at an earlier stage than TaNAS3, since
its expression doubled between HD and 12 DAA and
remained stable thereafter (Table 2). The expression of
both TaNAAT genes was significantly lower in both gpc
mutant genotypes, suggesting a role for GPC in the
regulation of this class of gene. The third PS biosynthesis
gene, TaDMAS was not DE at any stage of senescence or
in any of the genotype comparisons (Table 2).
As a technical control, we developed qRT-PCR assays
for six transporter genes which were significantly DE between WT and gpc mutants. For all six genes, we obtained results that were consistent with the expression
profiles determined by RNA-seq. Results from both
analyses are presented side by side in Additional file 1:
Figure S10.
To look for additional transporters, we further explored the group of 1,054 genes that were significantly
Page 14 of 23
upregulated between HD and 12 DAA in the WT plants
but not in the gpc-A1 mutants. This dataset included 33
genes with annotated transporter function which were also
significantly different among genotypes (P < 0.05), 11 of
which were members of the characterized transporter families described above (Additional file 1: Table S5). The
remaining 22 genes included members of other transporter
families, including one potassium transporter (AKT2), two
sulfate transporters, one ABC transporter and a gene encoding a ferritin protein, involved in Fe storage (Additional
file 1: Table S5). The differential regulation of the potassium and sulfate transporters is particularly interesting
given the significant differences in K and S concentrations
in the grain detected between WT and both gpc-A1 and
gpc-A1/gpc-B2 mutants (Additional file 1: Table S1).
Taken together, our results suggest that the onset of
monocarpic senescence in wheat is associated with broad
transcriptional changes involved in nutrient remobilization. These processes included the export of Zn and Fe
from chloroplasts and vacuoles (upregulation of NRAMP
and HMA and downregulation of FRO, VIT and one ZIFL
gene), upregulation of trans-membrane transporter genes
responsible for loading nutrients into the phloem (ZIP
and YSL), and upregulation of PS biosynthesis genes
(NAS, NAAT) to facilitate transport of these nutrients
through the phloem. Among these changes, the GPC genes
seem to play a limited role in the regulation of vacuolar
and chloroplastic transporter genes, but have a clear role
in the upregulation of both PS biosynthesis genes and
transmembrane transporters, with a particularly prominent
role in regulating members of the ZIP gene family.
Discussion
In annual grasses, senescing leaves are an important
source of Zn and Fe for the developing grain. When the
transport mechanisms between these tissues are disrupted,
as in the gpc mutants and GPC-RNAi transgenic plants described in this and previous studies [5,44,46], concentrations of Zn and Fe in the grain are significantly reduced.
We used RNA-seq to characterize the overall transcriptional changes in senescing flag leaves in WT and gpc mutant plants. We identified several Zn and Fe transporter
genes activated during these early stages of senescence and
describe their regulation by the GPC genes.
Applying RNA-seq to polyploidy wheat
One challenge for genomic studies in polyploid species is
the difficulty in distinguishing highly similar homoeologous
genomes (~97% identical between A and B wheat genomes
within protein-coding regions). Although different approaches to separate homoeologous sequences have been
applied (e.g. Krasileva et al. [49]), it remains difficult to fully
resolve chimeric assemblies. We overcame this problem in the current study by using the recently-released
Pearce et al. BMC Plant Biology (2014) 14:368
genomic draft sequence of wheat chromosome arms from
the IWGSC as our RNA-seq mapping reference [48]. To
generate the genomic draft sequence, wheat chromosome arms were first separated by flow cytometry, so each
arm was sequenced and assembled separately, resulting in
homoeolog-specific reference sequences.
At the time of our analysis, this genomic reference
lacked any gene annotation so we first identified genomic ranges, which are defined by one or more overlapping transcripts (described in Methods). A large
proportion of our reads mapped to these expressed loci
(>93%), indicating that they include a good representation of the expressed portion of the wheat genome. Recently, the IWGSC annotated 65,776 high-confidence
protein-coding genes in the A and B chromosome arms
[48], 48,657 (74.0%) of which overlapped with loci identified in our study. The corresponding IWGSC loci and gene
names for each matching locus are provided in Additional
File 1. A small number of sequencing reads (average
209,660 reads per sample) mapped within genomic ranges
defined by the 17,119 IWGSC loci not identified in our annotation, and were not included in the current study.
The use of a homoeolog-specific genomic reference instead of a transcriptome reduced mapping ambiguity in
two ways; firstly by eliminating chimeric assemblies of
similar homoeologous sequences, and secondly by collapsing multiple transcribed variant sequences into a single genomic locus in the reference, thus eliminating
redundancy and increasing mapping specificity. This approach combines the expression of alternative splicing
forms, which we consider appropriate for this initial
study. A relatively high proportion of these reads were
mapped uniquely (58.5%), and only these reads were
used for our differential expression analyses, thus maximizing the accuracy of these analyses.
The role of GPC1 and GPC2 during monocarpic senescence
Previous studies have demonstrated that transgenic plants
expressing an RNAi construct targeting all copies of
GPC1 and GPC2 exhibit a significant delay in senescence
and reduced levels of Zn, Fe and protein in the grain, due
to a disruption in their transport [5,44]. In the current
study, we also detected a marginally significant reduction
in TKW and in dry spike weight during grain filling associated with the gpc1 mutant genotype. Interestingly, these
differences were evident even from the early stages of senescence (35 DAA, Additional File 1: Figure S2b) suggesting that the GPC genes may also affect the rate of grain
filling. Although the differences in spike weight between
genotypes decreased with time, they were still significant
at the end of the grain filling period (Additional file 1:
Figure S2a). The high spring temperatures characteristic
of the Mediterranean environments used in our studies,
may have contributed to the lower kernel weight of the
Page 15 of 23
gpc mutant lines that matured during periods of higher
temperature than the WT lines.
It was previously unknown whether GPC genes regulated the induction of the overall senescence process, or
whether they regulated just a subset of the genes differentially regulated during this developmental stage. Also
unclear was the time within the senescence process
when the GPC genes have their strongest effect, or the
extent of functional overlap between GPC1 and GPC2
paralogs. Results from our study provide insights into all
three of these questions.
Comparing senescence- and GPC-regulated genes
To answer the first question, we investigated the overlap
between senescence and GPC regulated genes. Of the
3,888 loci DE during senescence in WT plants, only
21.2% also showed significant differences in expression
between GPC genotypes (Figure 3, c and d). In addition,
within the senescence-regulated genes the subset regulated by the GPC genes showed different proportions of
expression categories compared to the complete senescence set (Figure 4, b-d). Whereas more than 60% of
GPC-regulated genes in this set exhibited an ‘Up-Down’
expression profile, the proportion in all senescenceregulated genes was 20%. Conversely, the proportion of
genes exhibiting an ‘Up-Up’ expression profile and those
falling into any of the downregulated classes were 9–10
fold more abundant among senescence-regulated genes
than the subset regulated by GPC genes (Figure 4, b-d).
These results support the hypothesis that the GPC genes
regulate a specific subset of genes during monocarpic senescence rather than triggering the overall transcriptional
regulatory cascade associated with this developmental
stage. The disruption of the regulation of this subset of
senescence-regulated genes in the gpc mutants is likely sufficient to generate bottlenecks in the senescence process,
as demonstrated by the overall delay in senescence observed in these mutant genotypes (Figure 2).
GPC-regulated genes at different time points
In a PCA analysis based on the expression of all genes, the
differences between WT and gpc mutant genotypes were
much clearer at 12 DAA than at either HD or 22 DAA
(Additional file 1: Figure S4, a-c). This is consistent with
our finding that the majority of GPC-regulated genes
(76.1%) were detected at 12 DAA. These results suggest
that, despite the continued increase in GPC expression between 12 DAA and 22 DAA (Additional file 1: Figure S5),
most of the regulatory effects of the GPC genes on the DE
of downstream genes occur within the first 12 DAA.
Comparison between GPC1 and GPC2 regulated genes
The paralogous genes GPC1 and GPC2 share 91% similarity at the DNA level and have almost identical expression
Pearce et al. BMC Plant Biology (2014) 14:368
profiles during the early stages of senescence (Additional
file 1: Figure S5). Therefore, some functional overlap between these genes was expected. Among the three pairwise
comparisons among genotypes (Figure 3b), the largest category includes the 1,349 DE genes detected between the
WT and the gpc-A1/gpc-B2 mutant, that were not among
the GPC-A1-specific (WT vs. gpc-A1) or GPC-B2-specific
(gpc-A1/gpc-B2 vs. gpc-A1) DE genes. This category most
likely includes genes that are redundantly regulated by
GPC-A1 and GPC-B2, but that are significant only when
both genes are absent. Combining these 1,349 genes with
the 31 which are DE in both GPC-A1-specific and GPCB2-specific comparisons (Figure 3b), we conclude that approximately two-thirds of the GPC-regulated genes (64.8%)
showed some level of redundancy in their regulation by
GPC-A1 and GPC-B2. This result parallels the similar proportion of ‘Up-Down’ regulated genes among the high
confidence GPC-A1- and GPC-B2-regulated genes (63.5%
and 62.5%, respectively, Figure 4, c and d).
However, the remaining one-third of the loci DE among
genotypes were regulated either by GPC-A1 (489) or by
GPC-B2 (261), suggestive of some level of functional divergence. This was apparent in the differences between
classes in expression profiles during senescence. Both sets
of genes showed a strong enrichment for ‘Up-Down’
regulated genes, but the second most abundant category was ‘Up-Flat’ in the GPC-A1-regulated genes (24.7%)
and ‘Down-Up’ in the GPC-B2-regulated genes (26.0%,
Figure 4, c and d). These results suggest that GPC-A1
acts principally to upregulate genes during the early
stage of senescence (WT to 12 DAA), whereas GPC-B2,
in addition to its role in the upregulation of a number
of genes, also targets a subset of genes for downregulation during the same period.
Distinctions between GPC-A1- and GPC-B2-regulated
genes were also apparent in their putative functions
identified in the GO analysis and in their respective
overlap with senescence-regulated genes. The proportion
of GPC-A1-regulated genes that were also regulated by
senescence (64.2%) was almost double the corresponding
proportion of GPC-B2-regulated genes (37.1%, Figure 3,
c and d). Moreover, putative functions of the senescence
regulated genes were more similar to the functions of
GPC-A1-regulated genes than to those regulated by
GPC-B2. Whereas both senescence-regulated and GPCA1-regulated genes were significantly enriched for transporter function (see section below), such enrichment was
less evident among the GPC-B2-regulated genes. Instead,
this class was enriched for genes with putative roles
in plant cell wall biogenesis, microtubule organization
and other processes distinct from those found in the
senescence-regulated genes.
These results are consistent with the stronger effect
of gpc-A1 knockout mutants on senescence and nutrient
Page 16 of 23
translocation profiles in the current study (Figure 1, a-d)
and with the strong effect seen on these phenotypes in
gpc1-null mutants in hexaploid wheat [46]. One caveat of
this comparison is that while the gpc-A1 mutation in the
tetraploid variety ‘Kronos’ represents a true gpc1-null allele
(because of the natural non-functional mutation in GPCB1 in this variety), the gpc-B2 mutant likely alters the dosage of GPC2 but does not result in a gpc2-null mutant
(because of the presence of an intact and expressed copy
of GPC-A2). No gpc-A2 truncation mutant was found in
our current tetraploid TILLING population, but we are
currently transferring a gpc-A2 premature stop codon mutant found in our hexaploid wheat TILLING population
[50] into Kronos. The lack of a gpc-A2 truncation mutant
in this study does not affect the interpretation of the GPCB2 regulated genes, but may have resulted in an underestimation of the number of genes regulated by GPC2.
Despite the high sequence similarity of GPC1 and GPC2
and their common expression profiles in the wheat flag
leaf during monocarpic senescence, these genes appear to
have diverged to regulate different sets of downstream targets. The closest rice ortholog to the wheat GPC genes is
Os07g37920 which maps to a region of the genome collinear to GPC2 [51]. This suggests that GPC2 is the ancestral
gene and that GPC1 originated from a duplication event
specific to the wheat lineage [51]. However, the downregulation of Os07g37920 by RNAi, or its overexpression in
transgenic rice plants, did not affect the rate of senescence. The only difference observed in Os07g37920-RNAi
rice plants was male sterility caused by the inability of the
anther to dehisce and release pollen [51]. These results
suggest that the specialization of GPC1 on the regulation
of transporters during senescence, and its stronger effect
on the rate of senescence, are likely derived characteristics
acquired by GPC1 after its duplication to its nonorthologous location on the short arm of homoeologous
group 6 chromosomes.
A recent study showed that the rice gene OsNAP, a close
paralogue of Os07g37920 and of wheat GPC1, has a strong
effect on senescence ([52], PNAS 111: 10013–10018).
In summary, the results described in this section indicate
that the GPC genes regulate a subset of senescenceregulated genes that are mainly upregulated during the
early stages of monocarpic senescence (first 12 DAA). Although most GPC-regulated genes are affected by both
paralogs, GPC1 seems to play a stronger role than GPC2 in
the regulation of a subset of genes involved in senescence
that includes enrichment for transporter gene function.
However, in the absence of a complete knockout of GPC2,
we cannot fully determine the role of GPC2 in monocarpic
senescence. The importance of GPC1 in the regulation of
senescence is highlighted by the finding that among the
1,298 genes upregulated in the WT between HD and 12
DAA 1,054 were not upregulated in the gpc-A1 mutant.
Pearce et al. BMC Plant Biology (2014) 14:368
Effect of GPC genes on previously characterized genes
involved in transport
To complement the top-down analyses discussed above,
we also characterized the effect of GPC and senescence
on the expression of nine gene families previously shown
to play important roles in nutrient remobilization in
other plant species. The discussion of these genes is
organized according to their involvement in different transport processes.
Chloroplast to cytoplasm
Our results demonstrate that the early stages of monocarpic senescence in the flag leaf are associated with a
large-scale downregulation of genes involved in photosynthetic processes (Table 1). Therefore, the downregulation of TaFRO1, which is likely involved in the import
of Fe into the chloroplast is not surprising. Studies in
model species have demonstrated that some members of
the FRO family localize to the chloroplast membrane
and act in the reduction-based import of nutrients into
the chloroplast [9,10]. In rice, OsFRO1 transcript levels
are negatively correlated with Zn and Fe levels in the
rice grain [53].
By contrast, we observed a significant upregulation of
two wheat members of the HMA transporter family during senescence which have been implicated in Zn and Fe
export from the chloroplast to the cytoplasm [12]. The
expression of one of these genes, TaHMA2-like, was also
significantly higher in WT plants than either gpc-A1 or
gpc-A1/gpc-B2 mutants, which may contribute to the
reduced efficiency in Zn and Fe remobilization observed in these mutants. The rice ortholog of this gene,
OsHMA2, was shown to play an important role in facilitating Zn transport to the rice panicle [54]. These results
suggest that nutrient remobilization from the chloroplasts to the cytoplasm for future export to the grain is
an early step in wheat monocarpic senescence.
Vacuole to cytoplasm transport
Another sink for Zn and Fe during vegetative development is the vacuole, which is utilized as a storage body
to prevent plant cell toxicity associated with excess concentrations of these nutrients. In other plant species,
VIT and ZIFL transporters have been shown to facilitate
nutrient import into the vacuole, while NRAMP transporters have been implicated in Fe export from the
vacuole to the cytoplasm. In our study, the expression of
both identified wheat VIT genes fell during monocarpic
senescence, with TaVIT2 showing a ~4-fold reduction
between HD and 22 DAA. However, these differences
were not significant for all four statistical tests and were
excluded from our DE list. In rice, both OsVIT1 and
OsVIT2 proteins localize to the tonoplast and can transport Zn2+ and Fe2+ across this membrane as part of a
Page 17 of 23
vacuolar sequestration strategy [13]. Mutants with reduced
or abolished function of both these genes exhibit reduced
Zn and Fe concentrations in the leaves coupled with increased levels in the grains, suggesting that a downregulation of these genes during senescence contributes to
increased rates of Zn and Fe translocation [13,55].
The ZIFL family of transporters is also thought to
function in the vacuole. One such transporter in Arabidopsis was implicated in Zn sequestration to the vacuole
in vegetative tissues [14], while in barley, a ZIFL-like
gene is expressed in the aleurone layer of seeds and is
induced in the embryo upon foliar Zn application and
has been implicated in the regulation of Zn transport to
the grain [56]. These potentially distinct roles of the different ZIFL genes may explain the differences in transcription profiles observed in this study. TaZIFL1 was
significantly downregulated during senescence, whereas
TaZIFL2-like1 and TaZIFL7 were significantly upregulated. The rice orthologs of these genes (OsZIFL2 and
OsZIFL7) are both upregulated in flag leaves during senescence suggesting that they may promote Zn remobilization during senescence [15]. OsZIFL1 expression was
not detected in rice flag leaves at any stage of development.
Further studies will be required to better characterize the
function of ZIFL transporters in wheat.
None of the eight NRAMP genes identified in wheat
were DE between WT and gpc mutants and only one
(TaNRAMP2) was significantly upregulated during senescence (Table 2). This upregulation during senescence
is consistent with the known function of this class of
transporters, which are thought to facilitate Fe export
from the vacuole when remobilization is required during
development [57]. However, our finding that most of the
wheat NRAMP genes were not DE during wheat senescence suggests that these transporters may act in other
tissues or stages of developmental stages.
In summary, among the genes involved in the transport for Fe and Zn to and from the vacuole only
TaZIFL7 was DE in both gpc mutant genotypes, suggesting a limited effect of the GPC genes in the regulation of
this group of genes. However, it will still be interesting
to investigate the role of TaZIFL7 and of the other three
genes from this group which are DE during senescence.
Cytoplasm to phloem transport
For their transport to the grain, nutrients must cross the
plasma membrane into the phloem. Members of the YSL
and ZIP families are known to play important roles
in the transport of metal-chelate complexes across the
plasma membrane in several plant species (Curie et al.
2009) [19]. In wheat, we identified and characterized 14
and 19 members of the YSL (Additional file 1: Figure S8)
and ZIP (Additional file 1: Figure S9) families, respectively. Two of the wheat YSL genes were upregulated during
Pearce et al. BMC Plant Biology (2014) 14:368
senescence and one was downregulated, suggesting that
they performed different functions (Table 2). However,
there is still little evidence from the literature regarding
YSL function in vegetative Zn and Fe transport, so further
experiments will be required to define their role in wheat.
A much clearer link between GPC1 and Zn and Fe
transport during monocarpic senescence was observed
for members of the ZIP gene family. A total of five
TaZIP genes were upregulated during senescence and
the expression of all five plus TaZIP5 and TaZIP10 was
significantly higher in WT plants than in either gpc-A1
or gpc-A1/gpc-B2 mutant genotypes. TaIRT-like2 was
also DE, but only between WT and the gpc-A1/gpc-B2
double mutant (Table 2). In some cases, the effect was
very large; for example, the expression of both TaZIP3
and TaZIP5 were more than 15-fold higher in WT
plants than either of the gpc mutant genotypes at 22
DAA. These results demonstrate that GPC plays a critical role in the regulation of multiple members of this
family and that ZIP expression is likely to be associated
with the remobilization of Zn and Fe from leaves to
grain in wheat. A recent study in barley demonstrated
that the over-expression of HvZIP7 resulted in increased
Zn accumulation in the grain [21]. The corresponding
wheat homologue, TaZIP7, was also significantly upregulated by GPC during senescence in the current study,
suggesting a conserved role for this transporter. For future biotechnological applications, it will be important
to determine which of these ZIP transporters represents
a limiting step in the remobilization of Zn and Fe from
leaves to the grain.
PS biosynthesis
It has been hypothesized that a critical limiting factor
for nutrient transport to the grain is their solubility in
the alkaline environment of the phloem [30]. To prevent
precipitation, Fe and Zn ions are transported as a complex with organic ligands or chelators, one critical class
of which is the mugineic acid family of PS (Figure 1).
We show in this study that several wheat genes encoding
key biosynthetic enzymes of this pathway are upregulated during senescence and are differentially regulated
by the GPC genes. A significant upregulation in TaNAAT2
expression between HD and 12 DAA and an increase
in TaNAS3 between 12 DAA and 22 DAA suggest an
active and possibly coordinated role of these genes during wheat monocarpic senescence. Both TaNAAT genes
were DE in at least one gpc mutant genotype (Table 2)
suggesting that they might contribute to the reduced
concentrations of Fe and Zn observed in the grains of
the gpc mutant plants. No significant differences were
detected for TaDMAS1.
In the rice phloem, Fe and Zn can associate with both
NA and DMA, although Zn-NA and Fe-DMA complexes
Page 18 of 23
have been shown to be more common [28,29]. NAS overexpression has been shown to result in dramatic increases in both Zn and Fe grain content in rice [33,34],
making the orthologous genes in wheat interesting targets for biofortification strategies. Multiple transgenic
strategies have been successfully applied in rice to increase micronutrient levels in the grain [58], although to
date, such strategies have not been described in wheat.
The characterization of the different transporter gene
families during wheat monocarpic senescence provides
the basic information required to select targets for similar biotechnological approaches in this economically important crop species.
In addition to these well-characterized transporter families, we also identified 22 other transporter-related genes
which were upregulated between HD and 12 DAA in WT
plants, but not in gpc-A1 mutants (Additional file 1:
Table S5). Among these genes, we found one differentially
regulated potassium transporter and two sulfate transporters, which are potentially related to the differences
identified in K and S concentrations in the grain between
genotypes (Additional file 1: Table S1). A similar increase
in K and decrease in S, Zn and Fe concentration was also
observed in the grains of GPC-RNAi transgenic plants
with reduced transcriptional levels of all GPC genes [5,59].
It will be interesting to investigate whether there is a functional connection between the DE of Fe, Zn, S and K
transporters and the effect of the GPC genes on their concentration, in the wheat grain.
Conclusions
In summary, this study confirms that GPC1 plays a
strong role in the regulation of wheat monocarpic senescence, and that it is involved in the upregulation of a
large number of genes during the early stages of wheat
monocarpic senescence. These genes are likely involved
in the plant’s active preparation for the upcoming senescence. Supporting this hypothesis, we found several
transporters and genes involved in the biosynthesis of
chelators that facilitate Zn and Fe transport through the
phloem that were differentially regulated by the GPC
genes. Among these transporters, members of the large
ZIP gene family appear to be interesting targets for biotechnological applications and for screening of different
natural alleles to improve nutrient remobilization.
Methods
Plant material
We previously identified individuals in our tetraploid
Kronos TILLING population which carry mutations introducing premature stop codons in GPC-A1 (W114*, henceforth gpc-A1) and GPC-B2 (W109*, henceforth gpc-B2)
[51]. Since WT Kronos carries a single nucleotide insertion in the coding region of GPC-B1 that results
Pearce et al. BMC Plant Biology (2014) 14:368
in a non-functional protein [44], the gpc-A1 mutant carries
no functional GPC1 genes.
From the transcriptome dataset, we found that
Kronos expresses a GPC-A2 copy which was not previously reported. We developed GPC-A2-specific primers (Forward = 5’–CACCCACCAGCTAGAAGCTC–3’,
reverse = 5’–ATCCATGCAATGGTGATGTG–3’) and confirmed the 2AS chromosome arm location using the
IWGSC genomic sequence database (IWGSC_CSS_2AS_
scaff_5260301). The genomic sequence of GPC-A2 from
Kronos was deposited in GenBank (accession number
KM272993). We screened our tetraploid TILLING population for deleterious mutations in GPC-A2, but did not
find any premature stop codons or splice site mutations.
Therefore, the gpc-B2 mutation alters the dosage of GPC2
transcripts but does not result in a complete loss-offunction for GPC2.
The M3 individuals carrying these TILLING mutations
were backcrossed twice to WT Kronos to reduce the
background mutational load and were combined to create BC2F2 sibling gpc-A1 and gpc-B2 single mutants, as
well as gpc-A1/gpc-B2 double mutant plants and WT
siblings carrying no TILLING mutations. Plants were
grown in the greenhouse under long day conditions and
single, entire flag leaves were harvested from four biological replicates of WT, gpc-A1 and gpc-A1/gpc-B2
plants at HD, 12 DAA and 22 DAA and immediately frozen in liquid nitrogen for RNA-seq library construction.
BC2F3 seeds were harvested for field trials. Seeds from all
three mutant genotypes (gpc-A1 PI 673414, gpc-B2 PI
673413 and gpc-A1/gpc-B2 PI 673415) were submitted to
the Germplasm Resources Information Network (http://
www.ars-grin.gov/npgs/).
Field experiments
During the 2011–2012 growing season, field experiments
to determine the phenotype of the GPC mutants were
carried out in one location in the USA (Davis, CA, UCD2012) and in two locations in Israel (Newe Ya'ar Regional
Research Center, NY-2012 and Tel-Aviv University, TAU2012). During the 2012–13 growing season one experiment was carried out at Newe Ya'ar Regional Research
Center, NY-2013. All experimental plots were arranged in
a randomized complete block design. Full details of planting date, soil components, precipitation, irrigation and
fertilization are provided for each field trial in Additional
file 1: Table S6.
Five traits were evaluated in each field experiment:
1) Dry spike weight: Plants were tagged at anthesis and
spikes were collected at 35, 42 and 49 DAA. There were no
significant differences in anthesis date among genotypes in
any of the field experiments. Spikes were then dried for
48 h at 70°C and the average weight of 10 spikes was determined. 2) Relative chlorophyll content: This parameter was
Page 19 of 23
determined in flag leaves using a hand-held chlorophyll
meter (SPAD-502, Minolta, Milton Keynes, UK) for experiments performed in the USA and a CCM-200 (OptiScience, Hudson, NH) for experiments performed in Israel.
All CCM-200 results were normalized to SPAD values [60].
Each value corresponds to the average of ten readings
across the flag leaf, presented as relative SPAD units.
3) Kernel weight: Completely senesced plants were individually harvested and each spike was threshed separately.
Grains from the tagged main spike were dried to a constant
weight at 70°C and dry weights were obtained and reported
as thousand kernel weight ([total grain weight/ number of
grains]*1000). 4) Grain protein content: this parameter was
measured from mature grain using a grain analyzer-Perten
IM9200 (Perten Instruments AB, H.Q. Stockholm, Sweden)
at the University of California, Davis. Ten biological replicates were used in the UCD-2012 experiment and four
each for NY-2012 and TAU-2012 experiments. 5) Micronutrient determinations: The levels of 11 different micronutrients, including Zn and Fe were measured in the mature,
harvested grain using ICP-MS (Inductively Coupled
Plasma - Mass Spectrometry) (Agilent Technologies, Santa
Clara, CA, USA) at the University of California, Davis. Five
biological replicates of each genotype from the UCD-2012
and TAU-2012 experiments were analyzed.
RNA-seq library construction and sequencing
Flag leaves from four biological replicates of three different genotypes (WT, gpc-A1, and gpc-A1/gpc-B2, BC2F2
generation) were collected at three different time points
(HD, 12 DAA and 22 DAA). Samples were ground to a fine
powder using a pestle and mortar in liquid nitrogen and
RNA samples were extracted using the Spectrum™ Plant
Total RNA Kit (Sigma-Aldrich, St. Louis, MO). Concentration and purity of total RNA was confirmed on a
NanoDrop® ND-1000 spectrophotometer and RNA integrity was evaluated by standard agarose gel electrophoresis.
RNA-seq libraries were constructed using the TruSeq™
RNA sample preparation kit (Illumina, San Diego, CA)
and their quality determined by running samples on a
high-sensitivity DNA chip on a 2100 Bioanalyzer (Agilent
Technologies, Santa Clara, CA). For each of the four biological replicates, the nine genotype/time point samples
were tagged with a unique index to allow multiplexing and
were sequenced in three lanes on an Illumina HiSeq2000
sequencer, using the 50 bp single read module at the UC
Davis Genome Center (total 12 Illumina lanes for the 36
samples). On average we obtained 36.6 M raw reads per
sample (Additional file 1: Table S2).
Bioinformatics analysis
Aligning sample reads to the reference genome
As a reference for read mapping we used the current
draft of sequenced genomic contigs from flow-sorted
Pearce et al. BMC Plant Biology (2014) 14:368
chromosome arms of the hexaploid wheat variety “Chinese
Spring” generated by the IWGSC [48] and hosted by
Unité de Recherche Génomique (URGI, Since our experiments are in tetraploid wheat, only the sequences from the A and B genomes
were used as a reference. We aligned reads from each sample to this reference using GSNAP(l), a splicing-aware
aligner (version 05-09-2013, default parameters except -m
2 -n 1 -N 1 -A sam [61]) to generate SAM mapping files
for each sample.
Creating a putative transcribed region annotation track
At the time of our analysis, the wheat genomic reference
lacked genic annotation required to identify expressed
regions within our mapping results. Therefore, we created a set of putative transcribed ranges using a separate
comprehensive set of wheat transcript data. We compiled a total of 286,814 wheat transcripts, which were
derived from non-redundant sequences from four wheat
transcriptome assemblies combined with additional wheat
sequences taken from several other public sequence databases (described in Krasileva et al. [49] and in http://
maswheat.ucdavis.edu/Transcriptome/index.htm). Using
GMAP (Version 05-09-2013, default parameters except -n 1 –nofails –cross-species -f samse -x 0 [62], we
mapped this set of transcripts separately, to the Ahomoeologous group chromosomes contigs, and then to
the B-homoeologous group chromosome contigs. This
separate mapping approach was implemented to ensure
that the aligner found all homoeologous genes in each
dataset. Bedtools cluster (−d 0) was then used to merge
overlapping aligned regions, followed by bedtools merge
to merge overlapping regions into a single putative transcribed region. The resulting GFF file consisted of 135,571
genomic ranges, each representing the genomic contig
identifier and the start and end coordinate of the putative
transcribed region. These genomic ranges will be referred
to hereafter as loci. Despite the inclusion of all current
publicly available wheat transcripts, there remained a
small proportion of 50 bp Illumina reads which mapped
outside of the genomic regions defined in our GFF file,
which likely represent transcribed mRNA expressed in
our biological samples, but absent from our transcriptome
dataset. To expand our genomic loci to include these regions, we mapped the reads from one biological replicate
of WT samples at each time point (HD, 12 DAA and 22
DAA) using GSNAP as described above. Using these alignments, we defined novel transcribed genomic regions as
those with a read depth ≥10. These aligned regions
were then clustered in cases where they were separated
by ≤1 kbp using bedtools cluster (−d 1000) and overlapping regions were merged using bedtools merge to create
a single putative transcribed region. This resulted in the
identification of 4,257 additional loci, which were added
Page 20 of 23
to the existing GFF file, giving a total of 139,828 genomic
loci. Loci identifiers are from URGI (http://wheat-urgi.
versailles.inra.fr/) and are listed in Additional file 2 along
with the corresponding Ensembl locus ID and associated
high-confidence protein coding gene, where available
( />Counting sample reads overlapping putative
transcribed regions
Raw count values were determined using HTSeq count
[63] (−m union) using the generated GFF file and individual SAM alignment files for each sample. We considered only those reads mapped uniquely within the
regions defined within the GFF file for differential expression analysis. Before normalization, we used a custom R
package (noleaven) to remove genomic loci which had
zero or extremely low coverage across all genotype/time
point samples to test for DE. This reduces the number of
statistical tests, and therefore the required corrections for
multiple-testing. Further details and code are available online ( In this analysis, only loci which had more than three reads mapping
from at least two biological replicates of any genotype/
time point sample were retained. This resulted in the removal of 59,960 loci, leaving 80,168 loci with counts above
this threshold for further consideration.
Since the total number of reads varied between biological samples, raw counts were normalized using the
R/Bioconductor software package DESeq (Version 1.12.1
[64], R Version 2.14.2). After normalization, we performed 9 different pairwise comparisons: within the WT
genotype we compared HD vs. 12 DAA, HD vs. 22 DAA,
and 12 DAA vs. 22 DAA; and within each time point we
compared WT vs. gpc-A1 and WT vs. gpc-A1/gpc-B2 mutants. We applied four statistical tests and we only considered a locus differentially expressed if it was significant for
all four tests simultaneously using the thresholds described below. First, pairwise comparisons using DESeq
and edgeR [65] were made between samples. The P-values
generated by both analyses were adjusted for false discovery rates (FDR), using the procedure of Benjamini and
Hochbergh [66] as implemented in the R/Stats package, using a cutoff of adjusted P ≤ 0.01 for significance.
Throughout the paper, both DESeq and edgeR results refer
to the FDR-adjusted P values. We also applied a Mann–
Whitney-Wilcoxon (MWW) test (P ≤ 0.05) and a t-test
(P ≤ 0.01). The requirement of significance in all four tests
is a conservative approach that has the effect of reducing
the false positive rate at the expense of a reduction in the
power to detect genuinely DE transcripts (false negatives).
To give the readers the opportunity to reanalyze this data
using less stringent approaches we present all count data
with the P values for all four tests for the nine pairwise
comparisons (Additional file 2).
Pearce et al. BMC Plant Biology (2014) 14:368
Functional annotation of genomic loci
Page 21 of 23
Table S1. Micronutrient concentrations in UCD-2012 and TAU-2012
experiments. Table S2. Summary of raw and trimmed Illumina sequencing
reads and mapping rates from each biological replicate. Table S3. 26 genes
commonly differentially regulated during senescence between the current
study and Gregersen & Holm (2007) [40]. Table S4. 196 affymetrix contigs
from Jukanti et al. 2008 [38] also differentially expressed during senescence.
Table S5. List of 33 loci significantly upregulated between HD and 12 DAA
in WT plants but not in gpc-A1 plants. Table S6. Details of field experiments.
Table S7. qRT-PCR primers used in this study and their efficiency.
To determine the function of genes within our differentially regulated gene sets, we isolated the longest contig
from each of the 80,168 genomic loci included in our
reference set, including the predicted ORF as described
in Krasileva et al. [49]. We performed a BLASTX against
the nr protein database (NCBI 2013–10 release) and also
screened the translated ORF for each contig where this
was available against the Pfam database version 27.0
with InterProScan version 4.8 to discern the existence of
conserved protein domains. The resulting information
was used to infer GO terms associated with each genomic locus using BLAST2GO version 2.6.5. We obtained
an annotated function for 41,474 (51.7%) genomic loci
and used the ‘R’ package TopGO version 2.14.0 to perform an enrichment analysis among the differentially
regulated gene sets. “Biological Process” terms were obtained and significance values for enrichment were calculated using ‘classic’ Fishers’ exact test, implemented in
TopGO.
Abbreviations
GPC: Grain Protein Content; FRO: Ferric chelate reductase; IRT: Iron Regulated
Transporter; ZIP: ZRT, IRT-like Protein; YSL: Yellow Stripe-Like; PS: Phytosiderophore;
HMA: Heavy Metal ATPase; ZIFL: Zinc Induced Facilitator Like; NA: Nicotianamine;
NAS: Nicotianamine Synthase; DMA: 2’-deoxymugineic acid; NAAT: Nicotianamine
Aminotransferase; DMAS: DMA synthase; WT: Wild type; UCD: UC Davis; TAU: Tel
Aviv University; NY: Newe Ya’ar; HD: Heading Date; DAA: Days after anthesis;
IWGSC: International Wheat Genome Sequencing Consortium; PCA: Principal
component analysis; DE: Differential expression; GO: Gene ontology; FDR: False
discovery rate; MWW: Mann–Whitney-Wilcoxon.
qRT-PCR validation
Competing interests
The authors declare that they have no competing interests.
We synthesized cDNA using the Quantitect reverse transcription kit (Qiagen, Valencia, CA), using RNA extracted
for RNA-seq library construction as a template. qRT-PCR
reactions were performed as described previously [39] and
using the primers described in Additional file 1: Table S7.
Phylogenetic analysis
Proteins from putative transporters within each family
were aligned using MUSCLE and a neighbor-joining tree
constructed using pairwise deletions and 1,000 bootstrap
iterations with the program MEGA 5.0. To simplify
the trees, only one homoeologue of each wheat gene was
included.
Availability of supporting data
The raw data sets including sequencing reads were deposited in the National Center for Biotechnology Information’s Gene Expression Omnibus (accession number
GSE60635 />cgi?acc=GSE60635).
Additional files
Additional file 1: Figure S1. Relative chlorophyll content of flag leaves
taken from (a) TAU-2012, (b) NY-2012 and (c) NY-2013 experiments.
Figure S2. Spike and grain phenotypes in tetraploid GPC mutants.
Figure S3. Phenotype of WT, gpc-A1 and gpc-A1/gpc-B2 TILLING mutants
at 22 DAA (a-c) and at 60 DAA (d-f). Figure S4. Principal component
analyses of biological samples according to normalized expression
values per locus of all genes by time point (a-c) and genotype (d-f).
Figure S5. Relative expression of GPC genes in WT, gpc-A1 and
gpc-A1/gpc-B2 lines. Figure S6. HMA phylogeny. Figure S7. ZIFL
phylogeny. Figure S8. YSL phylogeny. Figure S9. ZIP phylogeny.
Figure S10. Validation of six transporter genes by qRT-PCR analysis.
Additional file 2: RNA-seq data. Table of genomic contigs, associated
Ensembl contig and protein-coding gene, NCBI BLASTX result, normalized
count values, trend during senescence and whether the gene is included
in the GPC-A1 or GPC-A1/GPC-B2 regulated set. For each pairwise comparison,
fold-change and statistical results from each test is described.
Authors’ contributions
SP, DC and JD designed the experiment. SP and JD directed the project. SP,
FT, DC, VB and JD analyzed the RNA-seq data. VB, HV and CC contributed to
the bioinformatics analyses. RA, AD, SP, RZ and FT performed the field
experiments and the phenotypic characterization of the mutants. SP wrote
the first draft of the manuscript and SP and JD produced the final version. All
authors contributed to the revision of the manuscript. JD and AD wrote the
grants supporting the project. All authors read and approved the final
manuscript.
Acknowledgements
The authors would like to thank Henny O'Geen for help and advice during
RNA-seq library construction and sequencing and to Guillermo Santamaría
for advice relating to wheat physiology. This project was supported by the
National Research Initiative Competitive Grants 2008-35318-18654 and
2011-68002-30029 (Triticeae-CAP) from the USDA National Institute of Food
and Agriculture, the United States – Israel Binational Science Foundation (BSF)
grant number 2007194, by the Marie Curie International Reintegration Grant
number PIRG08-GA-2010-277036 and by the Howard Hughes Medical Institute
and the Gordon and Betty Moore Foundation grant GBMF3031. Facundo Tabbita
was the recipient of a four-month "René Hugo Thalmann" fellowship from
Universidad de Buenos Aires for financial support while working at UC
Davis (EXP-UBA: 31.621/2010).
Author details
1
Department of Plant Sciences, University of California, Davis, CA 95616, USA.
2
Consejo Nacional de Investigaciones Científicas y Técnicas and Instituto de
Recursos Biológicos, CIRN, INTA, N. Repetto y Los Reseros s/n (1686),
Hurlingham, Argentina. 3Department of Viticulture and Enology, University of
California, Davis, CA 95616, USA. 4Faculty of Life Sciences, Department of
Molecular Biology and Ecology of Plants, Tel Aviv University, Tel Aviv 69978,
Israel. 5Department of Plant Nutrition, College of Resources and
Environmental Science, China Agricultural University, Beijing 100193, People’s
Republic of China. 6Department of Statistics, University of California, Davis,
CA 95616, USA. 7Faculty of Life Sciences, Department of Molecular Biology
and Ecology of Plants, Tel Aviv University, Tel Aviv 69978, Israel. 8Howard
Hughes Medical Institute and Gordon & Betty Moore Foundation
Investigator, Davis, CA 95616, USA.
Received: 27 August 2014 Accepted: 5 December 2014
Pearce et al. BMC Plant Biology (2014) 14:368
References
1. Cakmak I, Özkan H, Braun HJ, Welch RM, Romheld V: Zinc and iron
concentrations in seeds of wild, primitive, and modern wheats.
Food Nutr Bull 2000, 21:401–403.
2. Johnson VA, Mattern PJ, Peterson CJ, Kuhr SL: Improvement of wheat
protein by traditional breeding and genetic techniques. Cereal Chem
1985, 62:350–355.
3. Stein AJ: Global impacts of human mineral malnutrition. Plant Soil 2010,
335:133–154.
4. Barneix AJ: Physiology and biochemistry of source-regulated protein
accumulation in the wheat grain. J Plant Physiol 2007, 164:581–590.
5. Waters BM, Uauy C, Dubcovsky J, Grusak MA: Wheat (Triticum aestivum)
NAM proteins regulate the translocation of iron, zinc, and nitrogen
compounds from vegetative tissues to grain. J Exp Bot 2009,
60:4263–4274.
6. Erenoglu EB, Kutman UB, Ceylan Y, Yildiz B, Cakmak I: Improved nitrogen
nutrition enhances root uptake, root-to-shoot translocation and
remobilization of zinc (65Zn) in wheat. New Phytol 2011, 189:438–448.
7. Borrill P, Connorton JM, Balk J, Miller AJ, Sanders D, Uauy C: Biofortification
of wheat grain with iron and zinc: integrating novel genomic resources
and knowledge from model crops. Front Plant Sci 2014, 5:53.
8. Terry N, Abadía J: Function of iron in chloroplasts. J Plant Nutr 1986,
9:609–646.
9. Jeong J, Cohu C, Kerkeb L, Pilon M, Connolly EL, Guerinot ML: Chloroplast
Fe(III) chelate reductase activity is essential for seedling viability under
iron limiting conditions. Proc Natl Acad Sci U S A 2008, 105:10619–10624.
10. Ishimaru Y, Suzuki M, Tsukamoto T, Suzuki K, Nakazono M, Kobayashi T,
Wada Y, Watanabe S, Matsuhashi S, Takahashi M, Nakanishi H, Mori S,
Nishizawa NK: Rice plants take up iron as an Fe3+-phytosiderophore and
as Fe2+. Plant J 2006, 45:335–346.
11. Kim Y-Y, Choi H, Segami S, Cho H-T, Martinoia E, Maeshima M, Lee Y:
AtHMA1 contributes to the detoxification of excess Zn(II) in Arabidopsis.
Plant J 2009, 58:737–753.
12. Mikkelsen MD, Pedas P, Schiller M, Vincze E, Mills RF, Borg S, Møller A,
Schjoerring JK, Williams LE, Baekgaard L, Holm PB, Palmgren MG: Barley
HvHMA1 is a heavy metal pump involved in mobilizing organellar Zn and
Cu and plays a role in metal loading into grains. PLoS One 2012, 7:e49027.
13. Zhang Y, Xu Y-H, Yi H-Y, Gong J-M: Vacuolar membrane transporters
OsVIT1 and OsVIT2 modulate iron translocation between flag leaves and
seeds in rice. Plant J 2012, 72:400–410.
14. Haydon MJ, Cobbett CS: A novel major facilitator superfamily protein at
the tonoplast influences zinc tolerance and accumulation in Arabidopsis.
Plant Physiol 2007, 143:1705–1719.
15. Ricachenevsky FK, Sperotto RA, Menguer PK, Sperb ER, Lopes KL, Fett JP:
ZINC-INDUCED FACILITATOR-LIKE family in plants: lineage-specific expansion
in monocotyledons and conserved genomic and expression features among
rice (Oryza sativa) paralogs. BMC Plant Biol 2011, 11:20.
16. Lanquar V, Lelièvre F, Bolte S, Hamès C, Alcon C, Neumann D, Vansuyt G,
Curie C, Schröder A, Krämer U, Barbier-Brygoo H, Thomine S: Mobilization
of vacuolar iron by AtNRAMP3 and AtNRAMP4 is essential for seed
germination on low iron. EMBO J 2005, 24:4041–4051.
17. Lin YF, Liang HM, Yang SY, Boch A, Clemens S, Chen CC, Wu JF, Huang JL,
Yeh KC: Arabidopsis IRT3 is a zinc-regulated and plasma membrane
localized zinc/iron transporter. New Phytol 2009, 182:392–404.
18. Curie C, Panaviene Z, Loulergue C, Dellaporta SL, Briat JF, Walker EL: Maize
yellow stripe1 encodes a membrane protein directly involved in Fe(III)
uptake. Nature 2001, 409:346–349.
19. Curie C, Cassin G, Couch D, Divol F, Higuchi K, Le Jean M, Misson J, Schikora A,
Czernic P, Mari S: Metal movement within the plant: contribution of
nicotianamine and yellow stripe 1-like transporters. Ann Bot 2009, 103:1–11.
20. Chu HH, Chiecko J, Punshon T, Lanzirotti A, Lahner B, Salt DE, Walker EL:
Successful reproduction requires the function of Arabidopsis YELLOW
STRIPE-LIKE1 and YELLOW STRIPE-LIKE3 metal-nicotianamine
transporters in both vegetative and reproductive structures. Plant
Physiol 2010, 154:197–210.
21. Tiong J, McDonald GK, Genc Y, Pedas P, Hayes JE, Toubia J, Langridge P,
Huang CY: HvZIP7 mediates zinc accumulation in barley (Hordeum
vulgare) at moderately high zinc supply. New Phytol 2014, 201:131–143.
22. Takagi S, Nomoto K, Takemoto T: Physiological aspect of mugineic acid, a
possible phytosiderophore of graminaceous plants. J Plant Nutr 1984,
7:469–477.
Page 22 of 23
23. Higuchi K, Suzuki K, Nakanishi H, Yamaguchi H, Nishizawa NK, Mori S:
Cloning of nicotianamine synthase genes, novel genes involved in the
biosynthesis of phytosiderophores. Plant Physiol 1999, 119:471–480.
24. Inoue H, Takahashi M, Kobayashi T, Suzuki M, Nakanishi H, Mori S,
Nishizawa NK: Identification and localisation of the rice nicotianamine
aminotransferase gene OsNAAT1 expression suggests the site of
phytosiderophore synthesis in rice. Plant Mol Biol 2008, 66:193–203.
25. Kanazawa K, Higuchi K, Nishizawa NK, Fushiya S, Mori S: Detection of two
distinct isozymes of nicotianamine aminotransferase in Fe-deficient
barley roots. J Exp Bot 1995, 46:1241–1244.
26. Bashir K, Inoue H, Nagasaka S, Takahashi M, Nakanishi H, Mori S, Nishizawa NK:
Cloning and characterization of deoxymugineic acid synthase genes from
graminaceous plants. J Biol Chem 2006, 281:32395–32402.
27. Suzuki M, Tsukamoto T, Inoue H, Watanabe S, Matsuhashi S, Takahashi
M, Nakanishi H, Mori S, Nishizawa NK: Deoxymugineic acid increases
Zn translocation in Zn-deficient rice plants. Plant Mol Biol 2008,
66:609–617.
28. Clemens S, Deinlein U, Ahmadi H, Höreth S, Uraguchi S: Nicotianamine is a
major player in plant Zn homeostasis. BioMetals 2013, 26:623–632.
29. Nishiyama R, Kato M, Nagata S, Yanagisawa S, Yoneyama T: Identification of
Zn-nicotianamine and Fe-2'-Deoxymugineic acid in the phloem sap from
rice plants (Oryza sativa L.). Plant Cell Physiol 2012, 53:381–390.
30. White PJ, Broadley MR: Physiological limits to zinc biofortification of
edible crops. Front Plant Sci 2011, 2:80.
31. Schuler M, Rellán-Álvarez R, Fink-Straube C, Abadía J, Bauer P: Nicotianamine
functions in the phloem-based transport of iron to sink organs, in pollen
development and pollen tube growth in Arabidopsis. Plant Cell 2012,
24:2380–2400.
32. Haydon MJ, Kawachi M, Wirtz M, Hillmer S, Hell R, Kräemer U: Vacuolar
nicotianamine has critical and distinct roles under iron deficiency and
for zinc sequestration in Arabidopsis. Plant Cell 2012, 24:724–737.
33. Lee S, Jeon US, Lee SJ, Kim Y-K, Persson DP, Husted S, Schjørring JK, Kakei Y,
Masuda H, Nishizawa NK, An G: Iron fortification of rice seeds through
activation of the nicotianamine synthase gene. Proc Natl Acad Sci U S A
2009, 106:22014–22019.
34. Lee S, Persson DP, Hansen TH, Husted S, Schjøerring JK, Kim YS, Jeon US,
Kim YK, Kakei Y, Masuda H, Nishizawa NK, An G: Bio-available zinc in rice
seeds is increased by activation tagging of nicotianamine synthase. Plant
Biotechnol J 2011, 9:865–873.
35. Takahashi M, Terada Y, Nakai I, Nakanishi H, Yoshimura E, Mori S, Nishizawa NK:
Role of nicotianamine in the intracellular delivery of metals and plant
reproductive development. Plant Cell 2003, 15:1263–1280.
36. Breeze E, Harrison E, McHattie S, Hughes L, Hickman R, Hill C, Kiddle S, Kim YS,
Penfold CA, Jenkins D, Zhang CJ, Morris K, Jenner C, Jackson S, Thomas B,
Tabrett A, Legaie R, Moore JD, Wild DL, Ott S, Rand D, Beynon J, Denby K, Mead
A, Buchanan-Wollaston V: High-resolution temporal profiling of transcripts
during Arabidopsis leaf senescence reveals a distinct chronology of
processes and regulation. Plant Cell 2011, 23:873–894.
37. Buchanan-Wollaston V, Earl S, Harrison E, Mathas E, Navabpour S, Page T,
Pink D: The molecular analysis of leaf senescence - a genomics approach.
Plant Biotechnol J 2003, 1:3–22.
38. Jukanti AK, Heidlebaugh NM, Parrott DL, Fischer IA, McInnerney K, Fischer AM:
Comparative transcriptome profiling of near-isogenic barley (Hordeum
vulgare) lines differing in the allelic state of a major grain protein content
locus identifies genes with possible roles in leaf senescence and nitrogen
reallocation. New Phytol 2008, 177:333–349.
39. Cantu D, Pearce SP, Distelfeld A, Christiansen MW, Uauy C, Akhunov E,
Fahima T, Dubcovsky J: Effect of the down-regulation of the high Grain
Protein Content (GPC) genes on the wheat transcriptome during
monocarpic senescence. BMC Genomics 2011, 12:492.
40. Gregersen PL, Holm PB: Transcriptome analysis of senescence in the flag
leaf of wheat (Triticum aestivum L.). Plant Biotechnol J 2007, 5:192–206.
41. Guo YF, Gan SS: AtNAP, a NAC family transcription factor, has an
important role in leaf senescence. Plant J 2006, 46:601–612.
42. Kim JH, Woo HR, Kim J, Lim PO, Lee IC, Choi SH, Hwang D, Nam HG:
Trifurcate feed-forward regulation of age-dependent cell death involving
miR164 in Arabidopsis. Science 2009, 323:1053–1057.
43. Sperotto RA, Ricachenevsky FK, Duarte GL, Boff T, Lopes KL, Sperb ER,
Grusak MA, Fett JP: Identification of up-regulated genes in flag leaves
during rice grain filling and characterization of OsNAC5, a new ABAdependent transcription factor. Planta 2009, 230:985–1002.
Pearce et al. BMC Plant Biology (2014) 14:368
44. Uauy C, Distelfeld A, Fahima T, Blechl A, Dubcovsky J: A NAC gene
regulating senescence improves grain protein, zinc, and iron
content in wheat. Science 2006, 314:1298–1301.
45. Joppa LR, Cantrell RG: Chromosomal location of genes for grain protein
content of wild tetraploid wheat. Crop Sci 1990, 30:1059–1064.
46. Avni R, Zhao R, Pearce S, Jun Y, Uauy C, Tabbita F, Fahima T, Slade A,
Dubcovsky J, Distelfeld A: Functional characterization of GPC-1 genes in
hexaploid wheat. Planta 2014, 239:313–324.
47. Joppa LR, Du CH, Hart GE, Hareland GA: Mapping gene(s) for grain protein
in tetraploid wheat (Triticum turgidum L.) using a population of
recombinant inbred chromosome lines. Crop Sci 1997, 37:1586–1589.
48. IWGSC: A chromosome-based draft sequence of the hexaploid bread
wheat (Triticum aestivum) genome. Science 2014, 345:1251788.
49. Krasileva KV, Buffalo V, Bailey P, Pearce S, Ayling S, Tabbita F, Soria M, Wang S,
Consortium I, Akhunov E, Uauy C, Dubcovsky J: Separating homeologs by
phasing in the tetraploid wheat transcriptome. Genome Biol 2013, 14:R66.
50. Uauy C, Paraiso F, Colasuonno P, Tran RK, Tsai H, Berardi S, Comai L,
Dubcovsky J: A modified TILLING approach to detect induced mutations
in tetraploid and hexaploid wheat. BMC Plant Biol 2009, 9:115.
51. Distelfeld A, Pearce SP, Avni R, Scherer B, Uauy C, Piston F, Slade A, Zhao R,
Dubcovsky J: Divergent functions of orthologous NAC transcription
factors in wheat and rice. Plant Mol Biol 2012, 78:515–524.
52. Liang CZ, Wang YQ, Zhu YN, Tang JY, Hu B, Liu LC, Ou SJ, Wu HK, Sun XH,
Chu JF, Chu CC: OsNAP connects abscisic acid and leaf senescence by
fine-tuning abscisic acid biosynthesis and directly targeting senescenceassociated genes in rice. Proc Natl Acad Sci USA 2014, 111:10013–10018.
53. Sperotto RA, Boff T, Duarte GL, Santos LS, Grusak MA, Fett JP: Identification
of putative target genes to manipulate Fe and Zn concentrations in rice
grains. J Plant Physiol 2010, 167:1500–1506.
54. Yamaji N, Xia J, Mitani-Ueno N, Yokosho K, Ma JF: Preferential delivery of
zinc to developing tissues in rice is mediated by P-type heavy metal
ATPase OsHMA2. Plant Physiol 2013, 162:927–939.
55. Bashir K, Takahashi R, Akhtar S, Ishimaru Y, Nakanishi H, Nishizawa NK: The
knockdown of OsVIT2 and MIT affects iron localization in rice seed.
Rice 2013, 6:13.
56. Tauris B, Borg S, Gregersen PL, Holm PB: A roadmap for zinc trafficking in
the developing barley grain based on laser capture microdissection and
gene expression profiling. J Exp Bot 2009, 60:1333–1347.
57. Cailliatte R, Lapeyre B, Briat J-F, Mari S, Curie C: The NRAMP6 metal
transporter contributes to cadmium toxicity. Biochem J 2009,
422:217–228.
58. Masuda H, Aung MS, Nishizawa NK: Iron biofortification of rice using
different transgenic approaches. Rice 2013, 6:40.
59. Guttieri MJ, Stein RJ, Waters BM: Nutrient partitioning and grain yield of
TaNAM-RNAi wheat under abiotic stress. Plant Soil 2013, 371:573–591.
60. Richardson AD, Duigan SP, Berlyn GP: An evaluation of noninvasive
methods to estimate foliar chlorophyll content. New Phytol 2002,
153:185–194.
61. Wu TD, Nacu S: Fast and SNP-tolerant detection of complex variants and
splicing in short reads. Bioinformatics 2010, 26:873–881.
62. Wu TD, Watanabe CK: GMAP: a genomic mapping and alignment program
for mRNA and EST sequences. Bioinformatics 2005, 21:1859–1875.
63. Anders S, Pyl PT, Huber W: HTSeq - A Python framework to work with
high-throughput sequencing data. bioRxiv 2014:doi:10.1101/002824
64. Anders S, Huber W: Differential expression analysis for sequence count
data. Genome Biol 2010, 11:R106.
65. Robinson MD, McCarthy DJ, Smyth GK: edgeR: a Bioconductor package for
differential expression analysis of digital gene expression data.
Bioinformatics 2010, 26:139–140.
66. Benjamini Y, Hochberg Y: Controlling the false discovery rate - a practical
and powerful approach to multiple testing. J Roy Stat Soc Ser B
(Stat Method) 1995, 57:289–300.
Page 23 of 23
Submit your next manuscript to BioMed Central
and take full advantage of:
• Convenient online submission
• Thorough peer review
• No space constraints or color figure charges
• Immediate publication on acceptance
• Inclusion in PubMed, CAS, Scopus and Google Scholar
• Research which is freely available for redistribution
Submit your manuscript at
www.biomedcentral.com/submit