Non-targeted metabolite profiling of citrus juices as a tool for variety discrimination and metabolite flow analysis
Bạn đang xem bản rút gọn của tài liệu. Xem và tải ngay bản đầy đủ của tài liệu tại đây (2.35 MB, 16 trang )
Arbona et al. BMC Plant Biology (2015) 15:38
DOI 10.1186/s12870-015-0430-8
RESEARCH ARTICLE
Open Access
Non-targeted metabolite profiling of citrus juices
as a tool for variety discrimination and metabolite
flow analysis
Vicent Arbona1*, Domingo J Iglesias2 and Aurelio Gómez-Cadenas1
Abstract
Background: Genetic diversity of citrus includes intrageneric hybrids, cultivars arising from cross-pollination and/or
somatic mutations with particular biochemical compounds such as sugar, acids and secondary metabolite composition.
Results: Secondary metabolite profiles of juices from 12 commercial varieties grouped into blonde and navel
types, mandarins, lemons and grapefruits were analyzed by LC/ESI-QTOF-MS. HCA on metabolite profiling data
revealed the existence of natural groups demarcating fruit types and varieties associated to specific composition
patterns. The unbiased classification provided by HCA was used for PLS-DA to find the potential variables (mass
chromatographic features) responsible for the classification. Abscisic acid and derivatives, several flavonoids and
limonoids were identified by analysis of mass spectra. To facilitate interpretation, metabolites were represented as
flow charts depicting biosynthetic pathways. Mandarins ‘Fortune’ and ‘Hernandina’ along with oranges showed
higher ABA contents and ABA degradation products were present as glycosylated forms in oranges and certain
mandarins. All orange and grapefruit varieties showed high limonin contents and its glycosylated form, that was
only absent in lemons. The rest of identified limonoids were highly abundant in oranges. Particularly, Sucrenya
cultivar showed a specific accumulation of obacunone and limonoate A-ring lactone. Polymethoxylated flavanones
(tangeritin and isomers) were absolutely absent from lemons and grapefruits whereas kaempferol deoxyhexose hexose
isomer #2, naringin and neohesperidin were only present in these cultivars.
Conclusions: Analysis of relative metabolite build-up in closely-related genotypes allowed the efficient demarcation of
cultivars and suggested the existence of genotype-specific regulatory mechanisms underlying the differential metabolite
accumulation.
Keywords: Fruit quality, Liquid chromatography, Mass spectrometry, Orange, Phenotyping, Secondary metabolites
Background
In the Rutaceae family, citrus constitutes a highly heterogeneous taxonomic group including several species
such as sweet oranges (Citrus sinensis L. Osbeck), mandarins (C. clementina hort. Ex Tan. and C. reticulata
Blanco), lemons (Citrus × limon L. Burm.f.) and grapefruits (C. paradisi Macf.). Besides these species, there
are other related species with agronomic uses as rootstocks or for ornamental purposes (e.g. Poncirus trifoliata
L. Raf.). Usually, the different cultivars within a species
show low genetic variability but do have particular
* Correspondence:
1
Laboratori d’Ecofisiologia i Biotecnologia, Departament de Ciències Agràries
i del Medi Natural, Universitat Jaume I, E-12071 Castelló de la Plana, Spain
Full list of author information is available at the end of the article
desirable phenotypic characteristics such as precocity or
delayed harvesting, seedless fruits, sugar and acid accumulation, easiness to peel, etc. However, alteration of
the harvesting period is one of the most desirable traits,
either when precocity or delayed harvesting is achieved.
This alteration has additional impacts on fruit quality,
as environmental variables change over the year and irradiation, temperature and humidity influence fruit
growth, accumulation of sugars and acids and other
non-palatable chemical constituents [1-3]. It is difficult
to have a control on the buildup of these compounds
in fruits over the maturation process. This fraction of
citrus juice is constituted, among others, by carotenoids, triterpenoids, flavonoids and other secondary metabolites known to have an impact on health [4,5]. It
© 2015 Arbona et al.; licensee BioMed Central. This is an Open Access article distributed under the terms of the Creative
Commons Attribution License ( which permits unrestricted use, distribution, and
reproduction in any medium, provided the original work is properly credited. The Creative Commons Public Domain
Dedication waiver ( applies to the data made available in this article,
unless otherwise stated.
Arbona et al. BMC Plant Biology (2015) 15:38
has been previously shown that different citrus juices
have different carotenoid profiles depending on genotype and growth conditions [6] that could have an impact on citrus nutritional properties. To this respect,
within a particular growth area, the genotype is expected to be the major contributing factor determining fruit compositional properties, and therefore
genetic mutations that give rise to new varieties would
also affect fruit chemical composition [7]. Nevertheless, despite the enormous amount of information
available it has been so far impossible to establish a reliable model of metabolite flow in citrus fruits. A possible utilization pathway for citric acid was proposed
linking it to acetyl-CoA through ATP-citrate lyase
after isomerization to isocitrate catalyzed by aconitase
[8]. This acetyl-CoA could be in turn channeled to
the biosynthesis of secondary metabolites such as limonoids, carotenoids and xanthophylls through the
methyl-eriothritiol phosphate pathway. Moreover, biosynthesis of flavonoids and other phenylpropanoids is
fueled by intermediates generated during glycolysis
and pentose phosphate pathway. To add more complexity to the model, levels of these compounds are
determined by the activity of different enzymes that
are, in turn, responsible for their biosynthesis, their
degradation/biotransformation and/or the conjugation
to different chemical moieties. In this sense, as the enzyme
activity is generally associated to gene expression, metabolites could be considered the end-products of gene expression [9]. Therefore, to better understand the regulation of
secondary metabolism in citrus fruits a comprehensive
and unbiased analysis of this class of compounds is
required. To this regard, non-targeted LC/MS metabolite
profiling has proved to be a valuable tool for phenotyping
Page 2 of 16
environmentally- or genetically-induced variations in secondary metabolite composition [10] as well as to evaluate the impact of stress on plant biochemistry [11].
This technique has been previously used to assess adulteration of citrus juice with grape or apple ones [12]
and, more recently, to phenotype wild type and mutant
orange varieties [7].
The aim of this work was to investigate the differences in secondary metabolite composition within and
between five important commercial citrus fruit groups:
oranges (blonde and navel), mandarins, grapefruits
and lemons (see Table 1). A detailed identification of
selected metabolite features was considered in this
work to further investigate secondary metabolite flows
in every variety, linking diversification to particular
metabolite profiles.
Methods
Fruit harvesting, sample collection and preparation for
analyses
Citrus fruits from different genotypes and varieties (see
Table 1) were harvested at commercial maturity from
trees at the germplasm bank (Institut Valencià d’Investigacions Agràries, IVIA, Moncada, València). Commercial
maturity refers to the timing of harvest to meet specific
market and consumer requirements. In citrus, this is
assessed by means of the maturity index (°Brix/acidity,
see Table 1 for usual maturity index values). Genotypes
were characterized according to an enlarged modification of the “Descriptor for Citrus” from the International
Plant Genetic Resources Institute (IPGRI) [13]. At least
four fruits, one from each direction on the tree, were
collected from three replicate trees (n = 3) grafted onto
the same rootstock. Juice extraction was performed by
Table 1 List of genotypes included in this study
#
Name
Species*
Type*
Harvesting period**
°Brix/acidity**
1
Eureka
Citrus × limon L. Burm.f.
2
Fino
Citrus × limon L. Burm.f.
Lemon
October to February
3-10
Lemon
October to April
3
Marsh
Citrus paradisi Macf.
Grapefruit
November to March
4
Star Ruby
Citrus paradisi Macf.
Grapefruit
October to March
5
Fortune
Citrus reticulata Blanco (Clementine mandarin × Dancy mandarin)
Mandarin
February to April
8-11
6
Nadorcott
Citrus reticulata Blanco (open pollination of Murcott mandarin)
Mandarin
January to March
8-13
7
Pixie
Citrus reticulata Blanco (open pollination of Kincy mandarin)
Mandarin
December to February
10-28
8
Hernandina
Citrus clementina hort. ex Tanaka
Mandarin
January to February
16-28
9
Sucrenya
Citrus sinensis L. Osbeck
Blonde orange
December to March
>40
10
Midknight
Citrus sinensis L. Osbeck
Blonde orange
March to June
8-14
11
Washington
Citrus sinensis L. Osbeck
Navel orange
December to February
8-13
12
Lane late
Citrus sinensis L. Osbeck
Navel orange
January to April
10-16
4-8
(*)Information retrieved from University of California, Riverside Citrus variety collection website (). (**) information retrieved
from .
Arbona et al. BMC Plant Biology (2015) 15:38
manual squeezing and juice of fruits from the same
tree was pooled. Juice aliquots were immediately stored
at −80°C until analyses with no further processing. Right
before chromatographic analyses, frozen fruit juices were
thawed at room temperature, centrifuged and the supernatants filtered through PTFE syringe filters (0.2 μm pore
size) directly to vials.
Chromatographic and QTOF-MS conditions
Fruit juices were separated by reversed phase HPLC
using acetonitrile (B) and water (A), both supplemented
with formic acid to a concentration of 0.1% (v/v), as
solvents and a C18 column (5-μm particle size, 100 9
2.1 mm, XTerra™, Waters). The separation module, a
Waters Alliance 2965 was operated in gradient mode at
a flow rate of 300 μl min−1 for 30 min as follows: 0–
2 min 95:5 (A:B) followed by an increase in B from 5 to
95 in the following 26 min (2.01-28.00 min), thereafter returning to initial conditions (29.01-30.00 min)
that were maintained for 5 min for column reconditioning. Column eluates were introduced into a QTOF-MS
(Micromass Ltd., Manchester, UK) through an ESI source
operated in positive and negative mode. Nitrogen was
used as the nebulization as well as the desolvation gas and
working flows were set at 100 and 800 L h−1, respectively.
Source block temperature was kept at 120°C and desolvation gas at 350°C. Capillary, cone, and extractor voltages
were set at 4 kV, 25 eV, and 3 eV, respectively. Before analyses, the QTOF-MS was calibrated by infusing a mixture of NaOH and HCOOH at a flow rate of 25 μl min−1.
After calibration, the average error was less than 5 ppm.
During acquisition, a one-ppm solution of Leu-enkephalin
([M+H]+ = 556.2771) was continuously post column infused as a lockmass reference. Data were acquired under
continuous mode in the 50–1000 amu range, scan
duration was set at 1.0 s, and interscan delay was set
at 0.1 s.
Data processing
Data processing was achieved using Masslynx v.4.1
and raw data files were analyzed using xcms following
conversion to netCDF with the databridge software
provided by Masslynx. Chromatographic peak detection was performed using the matchedFilter algorithm,
applying the following parameter settings: snr = 3,
fwhm = 15 s, step = 0.01 D, mzdiff = 0.1 Da, and profmethod = bin. Retention time correction was achieved
in three iterations applying the parameter settings
minfrac = 1, bw = 30 s, mzwid = 0.05 Da, span = 1, and
missing = extra = 1 for the first iteration; minfrac = 1,
bw = 10 s, mzwid = 0.05 Da, span = 0.6, and missing =
extra = 0 for the second iteration; and minfrac = 1, bw =
5 s, mzwid = 0.05 Da, span = 0.5, and missing = extra = 0
for the third iteration. After final peak grouping (minfrac =
Page 3 of 16
1, bw = 5 s) and filling in of missing features using the
fillPeaks command of the xcms package, a data matrix consisting of mass features (including accurate mass values
and retention time) and peak area values per sample was
obtained.
Statistical analyses
Hierarchical Cluster Analysis (HCA) was performed
with pvclust package running under R 3.2 and PLS-DA
was performed using SIMCA-P+ 11.0 (Umetrics,
Umea, Sweden). HCA, followed by bootstrap resampling (n = 1000) to validate grouping, was performed
on raw data without any variable selection to observe
natural grouping of samples. The classification provided by unsupervised HCA confirmed homogeneity of
sample groups (Figure 1) and allowed using genotype
denomination as parameter to feed PLS-DA. This
strategy was further used to select potential variables
contributing to the provided classification. Prior to
analyses, data were normalized to total ion intensity.
The potential variables contributing to the classification were selected based on variable importance in the
projection (VIP > 2.0) values. Relevant variables were
then confirmed after integration of chromatographic
peaks and analysis of variance (ANOVA) of peak areas
throughout the 12 sample groups. The metabolites
were tentatively identified by elucidation of structures
with MS fragments, comparison of accurate m/z value
and MS fragmentation pattern with literature and coinjection with pure standards when available. All standards were purchased from Sigma-Aldrich (Madrid,
Spain) except for ABA and derivatives that were obtained from the Plant Biotechnology Institute of the
National Research Council (Canada).
Results and discussion
Non-targeted analysis of secondary metabolite features in
citrus fruit juices
The analyses, carried out by means of reversed-phase liquid chromatography coupled to a QTOF-MS operated
in positive and negative ionization modes, rendered a
number of chromatograms that were extracted with
XCMS [14]. The resulting datasets were subjected to
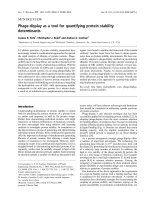
HCA using the R package pvclust and presented as dendrograms in Figure 1. The results showed grouping of
sample replicates in tight clusters according to the juice
source fruit (see Table 1). In addition, relationship between clusters was in agreement with the expected
phylogenetic relationships among varieties showing a
perfect separation of the represented groups: grapefruits,
lemons, oranges (blonde and navel types) and mandarins
(see Additional file 1: Figure S1). All varieties could be
resolved using different component combinations after
PLS-DA. In addition, loadings plots indicated that some
Arbona et al. BMC Plant Biology (2015) 15:38
Page 4 of 16
Figure 1 Hierarchical clustering dendrograms obtained from (a) positive and (b) negative electrospray metabolite profiles of citrus
juices. On every node, approximate unbiased (red, au) and bootstrap values (green, bp) are presented.
Arbona et al. BMC Plant Biology (2015) 15:38
variables were important in defining the different sample
groups (Additional file 2: Figure S2a through f ). Component 2 resolved well ‘Washington’ navel from the rest
whereas ‘Sucrenya’ resolved along component 3. A combination of components 5 and 6 allowed the resolution
of grapefruits and the two varieties included in this
group. Component 5 alone allowed the discrimination of
‘Hernandina’ from the rest of varieties. A better resolution for grapefruits was obtained along component 8.
Meanwhile, component 7 resolved well ‘Nadorcott’ and
‘Midknight’ varieties. Lemons resolved along component
10 whereas component 9 discriminated ‘Pixie’ from the
rest. A combination of components 9 and 10, allowed demarcation of ‘Fortune’ and ‘Lane late’ although these two
varieties were better resolved along component 11 in combination with component 1 (Additional file 2: Figure S2f).
The two grapefruit varieties were the utmost distant species included in the study followed by lemons, both constituting highly tight clusters in the HCA (Figure 1). This is
probably due to their clear phylogenetic origin, grapefruits are crosses between sweet orange Citrus sinensis
and Citrus maxima (pummelo), whereas lemons arise
from the cross of sour orange Citrus aurantium and
Citrus medica (citron, see Additional file 1: Figure S1
for more details). Two major clusters originated from
grouping oranges (‘Sucrenya’, ‘Lane late’, ‘Midknight’ and
‘Washington’) and mandarins (‘Hernandina’, ‘Pixie’, ‘Fortune’
and ‘Nadorcott’) that are also phylogenetically related.
To this respect, although ‘Lane late’, ‘Midknight’ and
‘Washington’ always occurred together, ‘Sucrenya’ appeared as a separate cluster probably due to its acidless
juice characteristics. Moreover, in both ionization
modes the methodology efficiently demarcated mandarins
in two groups: ‘Fortune’/‘Nadorcott’, arising from clementine × mandarin cross-pollination and an open pollination
of ‘Murcott’ mandarin (see Table 1) respectively,and
‘Hernandina’/‘Pixie’, resulting from a bud mutation
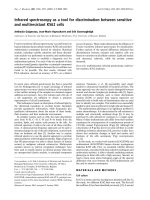
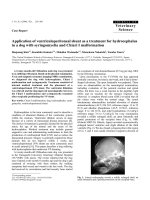
Figure 2 Scores 3D scatter plots after PLS-DA analysis.
Page 5 of 16
from ‘Fina’ clementine and an open pollination of
‘Kincy’ mandarin, correspondingly. Mandarins are selfincompatible citrus species that usually produce seedless
fruits unless flowers are cross-pollinated with compatible
species. These cross-pollination has been extensively used
to generate new commercial cultivars with particular fruit
traits that differ from those of each parental. Examples of
this are ‘Fortune’ and Nadorcott’, often classified as mandarin hybrids, which share several fruit morphology, color
and aroma characteristics. On the other hand, ‘Hernandina’
and ‘Pixie’, although are classified as two different species,
they show more similar phenotypic traits, including
morphology, flavor and period of maturation [15]. It is
likely that despite of differences in their genetic origin the
respective overcrosses yielded varieties with similar metabolite phenotypes quite different from the rest of varieties
included in this study. Profiling of citrus juices in negative
electrospray also gave the required resolution to discriminate genotypes included in the navel and blonde groups:
‘Lane late’/‘Washington’ and ‘Sucrenya’/‘Midknight’, respectively. In this sense, it is worthwhile to note that
‘Sucrenya’ always occurred as a separate group from oranges. This is likely a result of its particular juice traits.
This variety usually shows very low titratable acid contents,
compared to the rest of blonde or navel-type varieties [8].
Nevertheless, although all related varieties (within the same
group) clustered together, it was still possible to clearly differentiate each of them (Figure 1).
Variable selection and annotation of compounds
In order to identify those variables contributing to the
observed classification (Figure 2), a PLS-DA was carried
out using the entire XCMS output using sample classification provided by HCA. PLS-DA calculates a regression
model between the multivariate dataset (each variable
consisting of a m/z and retention time value) and a
response variable that only contains class information
Arbona et al. BMC Plant Biology (2015) 15:38
(e.g. the variety classification provided by HCA). This
analysis yielded a number of variables (chromatographic peaks, each represented by m/z and retention
time values) ranked from very important (VIP > 2 to
1.5) to irrelevant (VIP values lower than 1). Scores 3D
scatter plots from PLS-DA results indicated an optimal
performance of the model to differentiate big groups of
fruits: lemons, grapefruits, oranges and mandarins (Figure 2)
and, in addition, some varieties were clearly differentiated
within their respective groups such as both grapefruit cultivars, ‘Pixie’ mandarin and ‘Sucrenya’ blonde orange. Nevertheless, by representing other combinations of components
the model is also able to clearly differentiate closely-related
varieties within a group (data not shown). In general,
varieties were grouped according to genotype and not
harvesting period (Table 1). It seems clear that environmental growth conditions have an influence on fruit
secondary metabolite composition as shown in [6]. In
that case, carotenoid composition of orange and mandarin varieties grown in Mediterranean, subtropical and
tropical conditions was evaluated showing clear differences. However, when the same parameter was evaluated in varieties grown in the same climatic conditions,
little changes could be observed throughout the year.
Therefore, the differences in secondary metabolite
composition observed in the present work are likely to
arise as particular genotype traits rather than being induced by environmental changes. Biochemical evolution of fruits throughout the ripening process is also an
important aspect. In this work, all fruits were harvested
at optimum commercial maturity. It is likely that fruit
metabolite composition changes during fruit growth
and maturation and also during the postharvest period.
However, it is expected that they keep their characteristic traits. Recently, it was shown that even after industrial orange juice processing it was possible to identify
adulteration with other juice sources, such as apple or
grapefruit [12]. This demonstrates that industrial juice
processing is not sufficient to remove or mask the discriminant metabolite of orange juice. Moreover, metabolomic analysis of pulp extracts of an orange bud
mutant variety and its parental at different harvesting
dates revealed higher differences between varieties than
among sampling dates. Therefore, it could be hypothesized that differences among varieties could be minimized throughout the ripening process; however, the
discriminant metabolite traits allowing demarcation of
genotypes would still remain present.
Chromatographic mass features showing a VIP value
higher than 1.5 were located and further inspected using
Masslynx 4.1. software to attain structure elucidation
and annotation of compounds. A number of potential
metabolites were identified and annotated based on
structural elucidation, literature search and comparison
Page 6 of 16
with commercial standards, when available (Table 2).
According to their putative annotation, all compounds
were grouped into metabolite classes and their relative
accumulation represented as metabolite flow charts
(Figures 3, 4 and 5). ABA and its derivatives were identified based on mass spectra and/or comparison with
commercial standards. It has been previously shown
that variations in the expression of NCED2 and 3 are
correlated with endogenous ABA levels. To this respect, juice sacs of satsuma mandarin had higher ABA
levels than those of lemons or sweet oranges along with
higher NCED expression [16]. This could be somehow
associated to differences found in carotenoid content
among citrus varieties [6]. Besides changes in expression and activity of NCEDs, carotenoid precursor availability could influence ABA content. Citrus fruits are
also important sources of flavonoids, including several
kaempferol, hesperetin, naringenin and isorhamnetin
derivatives that were putatively identified based on the literature and the comparison with commercial standards.
In addition, three metabolites showing a m/z compatible
with their annotation as tangeretin ([M+H]+ 373.1397,
ΔDa −0.011) were detected under positive electrospray
ionization (Table 2). This would indicate the presence of
different tangeretin isomers with identical composition
but methoxylated in different positions. Moreover, some
limonoids were annotated in citrus samples. These
compounds are triterpenoids derived from squalene by
formation of a polycyclic molecule containing a furanolactone core structure [17] and some of them are known to
provide bitter taste to citrus juices namely limonin, nomilin, obacunone and nomilinic acid. Limonoids can also
be released from their respective glycosylated forms
upon cleavage after freeze damage or other environmental stress conditions [18]. These compounds have
been associated to fruit quality and reported to have
important health benefits [17,19,20]. Besides, some bitter
limonoids can be present as tasteless A-ring lactones that
were also tentatively annotated in this work. In addition,
some compounds involved in other mixed pathways, such
as the aminoacids Phe and Trp, involved in aromatic and
indolic compound biosynthesis [21,22] and a ferulic acid
hexoside, derived from the phenylpropanoid pathway,
were also annotated.
For an easier interpretation of data, flow charts depicting
biosynthetic pathways (constructed according to the current information available on Kegg, />kegg/) are presented in this work. This allows classifying
most metabolites as part of specific biosynthetic pathways, the relative concentration of each metabolite
throughout all analyzed genotypes is represented as a
color scale (Figures 2, 3 and 4) following the same sample order as in Table 1. The validity of each metabolite
marker was assessed by ANOVA comparing peak areas
Arbona et al. BMC Plant Biology (2015) 15:38
Page 7 of 16
Table 2 Identification of compounds
Compound
ESI +
annotation positive
ESI -
annotation
negative
Rt
(min)
Rt (s)
annotation
level
ChEBI code
4.15
249.3
2, 3 [23]
442.1841 [M-H]−
5.83
350.0
1, 3
281.1455 [M-H]−
8.46
507.6
2, 3 [23]
CHEBI:23757
10.26
615.6
1
CHEBI:62436
279.1400 [M-H]−
11.56
693.6
1
CHEBI:28205
263.1374 [M-H]−
12.52
751.2
1
CHEBI:2365
649.2438 [M-H]−
10.20
612.0
2, 3 [24]
CHEBI:16063
nd
669.2733 [M-H]−
10.55
633.0
2, 3 [24]
471.2007 [M+H-H2O]+
487.1945 [M-H]−
10.93
655.8
Deacetyl Nomilin glycoside
nd
651.2624 [M-H]−
11.08
Nomilinic acid glucoside
nd
711.2627 [M-H]−
11.82
709.2
2, 3 [24]
Nomilin glycoside
515.2332 [M+H-Glucose]+
693.2737 [M-H-H2O]−
11.87
712.2
2, 3 [24]
12.25
735.0
2, 3 [24]
Abscisic acid and derivatives
Dihydrophaseic acid glycosil
ester (DPAGE)
Phaseic acid glycosyl ester
(PAGE)
Dihydrophaseic acid (DPA)
Abscisic acid glycosyl ester
(ABAGE)
Phaseic acid (PA)
Abscisic acid (ABA)
443.1941 [M-H]−
247.1445 [M+H-H2O]+
265.1483
[M+H-Glucose]+
479.1836
[M+Cl]−
467.2023
+
[M+Na]
489.1993
[M+HCOOH]−
483.1752
[M+K]+
247.1447 [M+H-Glucose-H2O]+
467.2059
[M+Na]+
483.1753
[M+K]+
265.1454 [M+H-H2O]+
247.1357
[M+H-2 × H2O]+
305.1456
[M+Na]+
229.1329
[M+H-H2O]+
425.1833 [M-H]−
247.1379
[M+H-Glucose]+
471.1915
[M-H+HCOOH]−
265.1528 [M+H-Hexose]+
263.1404
[M-Hexose]−
+
449.1775
[M+Na]
465.1740
[M+K]+
247.1357 [M+H-2 × H2O]+
+
265.1490
[M+H-H2O]
229.1490
[M+H-3 × H2O]+
247.1385 [M+H-H2O]+
+
303.1071
[M+K]
265.1495
[M+H]+
328.1577
[M+Na+CH3CN]+
Limonoids and glycosides
Limonin glycoside
Deacetyl Nomilinic acid
glycoside
Limonin A-ring lactone*
Obacunone glycoside
471.2049 [M+H-Glucose]+
+
673.2702
[M+Na]
689.2392
[M+K]+
489.2241
[M+H-Hexose]+
+
533.2402
[M+H-Hexose]
455.2494
[M+H-CH4O]+
695.2495
[M+H]+
487.2391
[M+H-CO]+
419.2000
[M+H-2xH2O]+
531.3160 [M+H-C4H8O3]+
455.2069
+
[M+H-Glucose]
711.2837
2, 3 [24]
2, 3 [24]
−
[M-H]
633.2513 [M-H]−
CHEBI:16226
Arbona et al. BMC Plant Biology (2015) 15:38
Page 8 of 16
Table 2 Identification of compounds (Continued)
Nomilin A-ring lactone*
Limonin
Nomilin
+
471.2031 [M+H]
14.75
885.0
2, 3 [24]
16.60
996.0
1
513.2211 [M-H]−
17.50
1050.0 2, 3 [24]
453.2200 [M-H]−
21.38
1282.8 2, 3 [24]
593.1387 [M-H]−
8.92
535.2
2, 3 [25]
10.25
615.0
1
CHEBI:28527
10.82
649.2
1
CHEBI:28705
623.1828 [M-H]−
10.86
651.6
2, 3 [25]
579.1614 [M-H]−
11.14
668.4
1
CHEBI:28819
609.1722 [M-H]−
11.27
676.2
1
CHEBI:28775
609.1772 [M-H]−
11.53
691.8
2, 3 [25]
CHEBI:59016
593.1871 [M-H]−
12.93
775.8
2, 3 [25]
13.20
792.0
2, 3 [25]
515.1922
[M+HCOOH]−
−
+
427.2233
[M-CO2]
512.2452
[M+CH3CN]+
469.1904 [M-H]
505.1670
515.2448 [M+H]+
455.2251
Obacunone
531.2330 [M-H]−
533.2700 [M+H-H2O]+
[M+H-C2H4O2]
[M+Cl]−
+
nd
Flavonoids
Eriodictyol 7-O rutinoside
Rutin
Narirutin
Isorhamnetin-3-O-rutinoside
Naringin
Hesperidin
Neohesperidin
Kaempferol Deoxyhexoside
Hexoside #1
Kaempferol Deoxyhexoside
Hexoside #2
595.1725 [M+H]+
+
451.0975
[M+H-Deoxyhexose]
289.0905
[M+H-HexoseDeoxyhexose]+
449.1096
[M-H-Deoxyhexose]−
609.1772 [M-H]−
611.1700 [M+H]+
+
449.1563
[M+H-Hexose]
303.0947
[M+H-HexoseDeoxyhexose]+
579.1660 [M-H]−
581.1946 [M+H]+
−
419.1390
[M+H-Hexose]
+
615.1440
[M+Cl]
273.0783
[M+H-HexoseDeoxyhexose]+
271.0668
[M-H-HexoseDeoxyhexose]−
435.1369
[M+H-Deoxyhexose]+
401.1318
[M+H-Glucose]+
603.1908
[M+Na]+
625.1985 [M+H]+
+
317.0667
[M+H-Rutinose]
479.1347
[M+H-Deoxyhexose]+
581.1829 [M+H]+
+
435.1303
[M-Hexose]
419.1327
[M-Hexose-H2O]+
273.0775
[M+H]+
611.1993 [M+H]+
+
449.1449
[M-Hexose]
301.0767
303.0947
[M-HexoseDeoxyhexose]+
279.1298
495.1524
[M+H-C5H8O3]+
611.2115 [M+H]+
[M-HexoseDeoxyhexose]−
+
449.1539
[M-Hexose]
303.0948
[M-HexoseDeoxyhexose]+
595.1475 [M+H]+
433.1568
[M+H-Hexose]+
287.1010
[M+H-HexoseDeoxyhexose]+
287.0959 [M+H-DeoxyhexoseHexose]+
639.1884
[M+HCOOH]−
593.1887 [M-H]−
Arbona et al. BMC Plant Biology (2015) 15:38
Page 9 of 16
Table 2 Identification of compounds (Continued)
595.2134
Tangeretin #1
Tangeritin #3
639.1846
[M+HCOOH]−
+
433.1555
[M-Hexose]
449.1511
[M-Deoxyhexose]+
373.1397 [M+H]+
436.1960
Tangeretin #2
[M+H]+
nd
15.04
902.4
3
CHEBI:9400
nd
15.93
955.8
3
CHEBI:9400
nd
18.14
1088.4 3
CHEBI:9400
nd
2.10
126.0
1
CHEBI:17295
nd
4.56
273.6
1
CHEBI:16828
355.0981 [M-H]−
8.10
486.0
1, 3
+
[M+NaCH2CN]
373.1397 [M+H]+
+
436.1960
[M+NaCH2CN]
411.1044
[M+K]+
395.1297
[M+Na]+
373.1397 [M+H]+
+
436.1960
[M+NaCH2CN]
411.1044
[M+K]+
395.1297
[M+Na]+
Miscellaneous compounds
Phenylalanine
Tryptophan
166.0693 [M+H]+
120.0588
[M+H-NH3]+
205.1006
[M+H]+
188.0719 [M+H-NH3]+
144.0951
Ferulic acid hexoside
[M+H-NH3-CO2]+
379.1035 [M+Na]+
+
177.0488
[M+H-Hexose-H2O]
195.0595
[M+H-Hexose]+
395.0840
[M+K]+
Annotation level: 1) co-injected with pure standards, 2) annotated matching published data and mass spectral results and 3) annotation made based on mass
spectral data, *) tentatively annotated and nd) not determined. m/z values in bold are quantifier ions.
throughout sample groups (Additional file 3: Table S1).
This was achieved using the quantifier ion (an ion with
the highest intensity within the spectrum of a given
metabolite, marked in bold in Table 2) to extract metabolite peaks with Masslynx 4.1. software.
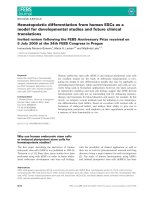
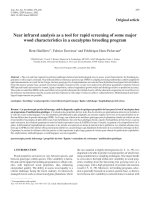
ABA and derivatives
The pathway, starting from ABA, has two major
branches: the catabolic and the conjugating branch.
The first one starts with the conversion of ABA into
8′-hydroxy ABA (catalyzed by ABA 8′-hydroxylase),
which spontaneously isomerizes to PA. This metabolite
is further catabolized to DPA by a soluble reductase
[26]. The conjugating branch involves the temporary
storage of ABA into a glycosylated form catalyzed by
an UDP-ABA glycosyl transferase (Figure 3). The most
widespread form is ABAGE which is the result of esterification at the C1 position of the carboxyl group
[26,27]. In turn, active ABA can be released from
ABAGE by a glycosidase (BGLU18, [28]).
ABA levels in fruits of the ‘Sucrenya’ orange were the
highest. Whereas, high contents of this hormone were
also found in ‘Hernandina’, ‘Midknight’, ‘Washington’, and
‘Lane late’; and ‘Fortune’, ABA levels were much lower in
lemons, grapefruits and Pixie and Nadorcott mandarin
cultivars. In general, varieties showing low ABA content
had also low concentrations of ABA catabolites, including ABAGE (Figure 3). Conversely, ‘Sucrenya’ that
showed the highest ABA levels had also the highest PA
and ABAGE levels among all varieties. These results
suggested a different ABA metabolic fingerprinting for
each variety. ABA levels seem to be regulated by degradation to DPA followed by conjugation in ‘Hernandina’.
On the other hand, ABA metabolism in ‘Nadorcott’ and
‘Pixie’ as well as in ‘Lane late’ and ‘Washington’ oranges
appeared to be channeled to the production of glycosylated forms of PA and DPA, respectively, showing scarce
accumulation of their free forms. Surprisingly, the other
blonde-type variety, ‘Midknight’, did not accumulate any
catabolite or ABA derivative, suggesting that the control
of ABA levels took place by regulating its biosynthesis
(NCED activity). On the contrary, in Fortune ABA levels
appeared to be regulated in by diverting metabolic flow
to PA and PAGE synthesis. The rest of cultivars accumulating low ABA contents such as lemons a general
downregulation of the pathway was found whereas in
Arbona et al. BMC Plant Biology (2015) 15:38
Page 10 of 16
Figure 3 Scheme of ABA metabolism, including chemical structure of free and conjugated forms and products of degradation. On every
compound a color scale indicates relative amounts in juices of each variety studied. Sample ID followed the same order as in Table 1.
grapefruits metabolite flow was directed to DPAGE synthesis (with a particular behavior of Marsh genotype that
accumulated significant amounts of PA and ABAGE).
Noteworthy, only ‘Sucrenya’ orange and ‘Marsh’ grapefruit showed significantly higher ABAGE levels than the
rest of varieties. Overall, this indicates that citrus fruits
and especially juice sacs preferentially induce the degradation pathway to reduce ABA levels (being conjugation of ABA a less relevant mechanism). In previous
reports, higher ABA levels were found in juice sacs of
satsuma mandarin (Citrus unshiu) compared to ‘Lisbon’
lemon or ‘Valencia’ orange [16]. This could be explained
in part by a higher ability of satsuma mandarin for carotenoid and xanthophyll biosynthesis in juice sacs together
with a higher metabolite flow towards xanthoxin and
ABA [29]. On the contrary, although carotenoid availability in mandarins is higher than in oranges [15], it is
likely that availability of xanthophyll substrates needed
for NCED activity is much lower probably channeling
these precursors to other metabolic pathways, thus contributing to lower ABA levels in this group (Figure 3).
Nevertheless, in ‘Nadorcott’ and ‘Pixie’ cultivars, increased degradation to PA along with its conjugation to
hexoses rendering PAGE could also contribute to decreased
Arbona et al. BMC Plant Biology (2015) 15:38
Page 11 of 16
Figure 4 Scheme of limonoid metabolic pathway arising from nomilin. On every compound a color scale indicates relative amounts in
juices of each variety studied. Sample ID followed the same order as in Table 1.
ABA levels. In contrast, the lemon and grapefruit varieties
showed lower levels of ABA and catabolites and observation coincident with the reported low carotenoid levels in
juice sacs [30].
Limonoids
Limonoids are highly oxygenated triterpenes present in
Rutaceae and Meliaceae. These compounds are derived
from squalene, although the first true limonoid precursor
is nomilin that can be directly glucosylated by a limonoid
UDP-glucosyl transferase or also deacetylated (Figure 4)
rendering obacunone. Cleavage of C-O bond at the D-ring
and reorganization of the D-ring renders the tasteless
limonoate A-ring lactone that can be alternatively glycosylated (as occurs during normal maturation) or converted
into bitter limonin [17]. All identified limonoids were
present in all varieties at different levels but especially in
lemons showed very low values (Figure 3). Particularly,
limonin glycosyl ester was present at similar levels in all
Arbona et al. BMC Plant Biology (2015) 15:38
Page 12 of 16
Figure 5 Scheme of flavonoid metabolic pathway arising from chalcone (not analyzed). On every compound a color scale indicates relative
amounts in juices of each variety studied. Sample ID followed the same order as in Table 1.
Arbona et al. BMC Plant Biology (2015) 15:38
orange and mandarin varieties but showed slightly lower
levels in the two grapefruit varieties. These two genotypes,
together with orange cultivars, also contained high concentrations of the bitter limonin whereas mandarins
showed very low values. In addition, ‘Sucrenya’ was the
only variety that had significant amounts of limonoate
A-ring lactone and obacunone, suggesting a highly active biosynthesis in this variety. Nomilin could not be
detected in this study but its glycosylated and deacetylated derivatives (Figure 4 and Table 2). Nomilin glucoside levels were much higher in ‘Sucrenya’ and ‘Pixie’
cultivars than in the rest of citrus varieties that showed
very low levels. Levels of Deacetylated nomilin glucoside
in the navel-type oranges (‘Washington’ and ‘Lane late’)
were the highest whereas they were slightly lower in
‘Midknight’ and in trace amounts in ‘Pixie’. Obacunone
glucoside levels were high in this variety and lower
levels, by decreasing order, were detected in ‘Sucrenya’,
‘Hernandina’ and the rest of oranges. This indicated
that all limonoid pool was diverted into production of
glycosides, as expected in normal maturation, but some
varieties also presented significant amounts of bitter
limonin [31], including lemons, ‘Sucrenya’, ‘Midknight’
and navel-type oranges. Nomilin glucoside, obacunone,
obacunone glucoside, limonoate A-ring lactone and its
glucoside and limonin are over-accumulated in ‘Sucrenya’
compared to the other blonde-type variety ‘Midknight’.
This suggests a particularly active limonoid biosythetic
pathway in ‘Sucrenya’ whereas in ‘Midknight’ all intermediates are readily channeled to the production of
deacetyl nomilic acid glucoside, limonin and limonin
glucoside. Indeed, limonin glucoside was highly abundant in almost all studied citrus juices (0.035% of juice
weight in mexican lime, as described in [19]) that could
also be cleaved to render free limonin upon induction
of a glucosidase [32]. The concentration of limonoid
metabolites highly increased in citrus affected by bacterial Greening Disease or Huanglongbing (HLB) [33]
suggesting a role in defense against bacterial infection.
Moreover, limonoids have exhibited significant antioxidant and antitumorigenic activity [19,20]. However,
their specific physiological role in citrus is still unknown. The results presented here also point out differences in palatable fruit quality among varieties at
optimum commercial maturation stage, likely associated to genetic differences.
Flavonoids
This class of compounds has been involved in the antioxidant and beneficial health properties of citrus. Indeed, the high radical scavenging activity of citrus
juices has been almost exclusively associated to flavonoids and other phenolic constituents [19]. In citrus,
the most abundant flavonoids are flavanones, flavones
Page 13 of 16
and flavonols being the methoxylation and glycosylation the main reactions rendering derivatives [34]. In
this study, from the same flavanone core several derivatives were identified by substitution with methyl groups
or hexose moieties: naringin, hesperidin, narirutin,
neohesperidin, and eriodictyol (Figure 5 and Table 2).
From this group, the most widespread compounds were
hesperidin, narirutin and eriodictyol 7-O-neohesperidoside,
whereas naringin and neohesperidin were exclusively
present in grapefruits. Flavonoid synthesis starts from the
flavanone naringenin by successive transfer of glycosyl
groups (a first step by which glucose is transferred to oxygen in position 7 generating a 7-O-glucoside). In turn, a
1,6 rhamnosyl transferase renders the hesperidosides
(or rutinosides) hesperidin and narirutin. Conversely,
action of 1,2 rhamnosyl transferase on flavanone 7-Ohexosides generates neohesperidosides: neohesperidin
and naringin. A very low expression of 1,6 rhamnosyl
transferases in citron, pummelo and grapefruit and
absence of 1,2 rhamnosyl transferases in mandarins
and oranges have been recently reported [35]. These
results would explain the exclusive occurrence of neohesperidosides in grapefruit cultivars in the present
work (Figure 4). Apparently, this low expression is
enough to grant occurrence of rutinosides such as
narirutin and eriodictyol 7-O rutinoside in grapefruits.
Another group of flavonoids, flavonols, synthesized from the same flavanones by hydroxylation
include isorhamnetin, kaempferol and quercetin. Rutin
showed the highest accumulation in lemons, although
it was present in most citrus cultivars included in this
study, showing significantly lower levels in ‘Fortune’
and ‘Hernandina’. This could point out a higher flavonoid 3-monooxygenase activity in these genotypes.
Isorhamnetin 3-O rutinoside derived from addition of
an hexose moiety on oxygen in position 3 catalyzed
by 3-glycosyl transferase followed by 1,6 rhamnosyl
transferase [35]. It is now clear that 1,6 rhamnosyl
transferase is present and active to different levels
in most cultivated citrus species. Therefore, the
selectivity relies on the previous action of 7- or 3glycosyl transferases. To this respect, the results obtained suggest that 3-glycosyl transferases are likely to
be rather active in grapefruit cultivars, therefore rendering flavonol 7-O rutinosides. Isorhamnetin 3-Orutinoside, product of methoxylation and subsequent
glycosylation of a flavonol moiety was found to be
highly abundant in both navel oranges and ‘Midknight’ and in the two lemon cultivars which could
point out at flavonol A-ring methoxylation being
highly active in these genotypes. On the other hand,
polymethoxylated flavones, derived from flavanone in
a reaction catalyzed in turn by flavone synthase and
flavone A-ring methyl transferases were completely
Arbona et al. BMC Plant Biology (2015) 15:38
absent in lemon and grapefruit cultivars, suggesting a
lower enzyme activity or expression.
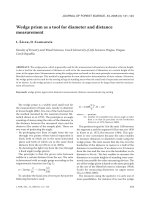
Miscellaneous compounds
Precursor compounds such as phenylalanine, ferulic
acid hexoside and tryptophan were grouped under
this epigraph (Figure 6). Phenylalanine, along with
Tyr, is the precursor of all aromatic compounds
Figure 6 Relative levels of miscellaneous metabolites identified
in citrus juices: tryptophan (a), phenylalanine (b) and a ferulic
acid hexoside (c). Sample ID is given in x-axis.
Page 14 of 16
(among which flavonoids and phenolic acids are
found) through reaction catalyzed by PAL and CHS.
Results indicated that this precursor compounds are
not limiting for all derived compounds and therefore
differences in flavonoid composition are due to variations in the expression of genes encoding for metabolic enzymes acting downstream CHS. To this
respect, ferulic acid hexoside was scarce in juices of
‘Sucrenya’ but, conversely, this variety did not show
any limitation in flavonoid biosynthesis (Figure 5),
suggesting that biosynthetic restrains did not affect
steps upstream ferulic acid. In the rest of genotypes,
this metabolite was moderately abundant with the exception of ‘Fortune’ and ‘Midknight’ which juices had
significantly higher levels of this compound. Content
of tryptophan, an aminoacid precursor of indolic
compounds and the auxin indole-3-acetic acid, was
found to be extremely scarce in the vast majority of
citrus varieties assayed with the exception of the two
grapefruit cultivars studied, with values four-fold higher
than the average levels.
Conclusions
Organoleptic quality is associated not only to primary attributes such as soluble solids (sugars) and acids (mainly
citric acid) but other minor compounds such as triterpenoids, flavonoids, coumarins and anthocyanidins. Recently, these compounds have gained scientific and
commercial attention due to their beneficial effects on
human health and also as important phylogenetic
markers. It is well known that metabolites are the downstream products of gene expression and, as such, subjected to a thorough selection process. Therefore,
secondary metabolites can be used either as quality traits
or as markers for the selection and/or certification of
different fruit sources [12] or for the physiological evaluation of plant genotypes [7]. To this regard, in this work
we have focused only in commercial subspecies arising
from reciprocal crosses between different citrus ancestor
lines: Citrus maxima (pummelo), Citrus reticulata (mandarin), Citrus medica (citron) and Citrus aurantifolia
(mexican lime). To further investigate the inheritance of
specific metabolite traits, an exhaustive analysis including these ancestor species should be performed. Nevertheless, the results presented in this manuscript indicate
that LC/ESI-QTOF-MS non-targeted metabolite profiling is an efficient technique to profile secondary metabolites in citrus juices with little sample processing
(squeezing, centrifuging and filtering). In addition, this
technique could be coupled to multivariate analysis as
data mining technique to allow separation of different
fruit sources: lemons, grapefruits, mandarins, navel and
blonde oranges and, more importantly, the differentiation of varieties within a particular group.
Arbona et al. BMC Plant Biology (2015) 15:38
Page 15 of 16
Additional files
Additional file 1: Figure S1. Phylogenetic tree depicting relationships
between all known parental ancestor lines and commercial genotypes.
Additional file 2: Figure S2. 2D scores (left) and loadings (right) plots
depicting different projections: a) component 1 vs. component 2, b)
component 2 vs. component 3, c) component 5 vs. component 6, d)
component 7 vs. component 8, e) component 9 vs. component 10 and f)
component 1 vs. component 11. In scores plots, clearly demarcated
variety sample groups are indicated; in loadings plots variables potentially
contributing to variety demarcation are indicated in red.
Additional file 3: Table S1. Confirmation of Metabolite Candidates for
Classification of Citrus Varieties by ANOVA followed by Fisher Least
Significant Difference test.
Abbreviations
LC/MS: Liquid chromatography coupled to mass spectrometry;
PTFE: Polytetrafluoroethylene, teflon; QTOF-MS: Quadrupole time-of-flight
mass spectrometry; HPLC: High performance liquid chromatography;
ESI: Electrospray ionization; HCA: Hierarchical cluster analysis; PLS-DA: Partial
least squares discriminant analysis; VIP: Variable importance for the projection
(related to PLS-DA); ABA: Abscisic acid; NCED: Nine cis-epoxycarotenoid
dioxygenase; ANOVA: Analysis of variance; PA: Phaseic acid; DPA: Dehydrophaseic
acid; ABAGE: Abscisic acid glycosyl ester; PAL: Phenylalanine ammonia lyase;
CHS: Chalcone synthase.
6.
7.
8.
9.
10.
11.
12.
13.
14.
Competing interests
The authors declare that they have no competing interests.
15.
Authors’ contributions
VA, DJI and AGC designed and planned experiments. DJI harvested and
authenticated citrus samples. VA performed sample processing, instrument
measurements and analysis of data. VA and AGC wrote the manuscript and
elaborated results. All authors have read and approved the final version of
the manuscript.
16.
Acknowledgements
This project was funded by the Spanish Ministerio de Economia y Competitividad
(MINECO) and Universitat Jaume I through grants AGL2013-42038-R and P1
1B2013-23, respectively, to Aurelio Gómez-Cadenas. LC/ESI-QTOF-MS
measurements were carried out at Central Instrument Facilities (SCIC) of
Universitat Jaume I, assistance of Dr. Cristian Vicent in mass spectrometric
measurements is greatly acknowledged.
17.
18.
19.
20.
21.
Author details
1
Laboratori d’Ecofisiologia i Biotecnologia, Departament de Ciències Agràries
i del Medi Natural, Universitat Jaume I, E-12071 Castelló de la Plana, Spain.
2
Institut Valencià d’Investigacions Agràries (IVIA), Moncada, Spain.
22.
Received: 29 September 2014 Accepted: 20 January 2015
23.
References
1. Distefano G, Las Casas G, Caruso M, Todaro A, Rapisarda P, La Malfa S, et al.
Physiological and molecular analysis of the maturation process in fruits of
Clementine Mandarin and one of its late-ripening mutants. J Agric Food
Chem. 2009;57:7974–82.
2. Koca U, Berhow M a, Febres VJ, Champ KI, Carrillo-Mendoza O, Moore G a.
Decreasing unpalatable flavonoid components in Citrus: the effect of
transformation construct. Physiol Plant. 2009;137:101–14.
3. González-Molina E, Moreno D a, García-Viguera C. Genotype and harvest
time influence the phytochemical quality of Fino lemon juice (Citrus limon
(L.) Burm. F.) for industrial use. J Agric Food Chem. 2008;56:1669–75.
4. Xu G, Liu D, Chen J, Ye X, Shi J. Composition of major flavanone glycosides
and antioxidant capacity of three citrus varieties. J Food Biochem.
2009;33:453–69.
5. Giménez-Bastida J a, Martínez-Florensa M, Espín J-C, Tomás-Barberán F a,
García-Conesa M-T. A citrus extract containing flavanones represses
plasminogen activator inhibitor-1 (PAI-1) expression and regulates multiple
24.
25.
26.
27.
28.
29.
inflammatory, tissue repair, and fibrosis genes in human colon fibroblasts.
J Agric Food Chem. 2009;57:9305–15.
Dhuique-Mayer C, Fanciullino A-L, Dubois C, Ollitrault P. Effect of genotype
and environment on citrus juice carotenoid content. J Agric Food Chem.
2009;57:9160–8.
Pan Z, Li Y, Deng X, Xiao S. Non-targeted metabolomic analysis of orange
(Citrus sinensis [L.] Osbeck) wild type and bud mutant fruits by direct
analysis in real-time and HPLC-electrospray mass spectrometry. Metabolomics.
2013;10:508–23.
Terol J, Soler G, Talon M, Cercos M. The aconitate hydratase family from
Citrus. BMC Plant Biol. 2010;10:222.
Arbona V, Manzi M, de Ollas C, Gómez-Cadenas A. Metabolomics as a tool to
investigate abiotic stress tolerance in plants. Int J Mol Sci. 2013;14:4885–11.
Arbona V, López-climent MF, Pérez-Clemente RM, Gómez-cadenas A.
Maintenance of a high photosynthetic performance is linked to flooding
tolerance in citrus. Env Exp Bot. 2009;66:135–42.
Böttcher C, Westphal L, Schmotz C, Prade E, Scheel D, Glawischnig E. The
multifunctional enzyme CYP71B15 (PHYTOALEXIN DEFICIENT3) converts
cysteine-indole-3-acetonitrile to camalexin in the indole-3-acetonitrile
metabolic network of Arabidopsis thaliana. Plant Cell. 2009;21:1830–45.
Vaclavik L, Schreiber A, Lacina O, Cajka T, Hajslova J. Liquid
chromatography–mass spectrometry-based metabolomics for authenticity
assessment of fruit juices. Metabolomics. 2011;8:793–803.
IPGRI. Descriptors for Citrus. Rome (Italy): International Plant Genetic
Resources Institute (IPGRI); 1999. p. 75.
Arbona V, Iglesias DJ, Talón M, Gómez-Cadenas A. Plant phenotype
demarcation using nontargeted LC-MS and GC-MS metabolite profiling.
J Agric Food Chem. 2009;57:7338–47.
Goodner KL, Rouseff RL, Hofsommer HJ. Orange, mandarin, and hybrid
classification using multivariate statistics based on carotenoid profiles.
J Agric Food Chem. 2001;49:1146–50.
Kato M, Matsumoto H, Ikoma Y, Okuda H, Yano M. The role of carotenoid
cleavage dioxygenases in the regulation of carotenoid profiles during
maturation in citrus fruit. J Exp Bot. 2006;57:2153–64.
Manners GD. Citrus limonoids: analysis, bioactivity, and biomedical
prospects. J Agric Food Chem. 2007;55:8285–94.
Schoch TK, Manners GD, Hasegawa S. Analysis of limonoid glucosides from
citrus by electrospray ionization liquid chromatography-mass spectrometry.
J Agric Food Chem. 2001;49:1102–8.
Patil JR, Chidambara Murthy KN, Jayaprakasha GK, Chetti MB, Patil BS.
Bioactive compounds from Mexican lime (Citrus aurantifolia) juice induce
apoptosis in human pancreatic cells. J Agric Food Chem. 2009;57:10933–42.
Perez JL, Jayaprakasha GK, Valdivia V, Munoz D, Dandekar DV, Ahmad H,
et al. Limonin methoxylation influences the induction of glutathione
S-transferase and quinone reductase. J Agric Food Chem. 2009;57:5279–86.
Tovar MJ, Romero MP, Girona J, Motilva MJ. L-Phenylalanine ammonia-lyase
activity and concentration of phenolics in developing olive (Olea europaea L
cv Arbequina) fruit grown under different irrigation regimes. J Sci Food
Agric. 2002;82:892–8.
Sanchez-Vallet A, Ramos B, Bednarek P, López G, Piślewska-Bednarek M,
Schulze-Lefert P, et al. Tryptophan-derived secondary metabolites in
Arabidopsis thaliana confer non-host resistance to necrotrophic
Plectosphaerella cucumerina fungi. Plant J. 2010;63:115–27.
Turecková V, Novák O, Strnad M. Profiling ABA metabolites in Nicotiana
tabacum L. leaves by ultra-performance liquid chromatography-electrospray
tandem mass spectrometry. Talanta. 2009;80:390–9.
Tian Q, Schwartz SJ. Mass spectrometry and tandem mass spectrometry of
Citrus limonoids. Anal Chem. 2003;75:5451–60.
Djoukeng JD, Arbona V, Argamasilla R, Gomez-cadenas A. Flavonoid profiling in
leaves of citrus genotypes under different environmental situations. J Agric
Food Chem. 2008;56:11087–97.
Nambara E, Marion-Poll A. Abscisic acid biosynthesis and catabolism.
Ann Rev Plant Biol. 2005;56:165–85.
Priest DM, Ambrose SJ, Vaistij FE, Elias L, Higgins GS, Ross ARS, et al. Use of
the glucosyltransferase UGT71B6 to disturb abscisic acid homeostasis in
Arabidopsis thaliana. Plant J. 2006;46:492–502.
Schroeder JI, Nambara E. A quick release mechanism for abscisic acid. Cell.
2006;126:1023–5.
Zhang L, Ma G, Kato M, Yamawaki K, Takagi T, Kiriiwa Y, et al. Regulation of
carotenoid accumulation and the expression of carotenoid metabolic genes
in citrus juice sacs in vitro. J Exp Bot. 2012;63:871–86.
Arbona et al. BMC Plant Biology (2015) 15:38
Page 16 of 16
30. Matsumoto H, Ikoma Y, Kato M, Kuniga T, Nakajima N, Yoshida T.
Quantification of carotenoids in citrus fruit by LC-MS and comparison of
patterns of seasonal changes for carotenoids among citrus varieties. J Agric
Food Chem. 2007;55:2356–68.
31. Breksa AP, Ibarra P. Colorimetric method for the estimation of total
limonoid aglycones and glucoside contents in citrus juices. J Agric Food
Chem. 2007;55:5013–7.
32. Breksa AP, Hidalgo MB, Wong RY. Stability of limonin glucoside in beverage
matrices. J Sci Food Agric. 2008;88:2194–200.
33. Manthey JA. Differences in secondary metabolites in leaves from orange
(Citrus sinensis L.) trees affected with Greening Disease (Huanglongbing)
(HLB). Proc Florida State Hortic Soc. 2008;121:285–8.
34. Gattuso G, Barreca D, Gargiulli C, Leuzzi U, Caristi C. Flavonoid composition
of Citrus juices. Molecules. 2007;12:1641–73.
35. Frydman A, Liberman R, Huhman DV, Carmeli-Weissberg M, Sapir-Mir M,
Ophir R, et al. The molecular and enzymatic basis of bitter/non-bitter flavor
of citrus fruit: evolution of branch-forming rhamnosyltransferases under
domestication. Plant J. 2012;73:166–78.
Submit your next manuscript to BioMed Central
and take full advantage of:
• Convenient online submission
• Thorough peer review
• No space constraints or color figure charges
• Immediate publication on acceptance
• Inclusion in PubMed, CAS, Scopus and Google Scholar
• Research which is freely available for redistribution
Submit your manuscript at
www.biomedcentral.com/submit