High-density genetic map construction and QTLs analysis of grain yield-related traits in Sesame (Sesamum indicum L.) based on RAD-Seq techonology
Bạn đang xem bản rút gọn của tài liệu. Xem và tải ngay bản đầy đủ của tài liệu tại đây (1.49 MB, 14 trang )
Wu et al. BMC Plant Biology 2014, 14:274
/>
RESEARCH ARTICLE
Open Access
High-density genetic map construction and QTLs
analysis of grain yield-related traits in Sesame
(Sesamum indicum L.) based on RAD-Seq
techonology
Kun Wu1, Hongyan Liu1, Minmin Yang1, Ye Tao2, Huihui Ma3, Wenxiong Wu1, Yang Zuo1 and Yingzhong Zhao1*
Abstract
Background: Sesame (Sesamum indicum L., 2n = 26) is an important oilseed crop with an estimated genome size
of 369 Mb. The genetic basis, including the number and locations of quantitative trait loci (QTLs) of sesame grain
yield and quality remain poorly understood, due in part to the lack of reliable markers and genetic maps. Here
we report on the construction of a hitherto most high-density genetic map of sesame using the restriction-site
associated DNA sequencing (RAD-seq) combined with 89 PCR markers, and the identification of grain yield-related
QTLs using a recombinant inbred line (RIL) population.
Result: In total, 3,769 single-nucleotide polymorphism (SNP) markers were identified from RAD-seq, and 89
polymorphic PCR markers were identified including 44 expressed sequence tag-simple sequence repeats (EST-SSRs),
10 genomic-SSRs and 35 Insertion-Deletion markers (InDels). The final map included 1,230 markers distributed on 14
linkage groups (LGs) and was 844.46 cM in length with an average of 0.69 cM between adjacent markers. Using this
map and RIL population, we detected 13 QTLs on 7 LGs and 17 QTLs on 10 LGs for seven grain yield-related traits
by the multiple interval mapping (MIM) and the mixed linear composite interval mapping (MCIM), respectively.
Three major QTLs had been identified using MIM with R2 > 10.0% or MCIM with h2a > 5.0%. Two co-localized QTL
groups were identified that partially explained the correlations among five yield-related traits.
Conclusion: Three thousand eight hundred and four pairs of new DNA markers including SNPs and InDels were
developed by RAD-seq, and a so far most high-density genetic map was constructed based on these markers in
combination with SSR markers. Several grain yield-related QTLs had been identified using this population and
genetic map. We report here the first QTL mapping of yield-related traits with a high-density genetic map using
a RIL population in sesame. Results of this study solidified the basis for studying important agricultural traits and
implementing marker-assisted selection (MAS) toward genetic improvement in sesame.
Keywords: Genetic map, QTLs, RAD-seq, RIL, Sesame, Grain yield-related traits
* Correspondence:
1
Key Laboratory of Biology and Genetic Improvement of Oil Crops, Ministry
of Agriculture, Sesame Genetic Improvement Laboratory, Oil Crops Research
Institute of the Chinese Academy of Agricultural Sciences (OCRI-CAAS),
Wuhan, Hubei 430062, China
Full list of author information is available at the end of the article
© 2014 Wu et al.; licensee BioMed Central Ltd. This is an Open Access article distributed under the terms of the Creative
Commons Attribution License ( which permits unrestricted use, distribution, and
reproduction in any medium, provided the original work is properly credited. The Creative Commons Public Domain
Dedication waiver ( applies to the data made available in this article,
unless otherwise stated.
Wu et al. BMC Plant Biology 2014, 14:274
/>
Background
Sesame (Sesamum indicum L.) is an important and
ancient oilseed crop [1]. It is a diploid species (2n = 26)
with an estimated genome size of 369 Mb [2]. Sesame
seed has the highest oil contents compared with rapeseed, peanut, soybean and other oilcrops [3]. It is also
rich in proteins, vitamins and specific antioxidants such
as sesamin and sesamolin [4,5], making it one of the best
choices for health foods. As the market demand of
sesame seeds is rapidly growing, it becomes one of the
most important goals to stably improve grain yield of
sesame by genetic approaches. Grain yield of sesame per
plant is considered to be composed of three components, i.e. the number of capsules per plant, the number
of grains per capsule and the grain weight. Some other
factors, including plant height, length of capsules (floral)
and axis height of the first capsule were found to
strongly associated with grain yield of sesame [6]. Since
the grain yield-related traits are inherited quantitatively
and governed by multiple genes sensitive to the environment, QTL-mapping is needed to dissect the genetics of
these traits [7]. The high-density genetic map had been
proved to be a very effective and important approach for
QTLs detection in rice [8-11] and other crops [12-14].
Unfortunately, there are no yield-related QTLs or genes
have been reported in sesame due in part to the lack of
reliable DNA markers and genetic maps constructed
based on permanent populations.
The first genetic linkage map of sesame was constructed using an F2 population derived from the intervariety cross of ‘COI1134’ (white seed coat) and ‘RXBS’
(black seed coat) [15]. This map was 936.72 cM in genetic length with an average marker distance of 4.93 cM.
It contained 220 markers, including 8 expressed sequence
tag-simple sequence repeats (EST-SSRs), 25 amplified
fragment length polymorphism (AFLPs) and 187 Random
Selective Amplification of Microsatellite Polymorphic Loci
(RSAMPLs), that are distributed on 30 linkage groups,
which is more than 2 folds the number of chromosomes
of the haploid sesame genome. Later, 14 more genic-SSRs
developed from RNA-seq were integrated onto this map
[16]. More recently, this map was improved substantially
by placement of more markers using an enlarged F2
population [17]. This reduced the number of LGs to 14,
only one LG more than the haploid chromosome number of sesame. The genetic length of this new map was
1,216 cM, and the marker density was 1.86 cM per
marker interval. Four QTLs controlling seed coat color
with a heritability ranging from 59.33% to 69.89% were
detected in F3 populations.
The emergence of massively-parallel, next-generation
sequencing (NGS) platforms with continually reducing
costs offers unprecedented opportunities for genomewide marker development and genotyping by sequencing
Page 2 of 14
(GBS). Several NGS methods are combined with restriction enzyme digestion to reduce the complexity of the
target genomes, making the sequencing load and cost
significantly declined [18], while still capable of discovering thousands of single-nucleotide polymorphisms
(SNPs) or insertion-deletions (InDels) markers [19-21].
The restriction-site associated DNA sequencing (RADseq) was one of the NGS methods that sequencing only
the DNA flanking specific restriction enzyme sites to
produce a reduced representation of genome, which
ligated an adapter containing multiplex identifiers (MIDs)
in the reduced-representation libraries (RRLs) [22-27]. In
these ways, several high-density genetic maps have been
constructed in eggplant [28], ryegrass [13], barley [14],
grape [27] and even sesame [29]. Recently, a high-density
genetic map of sesame was constructed based on an F2
population using the specific length amplified fragment
sequencing (SLAF-seq) technology, which is an enhanced
RRL sequencing strategy for de novo SNP discovery from
large populations [21,29]. This map comprises 1,233 SLAF
markers that are distributed on 15 linkage groups (LGs),
and is 1,474.87 cM in length with average marker spacing
of 1.20 cM. Collectively, all the three published sesame
genetic maps are not ideal for quantitative traits mapping
as they are all on the basis of a temporary population (F2)
that renders repeated phenotyping unfeasible [30]. Moreover, these maps are not comparable as they lack common
markers.
In this study, we identified three thousand seven hundred
and sixty-nine pairs of SNP markers through RAD-seq of
two sesame varieties ‘Zhongzhi 14’ and ‘Miaoqianzhima’.
These markers combined with 1,195 previously reported
EST-SSR or genomic-SSR and 79 InDel markers [31],
were used to construct a high-density genetic map of
sesame using a recombinant inbred line (RIL) population.
We further present the identification of grain yield-related
QTLs based on these novel genomic resources.
Results
RAD sequencing, SNPs and InDels discovery
A total of 62.57 Gb high-quality sequence data containing
312,829,823 pair-end reads was obtained. The read
number for the 224 RILs ranged from 598,119 to
3,483,606 with an average of 1,644,718. For the two parents, 3,030,776 reads were from the female parent and
3,881,579 reads were from male parent. After, the number of RAD-tags identified from the male and female
parents was 231,000 and 207,000, respectively. The
average coverage for individual tag was 16.80-fold in the
male parent and 14.64-fold in the female parent. The
number of comparable RAD-tags between the two parents was 47,247. However, only 3,769 SNP had been
identified for two parents of the RIL population. Most
of these SNPs were transition type SNPs with Y(T/C)
Wu et al. BMC Plant Biology 2014, 14:274
/>
Page 3 of 14
distributed on 9 LGs, excluding LG2, LG8, LG9, LG10
and LG14, with the largest gap of 22.54 cM located on
LG6. Most of these gaps were located near the end of
the linkage groups (Figure 1), which was considered a
reflection of high levels of recombination at distal regions
of chromosomes [39,40]. Furthermore, the distributions of
SSR, InDel and SNP markers toward different LGs are
random, with less than 10% SSR or InDel markers each
LGs.
One thousand one hundred and fifteen mapped markers
segregated in the expected 1:1 ratio in the population.
However, segregation of 115 mapped markers, including 4
SSRs, 2 InDels and 109 SNPs, were significantly deviated
from this ratio (P <0.05) (Table 2). Seventy-seven (61.1%)
segregation distorted markers exhibited skewed genotypic
frequencies toward ‘Zhongzhi 14’, while 49 (38.9%) toward
‘Miaoqianzhima’. Most of these markers have no effect
on the calculation of map distance, except SBN1614,
SBN3567 and GSSR074. Compared to mapped SNP
markers and InDel markers, the mapped SSR markers
had the highest percentage of skewed markers at 17.4%.
These segregation distortion markers were distributed
on 13 LGs, excepting LG14. The largest LG4 with 227
mapped markers had the most segregation distortion
markers. The frequency of segregation distortion marker
on LG12 was much higher than for other LGs at 39.4%.
Four regions of segregation distortion (SDR) were detected on four LGs, including LG2, LG4, LG6 and LG12
(Table 2). Most of these SDRs distributed near the end
of their LGs, with 3 to 5 skewed markers each and
accounting for 14.3% of the total skewed markers in the
map. Most skewed markers in four SDRs were SNP
type, with one EST-SSR marker (ZM1197) and one
InDel marker (SBI035) in SDR-LG4. All the markers in
SDR-LG2, SDR-LG6, and SDR-LG12 exhibited skewed
and R(G/A) types accounting for 30.43% and 30.78%,
respectively (Additional file 1). Besides SNPs, 97 InDels
(≥2 bp) were identified with 79 successfully designed for
further PCR verification and population genotype analysis [31].
Combined with previously published sesame SSRs, a
total of 1061 EST-SSRs, 134 genomic-SSRs and 79 InDels
were surveyed on the genomic DNA of the two parents.
Eighty-nine of these PCR markers detected polymorphism
including 44 EST-SSRs, 10 genomic-SSRs and 35 InDels.
The efficiencies of EST-SSRs, genomic-SSRs, InDels and
SNPs markers in detecting polymorphism between
parents varied from 5.0% with EST-SSRs to 46.7% with
InDels. All of these polymorphic SSR and InDel markers
detected codominant loci.
Genetic mapping
Before genetic mapping of these markers, 656 SNP
markers and 1 InDel marker that had more than 40%
missing data in the RIL population were excluded. Another
1,786 SNPs, 15 InDels, 24 EST-SSRs and 4 genomic-SSRs
were also excluded for their excessively distorted pattern
with segregation ratios of the minor allele frequency less
than 0.29. Therefore, a final set of 1,327 SNPs, 19 InDels
and 26 SSRs, which mostly inherited in a codominant
manner, were used for genetic map construction (Table 1).
As a result, 1,230 markers, including 1,190 SNPs, 22
SSRs and 18 InDels were mapped onto 14 different LGs,
covering 844.46 cM of the sesame genome and giving an
average distance of only 0.69 cM between adjacent
markers (Figure 1, Additional file 2). The length of individual LGs varies from 6.08 cM to 130.52 cM, with the
average marker distance per LG ranging from 0.23 cM
to 1.92 cM and the marker number per LG from 26 to
227 (Table 2). There were 16 gaps more than 10 cM
Table 1 Summary of markers surveyed for genetic mapping
Type
Series code
No. of
markers
or tags
Number of markers
Source
With clear
bands
Detected
polymorphism
Excessively
misseda
Excessively
distortedb
Used for
mappingc
Mapped
Genomic-SSR
GB, GSSR
134
107
10
0
4
6
6
Dixit et al. [32];
Cho et al. [33];
Spandana et al. [34]
EST-SSR
ZHY, HS, ZM,
SEM, Y, SBM
1,061
872
44
0
24
20
16
Wei et al. [15];
Zhang et al. [16];
Yue et al. [35];
Wei et al. [36];
Wang et al. [37];
Yepuri et al. [38];
Wu et al. [31]
InDel
SBI
79
75
35
1
15
19
18
Wu et al. [31]
SNP
SBN
47,247
-
3,769
656
1,786
1,327
1,190
Authors’ laboratory
Total
-
-
-
3,858
657
1,829
1,372
1,230
-
a
b
Number of excessively missed markers with more than 40% missing data in population; Number of excessively distorted markers with segregation ratios of the
minor allele frequency less than 0.29; cNumber of markers used for genetic mapping without excessively missed or distorted.
Wu et al. BMC Plant Biology 2014, 14:274
/>
Page 4 of 14
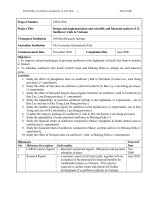
Figure 1 The high-density genetic map of sesame. a Linkage groups 1 to 7. b Linkage groups 8 to 14. Numbers to the left of each LG are
marker positions (cM). The SNP, SSR and InDel markers on the map are in black, red and blue, respectively. The segregation distorted markers on
the map are represented by asterisks next to the marker locus name.
Wu et al. BMC Plant Biology 2014, 14:274
/>
Page 5 of 14
Table 2 Distribution of mapped markers on the 14 linkage groups of sesame
Linkage
group
Number of markersa
Length
(cM)
Average
distance (cM)
Largest
gap (cM)
No. of
gaps >10 cM
No. of
SDRsb
0
55.54
0.37
11.26
1
0
1
2
54.9
0.54
8.38
0
1
2(1)
2
83.25
1.08
10.3
1
0
220(22)
4(1)
3(1)
95.58
0.42
13.38
3
1
71(4)
4
3
76.88
0.99
16.44
1
0
183(14)
180(13)
1(1)
2
102.99
0.56
22.54
2
1
120(10)
112(9)
5(1)
3
130.52
1.09
19.56
3
0
LG8
72(11)
69(10)
2
1(1)
58.45
0.81
7.96
0
0
LG9
50(2)
50(2)
0
0
21.62
0.43
5.6
0
0
LG10
44(5)
43(5)
0
1
16.73
0.38
2.73
0
0
LG11
38(4)
37(4)
1
0
57.79
1.52
11.22
1
0
LG12
33(13)
31(13)
1
1
28.38
0.86
22.26
1
1
LG13
29(1)
28(1)
1
0
55.75
1.92
20.05
3
0
LG14
26(0)
26
0
0
6.08
0.23
2.49
0
0
Total
1230(115)
1190(109)
22(4)
18(2)
844.46
0.69
-
16
4
Total
SNP
SSR
InDel
LG1
152(7)
152(7)
0
LG2
101(11)
98(11)
LG3
77(9)
73(8)
LG4
227(24)
LG5
78(4)
LG6
LG7
a
The number of segregation distortion markers are given in parentheses; bSDR means segregation distortion region.
genotypic frequencies towards ‘Zhongzhi 14’, while towards ‘Miaoqianzhima’ in SDR-LG4.
Phenotypic analysis
In all experiments, seven yield-related traits showed significant differences between the mapping parental lines.
Compared to Miaoqianzhima, the male parent Zhongzhi
14 displayed significantly taller plant height (PH), shorter
first capsule height (FCH), longer capsule axis length
(CAL), more capsule number per plant (CN), shorter capsule length (CL) and larger thousand grain weight (TGW)
(Figure 2). The PH, FCH, CAL and TGW in 2013FY or
2013WC were missed for their bad field performance
caused by extreme weathers. Interestingly, the average
grain number per capsule (GN) of Zhongzhi 14 was
more than Miaoqianzhima in Wuchang (2012WC,
2013WC), while less in Fuyang (2012FY and 2013FY).
All traits showed a continuous distribution and transgressive segregation in the RIL population (Figure 2),
indicating governed by multiple genes. The near-normal
curve distribution of PH, FCH, CAL, GN and TGW
suggested a polygene mode of the genetic control; but
CL and CN showed a bimodal distribution, suggesting
the involvement of major effect genes. Analysis of variance (ANOVA) showed that the between-line variations
of all traits in each trial were significant at P = 0.001.
The broad-sense heritability of the seven traits ranged
from 29.8% (FCH) to as high as 95.7% (CN) (Table 3).
The heritabilities of each trait are in line with their
corresponding distributions.
Trial-wide correlation coefficients of all seven traits
were significant at the level of P =0.01 (Additional file
3). Correlation of CL among different environments (years
or locations) were strong with the coefficients above
0.80, while much weaker correlation for CAL were
noted with the coefficients ranging from 0.27 to 0.35.
Across the three environments where phenotypic data
were available (2012WC, 2012FY and 2013YL), significant positive correlations were observed between PH
and FCH (P ≤0.01), PH and CAL (P ≤0.01), PH and
TGW (P ≤0.05), FCH and TGW (P ≤0.05), even CL and
GN (P ≤0.01), while significant negative correlation were
observed between CN and TGW (P ≤0.05) (Table 4).
More interestingly, GN and TGW were positively correlated in 2012FY (P ≤0.01), but negatively correlated in
2013YL (P ≤0.01).
QTL analysis
A total of 13 yield-related QTLs were found on 7 linkage
groups using the multiple interval mapping (MIM)
methods. A range of one to three QTLs were detected
for individual traits (Table 5). Six QTLs were detectable
in more than one trial, including Qph-12, Qtgw-11, Qgn-1,
Qgn-6, Qgn-12 and Qcl-12, while others were repeatable
by two softwares. Most of them showed positive additive
effects by the alleles of Zhongzhi 14 except Qgn-12 and
Qcl-12. Six major-effect QTLs were detected with the
phenotypic effect (R2) more than 10%, including one
QTL, Qcl-12, showing R2 ranged from 52.2% to 75.6%.
QTL mapping was also performed with QTLNetwork
2.0 under the mixed linear composite interval mapping
Wu et al. BMC Plant Biology 2014, 14:274
/>
Page 6 of 14
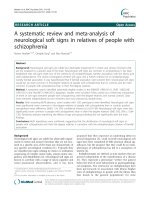
Figure 2 Distributions of the phenotypic data in the ‘Miaoqianzhima × Zhongzhi 14’ RIL population. PH, plant height; FCH, first capsule
height; CAL, capsule axis length; CN, capsule number per plant; CL, capsule length, GN, grain number per capsule; TGW, thousand grain weight.
Mean and standard deviation of two parents are indicated at the top of each histogram, with Z and M representing Zhongzhi 14 and Miaoqianzhima,
respectively.
Wu et al. BMC Plant Biology 2014, 14:274
/>
Page 7 of 14
Table 3 QTLs for grain yield-related traits and their epistasis detected by MCIM from the analysis of the RILs in
multi-trials
aea
QTL
LG
Marker interval
QTL
region (cM)
QTL peak
position
Additive
effecta
h2a(%)b
Plant height
Qph-6
LG6
SBN3089-SBN3112
33.5-33.8
33.5
3.0724***
3.63
Qph-12
LG12
ZM1466-SBI005
13.5-22.3
22.0
2.8852***
3.36
First capsule
height
Qfch-4
LG4
SBN3000-SBN1825
60.7-60.8
60.8
2.0016***
4.72
Qfch-11
LG11
SBN1622-SBN3137
8.3-17.9
13.3
2.1111***
5.02
Qfch-12
LG12
ZM1466-SBI005
12.0-22.3
19.0
2.0667***
3.37
Qcal-5
LG5
SBN3577-SBN3576
43.7-44.4
43.9
1.7741***
2.54
Qcal-9
LG9
SBN3559-SBN2018
2.1-4.6
3.4
1.7761***
1.99
Capsule number
per plant
Qcn-11
LG11
SBN1622-SBN3137
11.3-17.9
15.3
−4.1764***
4.48
95.7
Thousand grain
weight
Qtgw-11
LG11
SBN1798-SBN1765
18.2-20.2
19.2
0.0638***
5.78
48.9
Grain number
per capsule
Qgn-1
LG1
SBN1076-SBN2389
29.7-36.0
34.7
1.2248***
1.82
54.6
Qgn-6
LG6
SBN1261-SBN1801
88.3-92.9
92.3
1.7740***
5.61
Qgn-12
LG12
SBN1362-SBN3344
26.0-26.7
26.3
−1.4724***
4.26
Qcl-3
LG3
SBN2902-SBN1034
76.1-77.4
76.4
−0.0857***
3.13
Qcl-4
LG4
SBN2166-SBN1014
64.1-64.2
64.1
0.0653***
3.02
Qcl-7
LG7
SBN3401-SBN3441
73.8-79.0
77.0
0.0529***
1.93
Qcl-8
LG8
SBN1686-SBN3565
11.0-11.2
11.1
0.0420***
1.70
Qcl-12
LG12
ZM1466-SBI005
14.0-18.0
16.0
−0.4237***
45.39
Capsule axis length
Capsule length
Trait
Epistatic
interaction
Nearest marker
QTL peak
position (cM)
aaa
h2aa(%)b
First capsule height
Qfch-4 and Qfch-12
SBN3000 and SBI005
60.8 and 19.0
1.2998***
1.59
h2ae(%)b
H2(%)c
Traits
32.5
29.8
69.7
−0.8819*
1.16
86.8
a
Positive and negative values indicated additive effect, additive × environment interaction effect (ae) or epistatic interaction additive effect (aa) by the alleles of
Zhongzhi 14 and Miaoqianzhima, respectively; bContibution ratio of QTL additive effect, additive × environment interaction effect (ae) or epistatic interaction
additive effect (aa); *, **, *** Significant at 0.05, 0.01, 0.001 probability levels, respectively; cThe broad-sense heritability (H2) was calculated with the formula
H2 = σ2g/(σ2g + σ2e /r).
(MCIM) algorithm to dissect the main additive effects
(a), the additive-additive epistatic effects (aa) and the
additive-environmental interaction effects (ae) in multitrials. A total of 17 QTLs were detected on 10 linkage
groups (Table 3). All of them had significant a effects,
and Qgn-6 also had significant ae effects at P ≤0.05 in
2013FY. All of them showed significant additive effect at
P ≤0.001, and explained 1.70-45.39% of the phenotype
variation with four major QTLs larger than 5.0%. Two
QTLs for first capsule height, Qfch-4 and Qfch-12, were
also detected with significant aa effect explained 1.59%
of the phenotypic variation (Table 3).
We also compared QTLs that both identified using
MIM and MCIM for seven different yield-related traits.
Thirteen QTLs were detected by two methods with
similar QTL regions, while Qcl-3, Qcl-4, Qcl-7 and Qcl-8
were only detected by MCIM. Three major-effect QTLs
were detected by two methods with R2 > 10.0% or h2a >
5.0%, including Qtgw-11, Qgn-6 and Qcl-12. Furthermore, the Qph-12 and Qfch-12, contributed by Zhongzhi
14, and Qcl-12 contributed by Miaoqianzhima, were colocated. Three QTLs, Qfch-11 and Qtgw-11 contributed by
Zhongzhi 14, and Qcn-11 contributed by Miaoqianzhima,
were located closely on linkage group LG11.
Discussion
Construction of a high-density genetic map in sesame
In this study, only 44 (5.0%) EST-SSRs and 10 (9.3%)
genomic-SSRs were found polymorphic in the mapping
population and thus were useful for genetic map construction. This rate of polymorphism is much lower than in
many previous reports in sesame [16,32,34], indicating a
narrower genetic dissimilarity between the parents. However, thanks to the high-throughput RAD-Seq technology,
we were able to discover more than 3000 SNPs plus
dozens of InDels from ~40 k comparable RAD-tags.
The rate of SNPs was 7.98% across the genome, which
was higher than 5.12% reported by Zhang et al. [29].
The observation that most SNPs belong to the Y(T/C)
(30.43%) and R(G/A) (30.78%) types are consistent with
Wu et al. BMC Plant Biology 2014, 14:274
/>
Page 8 of 14
Table 4 The pairwise correlation coefficients between different traits in three environments
2012WC
2012FY
2013YL
Trait
PH
PH
1
FCH
FCH
0.587**
1
CAL
0.574**
−0.063
CAL
CN
CL
GN
TGW
1
CN
0.401**
−0.075
0.435**
1
CL
0.236**
0.131*
0.154*
0.039
GN
0.412**
0.320**
0.148*
0.108
0.485**
1
TGW
0.141*
0.147*
0.161**
−0.113*
0.175**
−0.095
PH
1
FCH
0.684**
1
1
1
CAL
0.848**
0.224**
1
CN
−0.214**
−0.455**
−0.01
1
CL
−0.104
−0.025
−0.101
−0.271**
1
GN
0.017
0.024
0.017
−0.340**
0.303**
1
TGW
0.354**
0.307**
0.311**
−0.524**
0.058
0.217**
PH
1
FCH
0.708**
1
CAL
0.749**
0.095
1
1
CN
0.116*
−0.288**
0.407**
1
CL
−0.044
−0.122*
0.042
−0.244**
1
GN
0.205**
0.130*
0.189**
−0.197**
0.401**
1
TGW
0.264**
0.277**
0.109
−0.256**
−0.046
−0.160**
1
*Significant at P ≤0.05, **Significant at P ≤0.01.
the situations previously reported in sesame [29] and
other species including even human [41].
Furthermore, the mapping population in this study
was the first reported and the largest permanent mapping population in sesame. Compared to other published
genetic maps in sesame, the map constructed in this
paper had the highest marker density, the similar number of linkage groups compare to Sesamum indicum L.
chromosomes (2n = 26), fewer distortion markers, fewer
and smaller gaps [15,17,29]. Furthermore, 2,442 (64.8%)
SNP markers and 44 (49.4%) polymorphic PCR markers
that excessively missed or distorted were excluded for
map construction in this study, while more than 65.4%
markers were discarded for their unexpected segregation
patterns that reported by Zhang et al. [29]. There were
also 115 (9.35%) markers that showed significant segregation distortion (P <0.05) were mapped onto our map,
while 205 (16.63%) [29] and 79 (10.91%) [17] on other
two genetic maps in sesame. Four SDRs were detected
on 4 LGs of our map, while 18 SDRs on 11 LGs of SLAF
map [29]. Most of them distributed near the end of LGs,
and may be involved in gametic, zygotic or other selections [42,43]. The map size reported here is 844.46 cM,
which is significantly shorter than previously published
maps of 1,216 and 1,474 cM. This might be due to the
discarded linkage groups with less than 20 markers and
the fewer segregation distortion markers and SDRs in
our map. More importantly, several PCR markers on our
map will be very useful information for the comparison
of maps, genes or QTLs reported in sesame. Therefore,
the high-density genetic map constructed in this study
combined the advantages of two older maps in sesame,
and will be an ideal map for QTL/gene mapping, comparative genomics analysis, map-based cloning and so
on. However, it should be pointed out that the utility as
a general tool for the research community has limitations
for the genetic map presented is mainly based on SNP
between only two sesame varieties and the SNP flanking
sequence is only 85 bp.
Identification of grain yield-related QTLs using
high-density genetic map in sesame
As grain yield is a complex quantitative trait controlled
by multiple genes and sensitive to environments, it is
imperative to phenotype yield-related traits repeatedly
for reliable QTL mapping. Here the availability of a permanent segregating population (the RIL) makes it feasible
for repeated phenotyping both over time and location.
Since significantly (P = 0.01) correlations were found
for each trait among different environments, the field
Wu et al. BMC Plant Biology 2014, 14:274
/>
Page 9 of 14
Table 5 QTLs of yield-related traits detected by MIM from the analysis of the RILs in five trials
Traits
Trials
QTL
LG
LOD
thresholda
Marker
Interval
QTL
region (cM)
QTL peak
position
LOD
R2 (%)b
Additive
effectc
Plant height
2013YL
Qph-6
LG6
3.1
SBN1813-SBN3112
26.7-33.1
32.5
3.31
6.0
4.0183
2012WC
Qph-12
LG12
3.0
ZM1466-SBN1229
21.9-23.0
22.3
3.10
5.6
3.5444
2013YL
Qph-12
LG12
3.2
ZM1466-SBN1229
12.1-23.3
19.0
3.92
9.1
4.9657
2013YL
Qfch-4
LG4
3.2
SBN693-SBI050
60.0-66.7
60.1
3.50
6.2
2.3771
2012WC
Qfch-11
LG11
3.1
SBN1609-SBN3137
6.7-16.9
13.3
4.20
8.2
2.5115
2013YL
Qfch-12
LG12
3.2
ZM1466-SBI005
6.0-23.7
19.0
5.39
11.5
3.2616
2012FY
Qcal-5
LG5
3.0
SBN1595-SBM1111
43.0-48.0
43.9
4.40
8.1
4.2033
2013YL
Qcal-9
LG9
3.1
SBN3559-SBN2018
2.4-4.7
3.4
3.86
9.2
3.5580
Capsule number
per plant
2013YL
Qcn-11
LG11
3.0
SBN1622-SBN3137
14.3-16.9
16.3
3.29
7.0
−4.7757
Thousand grain
weight
2012WC
Qtgw-11
LG11
3.2
SBN1798-SBN1765
17.9-19.2
18.2
4.13
7.7
0.0618
2013YL
Qtgw-11
LG11
3.2
SBN1798-SBN1765
18.2-20.2
19.2
3.68
9.2
0.0672
2013WC
Qtgw-11
LG11
3.0
SBN1798-SBN1765
17.9-21.2
19.2
5.14
12.3
0.0695
2013WC
Qgn-1
LG1
3.1
SBN2389-SBN297
36.8-48.2
46.1
3.90
6.8
1.4556
2013FY
Qgn-1
LG1
3.2
SBN1076-SBN1844
30.4-46.4
39.6
6.30
11.0
2.4169
2012WC
Qgn-6
LG6
3.0
SBN1261-SBI043
78.9-99.0
92.3
4.40
8.0
2.2658
2012FY
Qgn-6
LG6
3.1
SBN1261-SBI043
83.2-99.0
92.9
6.9
11.4
2.3877
2013YL
Qgn-6
LG6
3.1
SBN1261-SBI043
74.4-99.0
89.5
8.3
18.3
2.9494
2013WC
Qgn-12
LG12
3.1
SBI005-SBN3344
22.3-26.7
26.0
5.0
7.9
−1.5765
First capsule
height
Capsule axis
length
Grain number
per capsule
Capsule length
2013FY
Qgn-12
LG12
3.2
SBI005-SBN3344
22.3-26.7
25.3
8.3
13.6
−2.7619
2012WC
Qcl-12
LG12
5.0
ZM1466-SBI005
3.0-22.3
18.0
29.55
52.2
−0.3805
2012FY
Qcl-12
LG12
5.0
ZM1466-SBI005
3.0-22.3
17.0
42.80
70.3
−0.5104
2013YL
Qcl-12
LG12
5.0
ZM1466-SBI005
3.0-22.3
17.0
50.56
72.0
−0.4851
2013WC
Qcl-12
LG12
5.0
ZM1466-SBI005
3.0-22.3
17.0
54.92
74.0
−0.3964
2013FY
Qcl-12
LG12
5.0
ZM1466-SBI005
3.0-22.0
17.0
56.20
75.6
−0.4955
a
LOD thresholds determined by 1,000 permutation; bProportion of phenotypic variation explained by individual QTL; cPositive and negative values indicated
additive effect by the alleles of Zhongzhi 14 and Miaoqianzhima, respectively.
experiments must have provided reliable phenotypic
data for QTL mapping. However, trial-wide correlation
coefficients below 0.351 for CAL or below 0.509 for CN
indicated a weak or moderate correlation, respectively.
And three QTLs for CAL and CN were identified in only
one environment, although be detected using both MIM
and MCIM.
Finally, thirteen yield-related QTLs on 7 LGs and 17
QTLs on 10 LGs had been detected using MIM and
MCIM method, respectively. These were the first reported grain yield-related QTLs in sesame, and all of
them were detectable in more than one trial or by two
algorithms. The genetic control of seven yield-related
traits was mostly comprised of few major QTLs plus several minor QTLs. Three major QTLs had been detected
using MIM with R2 > 10.0% or MCIM with h2a > 5.0%. Ten
minor QTLs had been identified for seven yield-related
traits using both MIM and MCIM. On the other hand, we
found a QTL (Qgn-6) showed significant ae effect, and
one pair of QTLs for FCH with significant aa effect.
Several ae or aa effect of yield-related QTLs also had
been reported in wheat [44], soybean [45], oilseed rape
[46], and so on. These QTLs with a, ae or aa effect will
be very important common and special information for
yield improvement in sesame.
Furthermore, significantly correlations were found
among some of the yield-related traits, which are indicative of closely linked or pleiotropic genetic factors controlling these traits. This was then verified by co-localization
of several QTLs for these traits. The co-localization of
Qph-12 and Qfch-12, all from the Zhongzhi 14 alleles,
were in line with the significant positive correlation between PH and FCH. The positive correlation was found
between FCH and TGW, but negative correlation between
Wu et al. BMC Plant Biology 2014, 14:274
/>
CN and TGW or CN and FCH. Correspondingly, Qfch-11
and Qtgw-11 with positive additive effect from Zhongzhi
14 alleles, and Qcn-11 with negative additive effect from
Miaoqianzhima alleles, were closely located on LG11.
Nevertheless, not all correlations can be explained by
QTL co-localization, such as CL and GN, PH and CN.
These contradictions could be due to the effect of
undetected QTLs or reasons other than pleiotropy or
linkage.
Future perspectives and challenges in sesame breeding
Improvement of yield is one of the most important
targets for sesame breeding; however, it is a timeconsuming and tedious project because multiple complex
and environment-sensitive components are involved in
this process. The identification of yield-related QTLs in
this study has laid a preliminary foundation for marker
assisted selection (MAS) toward the yield traits in sesame.
Even though, for some minor QTLs with low LOD scores,
further validation is necessary before utilizing them in
breeding. On the other hand, the epistatic interaction and
the co-location of yield-related QTLs may be beneficial or
problematic for pyramiding of desired loci, depending on
their patterns. The positive aa effects of Qfch-4 and Qfch12 indicate that the integration of both QTLs will be
beneficial to the improvement of FCH in this study. The
closely located Qtgw-11 and Qcn-11 showed significant
additive effect on TGW and CN, but the favorable alleles
are carried by different parent lines. Thus, there are still a
lot of efforts to make to precisely dissect the linked or
epistatic QTLs, or screen for germplasm with independent
favorable allelic variations, to facilitate breeding.
In this study, we found that most QTLs showing positive additive effects are from the alleles of Zhongzhi 14, an
excellent commercial cultivar with several high-yield characters. However, two identified QTLs for GN and CN
contributed by Miaoqianzhima. It means that introduction
of these two QTLs using the alleles of Miaoqianzhima will
further improve the GN and CN of Zhongzhi 14. Furthermore, we have found ‘the superior line’ predicted using
QTLNetwork 2.0 with significantly increased genotype
effect for GN value than two parents [47] (data not
showed). So there will be very great breeding potential
for the improvement of grain number per capsule with
this RIL population. This genotyped RIL population
combined with high-density genetic map will also serve
as an effective study system for characterizing serious of
important agricultural traits, such as yield, oil or protein
content in grain, stress tolerance, and so on.
Conclusions
This report presents by far the first QTL mapping work
of yield-related traits in sesame using a RIL population,
in addition to the construction of a high density genetic
Page 10 of 14
map. We developed 3,769 SNPs markers by RAD tag
sequencing, and constructed a so far most high-density
genetic map of 14 LGs in combination with SSR and
InDel markers. Using this RIL population and genetic
map, several grain yield-related QTLs had been detected
in more than one trials or by both MIM and MCIM
method, including three major effect QTLs with R2 >
10.0% or h2a > 5.0%. Three QTLs with significant ae or
aa effect had also been identified using MCIM algorithm. Several co-localized QTLs were identified that
partially explained the correlations among seven yieldrelated traits. The high-density genetic map and yieldrelated QTLs in the current study solidified the basis for
studying important agricultural traits, map-based cloning of grain yield-related genes and implementing MAS
toward genetic improvement in sesame.
Methods
Plant materials and field trials
The mapping population used in this study consists of
224 F8:9 recombinant inbred lines derived from singleseed descent from a cross between ‘Miaoqianzhima’ and
‘Zhongzhi 14’, both are white seed-coated. The male parent ‘Zhongzhi 14’ is a commercial cultivar grown widely
in China while the female parent ‘Miaoqianzhima’ is a
landrace accession originating from Anhui province in
China. The two varieties are distinct in many morphological traits, including plant height, growth habit, capsule shape, leaf shape and color, as well as resistances to
multiple diseases.
Five field trials were set in five environments during
the year 2012 to 2013 at normal planting season (from
June to September), two in Wuchang (2012WC, 2013WC),
two in Fuyang (2012FY, 2013FY), and one in Yangluo
(2013YL). Wuchang (30°52’N, 114°32’E) and Yangluo
(30°73’N, 114°62’E), which are ~38.6 km apart, both are
located in the summer-sown sesame zone of the middle
Yangtze Valley, while Fuyang (32°93’N, 115°81’E) in the
summer-sown sesame zone of the Huang Huai basin.
The aforementioned two zones take up more than 50%
of China’s sesame-grown area. All trials were in a randomized complete blocks design, with three replicates
each environment. Each plot had two 2.0-m rows spaced
0.4 m apart. At the two-euphylla stage, the plants were
thinned and only thirteen evenly distributed plants in
each row were retained for further analyses.
Traits evaluation
In each plot or genotype, only six uniform plants were
used for trait evaluation. Plants at the two ends of each
row were not selected to avoid edge effects. Traits evaluated include plant height (PH, cm), first capsule height
(FCH, cm), capsule axis length (CAL, cm), capsule number
per plant (CN), capsule length (CL, mm), grain number
Wu et al. BMC Plant Biology 2014, 14:274
/>
Page 11 of 14
per capsule (GN) and thousand grain weight (TGW, g).
CAL was measured as the length of axis from the lowest
capsule to the top one. CL and GN were measured as the
mean values of 18 uniform capsules from six plants. The
half of TGW was measured as the mean weight of three
independent samples of 500 grains. Other traits were measured as the mean values of 6 plants. All of them were
measured just before the harvest stage.
polymorphisms when each allele was observed at least
three times. InDel markers were developed for PCR analysis by gaps in alignment results with another protocol
[31]. The resultant sequence reads containing SNPs were
compared among RIL plants. Only SNPs that were consistently discovered in parents and the progenies were
retained [50]. The genotypes of SNP or PCR markers of
224 RILs were used for genetic map construction.
Genomic DNA extraction and PCR
Linkage mapping
Genomic DNA was extracted from young leaves using
the DNA extraction kit (TIANGEN Co. Ltd, Beijing).
One thousand two hundred and seventy-four PCR markers,
including 134 genomic-SSRs, 1,061 EST-SSRs and 79 InDels
were used for genetic map construction (Table 1) [31].
Polymerase chain reactions (PCR) for SSRs and InDels
were performed in 10 μl reactions, containing 10 ng
DNA, 2 pmol of each primers, 2 nmol dNTPs, 15 nmol
MgCl2, 0.2 U Taq DNA polymerase (Thermo Fisher Scientific, America) and 1 × PCR buffer supplied together
with the enzyme. The PCR cycles were 94°C 3 min,
36 cycles of 94°C 20 s, 55°C ~ 60°C (depending on the
primers) 30 s, 72°C 40 s, and a 5 min at 72°C for final
extension. PCR products were separated in 8% nondenaturing polyacrylamide gels (Acr:Bis =19:1 or 29:1)
on a constant voltage of 180 V for 2 ~ 3 h, and were visualized by silver staining [48].
The marker segregation ratios were examined using the
chi-square test. The poorly performing markers were removed before map construction, which excessively missed
with more than 40% missing data in the RIL population or
excessively distorted with segregation ratios more than of
the minor allele frequency less than 0.29 [13]. A region
with at least three adjacent loci showing significant segregation distortion (P <0.05) was defined as a segregation
distorted region (SDR) [52]. The genetic linkage map was
constructed using JoinMap 4 (Kyazma, Wageningen,
Netherlands). Linkage groups were determined using a
minimum LOD value of 5.0 and a maximum recombination of 45%. The regression mapping algorithm was
used under the LOD threshold of 3.0 to determine the
orders of markers in each linkage group. The linkage
groups harboring less than 20 markers were discarded.
A ripple was performed after addition of each locus, with
the goodness-of-fit jump threshold for removal loci =5.0
and third round = Yes. The Kosambi mapping function
was used to translate recombination frequencies into
map distances. The final marker order of each linkage
group was verified by the software program RECORD
[53]. The linkage map was graphically visualized with
MapChart 2.2 [54].
RAD sequencing, InDel and SNP markers development
Restriction-site Associated DNA (RAD) approach combined with Illumina DNA sequencing was used for rapid
and effective discovery of InDel and SNP markers. RAD
library construction, sample indexing and pooling followed
Baird et al. [49]. The restriction enzyme EcoR I was used
to cut the DNA of two parents and RIL population [50].
22 multiplexed sequencing libraries were constructed, in
which each DNA sample was assigned a unique nucleotide
MID for barcoding. Single-end (101 bp) sequencing was
performed using Illumina NGS platform HiSeq2000 in a
total throughput of 22 lanes.
Raw sequence reads without MID barcode sequences
were trimmed to 85 nucleotides from the 3’ end to
ensure more than 90% of the nucleotides have a quality
value above Q30 (equals 0.1% sequencing error) and
more than 99% above Q20 (equals 1% sequencing error).
Reads of low quality, including reads with <85 bp after
trimming or with ambiguous barcodes, were discarded.
For InDels and SNPs calling, the trimmed reads were
clustered into RAD-tags based on sequence similarity
using Stacks under default parameters [51]. Clustered
RAD-tags with very high read depth (>500) were excluded
[51]. Sequences of RAD-tags were blasted between
the two parental plants. InDels (≥2 bp) or SNPs were
identified in alignment results, and regarded as true
QTL analysis
The mean phenotypic data of three replicates (blocks) in
different trials (environments) from all 224 lines (genotypes) were analyzed for frequency distributions, standard
errors, pearsons correlation coefficients and ANOVA using
SAS Statistics package [55]. The broad-sense heritability
(H2) was calculated with the formula H2 = σ2g /(σ2g + σ2e /r),
where σ2g represents the genetic variance, σ2e is the residual
variance, and r is the number of replicates per genotype.
QTLs were detected for each of the seven traits using
the MIM method implemented in Windows QTL Cartographer 2.5 [56] and MCIM in QTLNetwork 2.0 [57].
In Windows QTL Cartographer 2.5, a Composite interval mapping (CIM) analysis was run at first using Model
6 for one trait in one trial independently, with the forward
and backward stepwise regression under a step size of
1 cM and a window size of 10 cM. The LOD significance
thresholds (P <0.05) were determined by running 1,000
permutations tests [14]. The MIM was subsequently used
Wu et al. BMC Plant Biology 2014, 14:274
/>
to more precisely locate the QTLs. The QTL peaks
identified in CIM were used as the initial model for the
MIM and progressively refined the model using Bayesian Information Criteria (BIC-M0). QTL effects including their percentage of phenotypic variance (total R2)
were estimated with the final model fitted in MIM, and
the R2 for individual QTL was estimated using CIM.
The boundaries of the confidence interval of the QTLs
were estimated with the positions where the LOD value
drop-off was equal to 1 [58].
QTLNetwork 2.0 was also used to identify QTL epistasis and QTL-environment (QE) interactions of one trait
in several trials with three replicates together, which
employed the genome scan parameters of a 10 cM testing window, 1 cM walk speed and 10 cM filtration window. Two-dimensional (2D) genome scans were carried
out to search for multiple interacting QTLs. A genomewide threshold value of the F-statistic (α = 0.01) for
declaring the presence of a QTL was estimated by 1,000
random permutations. A Monte Carlo Markov Chain
method with Gibbs sample size of 20,000 was used to estimate QTL effects [59]. The sum of individual phenotypic
variance explained by each QTL was calculated as the
total phenotypic variance explained by all QTL for each
trait.
Availability of supporting data
The raw sequence data of the RAD sequencing have
been deposited in the National Center for Biotechnology
Information (NCBI) Sequence Read Archive (SRA) database under the accession number SRA100255.
Additional files
Additional file 1: Table S1. Sequences of SNP markers developed by
RAD sequencing in the current study.
Additional file 2: Table S2. Map position and population genotype of
1,230 mapped markers.
Additional file 3: Table S3. The correlation coefficients of individual
traits among different trials.
Abbreviations
A: Additive effects; aa: Additive-additive epistatic effects; ae: Additiveenvironmental interaction effects; ANOVA: Analysis of variance; CAL:
Capsule axis length; CL: Capsule length; CN: Capsule number per plant;
EST: Expressed sequence tag; FCH: First capsule height; GN: Grain number
per capsule; InDel: Insertion-deletion; LG: Linkage groups; MCIM: Mixed
linear composite interval mapping; MIM: Multiple interval mapping;
NGS: Next-generation sequencing; PH: Plant height; QTL: Quantitative
trait locus; RAD-seq: Restriction-site associated DNA sequencing;
RIL: Recombination inbred line; SDR: Segregation distortion regions;
SNP: Single-nucleotide polymorphism; SSR: Simple sequence repeat;
TGW: Thousand grain weight.
Competing interests
The authors declare that they have no competing interests.
Page 12 of 14
Authors’ contributions
KW and YZZ designed this research; HYL and YZZ constructed this
recombinant inbred line population; MMY performed PCR markers analysis;
YT performed RAD sequencing; HHM, WXW and YZ performed yield-related
traits evaluation; KW performed linkage mapping, data analysis and QTLs
detection, and wrote the manuscript. All authors read and approved the
final manuscript.
Acknowledgments
This study was supported by the National Science Foundation of China
(No. 31201243), National Program on Key Basic Research Project of China
(2011CB109304), Open Project of Key Laboratory of Biology and Genetic
Improvement of Oil Crops, Ministry of Agriculture, P. R. China (201210), the
China Agriculture Research System (CARS-15) and Director Foundation of Oil
Crops Research Institute of CAAS (1610172011007).
Author details
1
Key Laboratory of Biology and Genetic Improvement of Oil Crops, Ministry
of Agriculture, Sesame Genetic Improvement Laboratory, Oil Crops Research
Institute of the Chinese Academy of Agricultural Sciences (OCRI-CAAS),
Wuhan, Hubei 430062, China. 2Shanghai Major Biological Medicine
Technology Co., Ltd., Shanghai 201203, China. 3Fuyang Academy of
Agricultural Sciences, Fuyang, Anhui 236065, China.
Received: 10 June 2014 Accepted: 3 October 2014
References
1. Bedigian D: Evolution of sesame revisited: domestication, diversity and
prospects. Genet Resour Crop Ev 2003, 50(7):779–787.
2. Zhang H, Miao H, Wang L, Qu L, Liu H, Wang Q, Yue M: Genome
sequencing of the important oilseed crop Sesamum indicum L.
Genome Biol 2013, 14(1):401.
3. Anilakumar KR, Pal A, Khanum F, Bawa AS: Nutritional, medicinal and
industrial uses of sesame (Sesamum indicum L.) seeds-an overview.
Agriculturae Conspectus Scientificus (ACS) 2010, 75(4):159–168.
4. Namiki M: The Chemistry and Physiological Functions of Sesame. Food
Rev Int 1995, 11(2):281–329.
5. Moazzami AA, Kamal-Eldin A: Sesame seed is a rich source of dietary
lignans. J Am Oil Chem Soc 2006, 83(8):719–723.
6. Biabani AR, Pakniyat H: Evaluation of seed yield-related characters in
sesame (Sesamum indicum L.) using factor and path analysis. Pak J Biol
Sci 2008, 11(8):1157–1160.
7. Morrell PL, Buckler ES, Ross-Ibarra J: Crop genomics: advances and
applications. Nat Rev Genet 2012, 13(2):85–96.
8. Li Y, Fan C, Xing Y, Jiang Y, Luo L, Sun L, Shao D, Xu C, Li X, Xiao J, He Y,
Zhang Q: Natural variation in GS5 plays an important role in regulating
grain size and yield in rice. Nat Genet 2011, 43(12):1266–1269.
9. Yu H, Xie W, Wang J, Xing Y, Xu C, Li X, Xiao J, Zhang Q: Gains in QTL
detection using an ultra-high density SNP map based on population
sequencing relative to traditional RFLP/SSR markers. PLoS One 2011,
6(3):e17595.
10. Marathi B, Guleria S, Mohapatra T, Parsad R, Mariappan N, Kurungara VK,
Atwal SS, Prabhu KV, Singh NK, Singh AK: QTL analysis of novel genomic
regions associated with yield and yield related traits in new plant type
based recombinant inbred lines of rice (Oryza sativa L.). BMC Plant Biol
2012, 12:137.
11. Gao ZY, Zhao SC, He WM, Guo LB, Peng YL, Wang JJ, Guo XS, Zhang XM,
Rao YC, Zhang C, Dong GJ, Zheng FY, Lu CX, Hu J, Zhou Q, Liu HJ, Wu HY,
Xu J, Ni PX, Zeng DL, Liu DH, Tian P, Gong LH, Ye C, Zhang GH, Wang J,
Tian FK, Xue DW, Liao Y, Zhu L, et al: Dissecting yield-associated loci in
super hybrid rice by resequencing recombinant inbred lines and
improving parental genome sequences. Proc Natl Acad Sci U S A 2013,
110(35):14492–14497.
12. Xu P, Wu X, Wang B, Hu T, Lu Z, Liu Y, Qin D, Wang S, Li G: QTL mapping
and epistatic interaction analysis in asparagus bean for several
characterized and novel horticulturally important traits. BMC Genet 2013,
14:4.
13. Pfender WF, Saha MC, Johnson EA, Slabaugh MB: Mapping with RAD
(restriction-site associated DNA) markers to rapidly identify QTL for stem
rust resistance in Lolium perenne. Theor Appl Genet 2011, 122(8):1467–1480.
Wu et al. BMC Plant Biology 2014, 14:274
/>
14. Chutimanitsakun Y, Nipper RW, Cuesta-Marcos A, Cistue L, Corey A,
Filichkina T, Johnson EA, Hayes PM: Construction and application for
QTL analysis of a Restriction Site Associated DNA (RAD) linkage map in
barley. BMC Genomics 2011, 12:4.
15. Wei LB, Zhang HY, Zheng YZ, Miao HM, Zhang TZ, Guo WZ: A Genetic
Linkage Map Construction for Sesame (Sesamum indicum L.). Genes
Genom 2009, 31(2):199–208.
16. Zhang HY, Wei LB, Miao HM, Zhang TD, Wang CY: Development and
validation of genic-SSR markers in sesame by RNA-seq. BMC Genomics
2012, 13:316.
17. Zhang H, Miao H, Wei L, Li C, Zhao R, Wang C: Genetic analysis and QTL
mapping of seed coat color in sesame (Sesamum indicum L.). PLoS One
2013, 8(5):e63898.
18. Davey JW, Hohenlohe PA, Etter PD, Boone JQ, Catchen JM, Blaxter ML:
Genome-wide genetic marker discovery and genotyping using
next-generation sequencing. Nat Rev Genet 2011, 12(7):499–510.
19. Hyten DL, Cannon SB, Song Q, Weeks N, Fickus EW, Shoemaker RC, Specht
JE, Farmer AD, May GD, Cregan PB: High-throughput SNP discovery
through deep resequencing of a reduced representation library to
anchor and orient scaffolds in the soybean whole genome sequence.
BMC Genomics 2010, 11:38.
20. Chen S, Huang Z, Dai Y, Qin S, Gao Y, Zhang L, Chen J: The development
of 7E chromosome-specific molecular markers for Thinopyrum elongatum
based on SLAF-seq technology. PLoS One 2013, 8(6):e65122.
21. Sun X, Liu D, Zhang X, Li W, Liu H, Hong W, Jiang C, Guan N, Ma C, Zeng H,
Xu C, Song J, Huang L, Wang C, Shi J, Wang R, Zheng X, Lu C, Wang X,
Zheng H: SLAF-seq: an efficient method of large-scale de novo SNP
discovery and genotyping using high-throughput sequencing. PLoS One
2013, 8(3):e58700.
22. Wang XQ, Zhao L, Eaton DA, Li DZ, Guo ZH: Identification of SNP markers
for inferring phylogeny in temperate bamboos (Poaceae: Bambusoideae)
using RAD sequencing. Mol Ecol Resour 2013, 13(5):938–945.
23. Barchi L, Lanteri S, Portis E, Acquadro A, Vale G, Toppino L, Rotino GL:
Identification of SNP and SSR markers in eggplant using RAD tag
sequencing. BMC Genomics 2011, 12:304.
24. Miller MR, Dunham JP, Amores A, Cresko WA, Johnson EA: Rapid and
cost-effective polymorphism identification and genotyping using
restriction site associated DNA (RAD) markers. Genome Res 2007,
17(2):240–248.
25. Hegarty M, Yadav R, Lee M, Armstead I, Sanderson R, Scollan N, Powell W,
Skot L: Genotyping by RAD sequencing enables mapping of fatty acid
composition traits in perennial ryegrass (Lolium perenne L.). Plant
Biotechnol J 2013, 11(5):572–581.
26. Pegadaraju V, Nipper R, Hulke B, Qi L, Schultz Q: De novo sequencing of
sunflower genome for SNP discovery using RAD (Restriction site
Associated DNA) approach. BMC Genomics 2013, 14(1):556.
27. Wang N, Fang L, Xin H, Wang L, Li S: Construction of a high-density
genetic map for grape using next generation restriction-site associated
DNA sequencing. BMC Plant Biol 2012, 12:148.
28. Barchi L, Lanteri S, Portis E, Vale G, Volante A, Pulcini L, Ciriaci T, Acciarri N,
Barbierato V, Toppino L, Rotino GL: A RAD tag derived marker based
eggplant linkage map and the location of QTLs determining
anthocyanin pigmentation. PLoS One 2012, 7(8):e43740.
29. Zhang Y, Wang L, Xin H, Li D, Ma C, Ding X, Hong W, Zhang X:
Construction of a high-density genetic map for sesame based on large
scale marker development by specific length amplified fragment (SLAF)
sequencing. BMC Plant Biol 2013, 13(1):141.
30. Hua JP, Xing YZ, Xu CG, Sun XL, Yu SB, Zhang QF: Genetic dissection of an
elite rice hybrid revealed that heterozygotes are not always
advantageous for performance. Genetics 2002, 162(4):1885–1895.
31. Wu K, Yang M, Liu H, Tao Y, Mei J, Zhao Y: Genetic analysis and molecular
characterization of Chinese sesame (Sesamum indicum L.) cultivars using
Insertion-Deletion (InDel) and Simple Sequence Repeat (SSR) markers.
BMC Genet 2014, 15(1):35.
32. Dixit A, Jin MH, Chung JW, Yu JW, Chung HK, Ma KH, Park YJ, Cho EG:
Development of polymorphic microsatellite markers in sesame
(Sesamum indicum L.). Mol Ecol Notes 2005, 5(4):736–738.
33. Cho YI, Park JH, Lee CW, Ra WH, Chung JW, Lee JR, Ma KH, Lee SY, Lee KS,
Lee MC, Park YJ: Evaluation of the genetic diversity and population
structure of sesame (Sesamum indicum L.) using microsatellite markers.
Genes Genom 2011, 33(2):187–195.
Page 13 of 14
34. Spandana B, Reddy VP, Prasanna GJ, Anuradha G, Sivaramakrishnan S:
Development and characterization of microsatellite markers (SSR) in
Sesamum (Sesamum indicum L.) species. Appl Biochem Biotechnol 2012,
168(6):1594–1607.
35. Yue WD, Wei LB, Zhang TD, Li C, Miao HM, Zhang HY: Analysis of genetic
diversity and population structure of germplasm resources in sesame
(Sesamum indicum L.) by SSR markers. Acta Agronomica Sinica (Chinese)
2012, 38(12):2286–2296.
36. Wei W, Qi X, Wang L, Zhang Y, Hua W, Li D, Lv H, Zhang X:
Characterization of the sesame (Sesamum indicum L.) global
transcriptome using Illumina paired-end sequencing and development
of EST-SSR markers. BMC Genomics 2011, 12:451.
37. Wang L, Zhang Y, Qi X, Gao Y, Zhang X: Development and
characterization of 59 polymorphic cDNA-SSR markers for the edible oil
crop Sesamum indicum (Pedaliaceae). Am J Bot 2012, 99(10):e394–e398.
38. Yepuri V, Surapaneni M, Kola V, Vemireddy LR, Jyothi B, Dineshkumar V,
Anuradha G, Siddiq EA: Assessment of genetic diversity in sesame
(Sesamum indicum L.) genotypes, using EST-derived SSR markers.
J Crop Sci Biotechnol 2013, 16(2):93–103.
39. Xue S, Zhang Z, Lin F, Kong Z, Cao Y, Li C, Yi H, Mei M, Zhu H, Wu J, Xu H,
Zhao D, Tian D, Zhang C, Ma Z: A high-density intervarietal map of the
wheat genome enriched with markers derived from expressed sequence
tags. Theor Appl Genet 2008, 117(2):181–189.
40. Xu P, Wu X, Wang B, Liu Y, Ehlers JD, Close TJ, Roberts PA, Diop NN, Qin D,
Hu T, Lu Z, Li G: A SNP and SSR based genetic map of asparagus bean
(Vigna. unguiculata ssp. sesquipedialis) and comparison with the broader
species. PLoS One 2011, 6(1):e15952.
41. Brookes AJ: The essence of SNPs. Gene 1999, 234(2):177–186.
42. Lu H, Romero-Severson J, Bernardo R: Chromosomal regions
associated with segregation distortion in maize. Theor Appl Genet 2002,
105(4):622–628.
43. Faris JD, Laddomada B, Gill BS: Molecular mapping of segregation
distortion loci in Aegilops tauschii. Genetics 1998, 149(1):319–327.
44. Jia H, Wan H, Yang S, Zhang Z, Kong Z, Xue S, Zhang L, Ma Z: Genetic
dissection of yield-related traits in a recombinant inbred line population
created using a key breeding parent in China’s wheat breeding.
Theor Appl Genet 2013, 126(8):2123–2139.
45. Palomeque L, Li-Jun L, Li W, Hedges B, Cober ER, Rajcan I: QTL in megaenvironments: I. Universal and specific seed yield QTL detected in a
population derived from a cross of high-yielding adapted x highyielding exotic soybean lines. Theor Appl Genet 2009, 119(3):417–427.
46. Basunanda P, Radoev M, Ecke W, Friedt W, Becker HC, Snowdon RJ:
Comparative mapping of quantitative trait loci involved in heterosis for
seedling and yield traits in oilseed rape (Brassica napus L.). Theor Appl
Genet 2010, 120(2):271–281.
47. Yang J, Zhu J, Williams RW: Mapping the genetic architecture of complex
traits in experimental populations. Bioinformatics 2007, 23(12):1527–1536.
48. Liang HW, Wang CZ, Li Z, Luo XZ, Zou GW: Improvement of the silverstained technique of polyacrylamide gel electrophoresis. Yi Chuan 2008,
30(10):1379–1382.
49. Baird NA, Etter PD, Atwood TS, Currey MC, Shiver AL, Lewis ZA, Selker EU,
Cresko WA, Johnson EA: Rapid SNP discovery and genetic mapping using
sequenced RAD markers. PLoS One 2008, 3(10):e3376.
50. Xu P, Xu S, Wu X, Tao Y, Wang B, Wang S, Qin D, Lu Z, Li G: Population
genomic analyses from low-coverage RAD-Seq data: a case study on the
non-model cucurbit bottle gourd. Plant J 2014, 77(3):430–442.
51. Catchen JM, Amores A, Hohenlohe P, Cresko W, Postlethwait JH: Stacks:
building and genotyping Loci de novo from short-read sequences.
G3 (Bethesda) 2011, 1(3):171–182.
52. Paillard S, Schnurbusch T, Winzeler M, Messmer M, Sourdille P, Abderhalden
O, Keller B, Schachermayr G: An integrative genetic linkage map of winter
wheat (Triticum aestivum L.). Theor Appl Genet 2003, 107(7):1235–1242.
53. Van Os H, Stam P, Visser RG, Van Eck HJ: RECORD: a novel method for
ordering loci on a genetic linkage map. Theor Appl Genet 2005, 112(1):30–40.
54. Voorrips RE: MapChart: software for the graphical presentation of linkage
maps and QTLs. J Hered 2002, 93(1):77–78.
55. Schlotzhauer SD, Littell RC: SAS System for Elementary Statistical Analysis.
Cary, North Carolina: SAS institute; 1997.
56. Wang S, Basten J, Zeng Z: Windows QTL Cartographer 2.5. Raleigh, NC:
Department of Statistics, North Carolina State University; 2010.
/>
Wu et al. BMC Plant Biology 2014, 14:274
/>
Page 14 of 14
57. Yang J, Zhu J: Methods for predicting superior genotypes under
multiple environments based on QTL effects. Theor Appl Genet 2005,
110(7):1268–1274.
58. Lander ES, Botstein D: Mapping mendelian factors underlying quantitative
traits using RFLP linkage maps. Genetics 1989, 121(1):185–199.
59. Jiang C, Zeng ZB: Mapping quantitative trait loci with dominant and
missing markers in various crosses from two inbred lines. Genetica 1997,
101(1):47–58.
doi:10.1186/s12870-014-0274-7
Cite this article as: Wu et al.: High-density genetic map construction and
QTLs analysis of grain yield-related traits in Sesame (Sesamum indicum L.)
based on RAD-Seq techonology. BMC Plant Biology 2014 14:274.
Submit your next manuscript to BioMed Central
and take full advantage of:
• Convenient online submission
• Thorough peer review
• No space constraints or color figure charges
• Immediate publication on acceptance
• Inclusion in PubMed, CAS, Scopus and Google Scholar
• Research which is freely available for redistribution
Submit your manuscript at
www.biomedcentral.com/submit