The chickpea genomic web resource: visualization and analysis of the desi-type Cicer arietinum nuclear genome for comparative exploration of legumes
Bạn đang xem bản rút gọn của tài liệu. Xem và tải ngay bản đầy đủ của tài liệu tại đây (3.53 MB, 14 trang )
Misra et al. BMC Plant Biology (2014) 14:315
DOI 10.1186/s12870-014-0315-2
SOFTWARE
Open Access
The chickpea genomic web resource: visualization
and analysis of the desi-type Cicer arietinum nuclear
genome for comparative exploration of legumes
Gopal Misra, Piyush Priya, Nitesh Bandhiwal, Neha Bareja, Mukesh Jain, Sabhyata Bhatia, Debasis Chattopadhyay,
Akhilesh K Tyagi and Gitanjali Yadav*
Abstract
Background: Availability of the draft nuclear genome sequences of small-seeded desi-type legume crop Cicer
arietinum has provided an opportunity for investigating unique chickpea genomic features and evaluation of
their biological significance. The increasing number of legume genome sequences also presents a challenge for
developing reliable and information-driven bioinformatics applications suitable for comparative exploration of this
important class of crop plants.
Results: The Chickpea Genomic Web Resource (CGWR) is an implementation of a suite of web-based applications
dedicated to chickpea genome visualization and comparative analysis, based on next generation sequencing and
assembly of Cicer arietinum desi-type genotype ICC4958. CGWR has been designed and configured for mapping,
scanning and browsing the significant chickpea genomic features in view of the important existing and potential
roles played by the various legume genome projects in mutant mapping and cloning. It also enables comparative
informatics of ICC4958 DNA sequence analysis with other wild and cultivated genotypes of chickpea, various other
leguminous species as well as several non-leguminous model plants, to enable investigations into evolutionary
processes that shape legume genomes.
Conclusions: CGWR is an online database offering a comprehensive visual and functional genomic analysis of the
chickpea genome, along with customized maps and gene-clustering options. It is also the only plant based web
resource supporting display and analysis of nucleosome positioning patterns in the genome. The usefulness of
CGWR has been demonstrated with discoveries of biological significance made using this server. The CGWR is
compatible with all available operating systems and browsers, and is available freely under the open source
license at />Keywords: Cicer arietinum ICC4958, Clustering, Comparative genomics, Genome browser, Mapping
Background
The draft genome sequence of the economically important
pulse crop Cicer arietinum L. (chickpea; desi genotype)
was recently completed via whole genome deep sequencing
[1]. This initiative was undertaken by our group for the
small-seeded chickpea genotype ICC4958 in view of
the worldwide importance of legumes, drought-tolerant
property of the genetic stock, and to facilitate genetic
enhancement and breeding for development of improved
* Correspondence:
National Institute of Plant Genome Research (NIPGR), Aruna Asaf Ali Marg,
New Delhi 110067, India
chickpea varieties. The availability of the genome sequence
of ICC4958 and the large-seeded kabuli-type chickpea [2]
has led to enrichment of the existing volume of accessible
legume sequence data that includes three other legume
food crops, soybean (Glycine Max) [3], pigeonpea
(Cajanus cajan) [4] and the common bean (Phaseolus
vulgaris) [5], as well as two non-food legume plants,
namely, the barrel medic (Medicago truncatula) [6] and
birds foot trefoil (Lotus japonicus) [7]. Such a wealth of
data enables a variety of comparative analyses and offers
the legume research community an opportunity to
develop tools for novel biological interpretations, paving
© 2014 Misra et al.; licensee BioMed Central. This is an Open Access article distributed under the terms of the Creative
Commons Attribution License ( which permits unrestricted use, distribution, and
reproduction in any medium, provided the original work is properly credited. The Creative Commons Public Domain
Dedication waiver ( applies to the data made available in this article,
unless otherwise stated.
Misra et al. BMC Plant Biology (2014) 14:315
the way for initiating new lines of research in legume
genomics.
Despite a recent upsurge in chickpea genome research
and despite the availability of draft sequences for two
distinct chickpea genomes, there is a limitation of software
available in the public domain for comparative exploration
of these genomes, resulting in the absence of a comprehensive interface for genome analysis of any Cicer species, or
for multi-genome data handling with respect to chickpea.
To overcome this limitation, we have developed an interactive web server with feature-rich capabilities for detailed
analysis and visualization of the chickpea nuclear genome,
and it also supports detailed comparative genomics of
ICC4958 with other chickpea genotypes (ICCV2, JG62 and
PI489777, kabuli-type chickpea), legumes (pigeonpea,
soybean, common bean, Lotus and Medicago) and
non-legumes (Arabidopsis and grape). This web server
has been named the ‘Chickpea Genomic Web Resource’
or CGWR and it is available freely without any login requirement at The
CGWR includes a browser based on the Generic Genome
Browser (GBrowse) [8] and multiple tools or interfaces for
querying, analyzing, and downloading the available data.
GBrowse is a web-server application implemented in Perl,
highly suitable as a stand-alone genome browser, and is
currently being used for more than 100 organismal
genomes worldwide [8].
This report provides a primer on the basic elements of
the CGWR graphical user interface (GUI). For each
menu, we provide a pipeline for routine tasks that can
be performed using the CGWR with specific examples
offering an insight into problems of biological interest
that can be addressed through this resource, and finally
we discuss our plans for the next CGWR release.
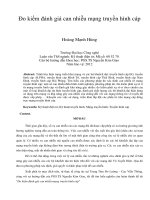
Figure 1 provides an overall summary of the CGWR and
its components. We believe that the CGWR will encourage
researchers to perform legume-based informatics analyses
as it is intended towards ease-of-use and interactive
graphical display of many kinds of genomic information.
Implementation
The CGWR has been split into three major sections.
The first of these is the ‘Tools’ section, that enables rapid
scanning of SSR repeats and extraction of desired CDS
or gene as well as pair wise alignments, which aid in the
identification of orthologous regions between species.
This menu supports text and sequence based search
providing quick and precise access to any desired gene
or protein of chickpea. The second section is ‘Maps’,
motivated by the need to have interesting single view
snapshots of the chickpea genome map – the
chromosomal location(s) of a desired gene model or
gene family can be displayed by this tool in a clickable
genes-based interactive image that is available for download
Page 2 of 14
as well. The ‘Browser’ within CGWR is a fast loading online
tool for genome exploration and interpretation that
provides a reliable display of a given region of interest
in the chickpea genome at any scale, and enables data
browsing, filtering and analysis through dozens of
annotation ‘tracks’ in a single window. Apart from
these three main sections, CGWR includes itemized
tutorials for each section and provides important links
to external legume research tools and websites, as
well as the facility to download of all available datasets,
thereby serving as a legume knowledge repository.
Data sources
All data regarding the chickpea nuclear genome sequence,
assembly, annotations, gene models and the reference
sequence itself were generated under the NGCP project, as
described in Jain et al. [1]. Genomic data for comparative
analyses was taken from Phytozome v9.0 (http://www.
phytozome.net/). Transcriptome data was obtained
from NCBI and the CTDB database [9,10]. Gene ontologies
were extracted from the Arabidopsis GO Database [11].
Nuclear genome assemblies for six other legumes were
downloaded from their respective databases, viz. Cicer arietinum kabuli type genotype CDC Frontier (isat.
org/gt-bt/ICGGC/GenomeManuscript.htm), Cajanus cajan
( Glycine max (ftp://ftp.
jgi-psf.org/pub/compgen/phytozome/v9.0/Gmax/assembly/),
Lotus japonicus ( />pseudomolecule), Medicago truncatula (-psf.
org/pub/compgen/phytozome/v9.0/Mtruncatula/assembly/),
and Phaseolus vulgaris ( />phytozome/v9.0/Pvulgaris/ assembly/).
Comparative genomics and variations
For the Tools interface, command-line BLAST databases
were created for C.arietinum ICC4958 draft Genome
sequence, its peptides and CDS sequences. For the
identification of orthologs and inter-species polymorphisms,
BLAST databases were created for the eight plants listed
above, as well as four varieties of chickpea. BLAST version
2.2.27+ [12] was used for this purpose. For every new run,
the output gets converted to HTML and table format using
PHP scripts. Backend perl scripting is used for integration
of BLAST output with the genome browser to directly
enable visualization of genomic region of the sequence of
interest. The SSR search tool enables an overview of the
number of iterations of any desired SSR motif of interest on
the chickpea genome, through backend perl scripts. For
identification of syntenic regions, a cut-off BLASTn score
(<10−10) was applied between chickpea genome and the
above six legume plant genomes. For computation of chains
of syntenic regions, DAGchainer software [13] was used for
which input files were prepared through inhouse processing
scripts written in C++ and perl. Repetitive matches in the
Misra et al. BMC Plant Biology (2014) 14:315
Page 3 of 14
Figure 1 A flowchart depicting overview of the CGWR components.
input files containing nine columns (chrA, accessionA,
startA, endA, ChrB, acessionB, startB, endB and E-value)
were removed in order to reduce data noise, and filtering
was done taking 50 kb window lengths. DAG (Directed
Acyclic Graph) and dynamic programming was used to
compare each pair of genome sequences mentioned above.
Mapping and clustering
Gene mapping and clustering data were generated using
gene-location tables generated through PHP programming.
The maps generated through this tool are interactive and
use specific pseudomolecule based genomic locations
of given gene IDs and arrange them in the order of
occurrence on the eight LGs. An image is created with
eight vertical bars, each representing one pseudomolecule
(or linkage group), and gene models are marked on these
bars as horizontal grey lines. Each horizontal mark in the
map has been made clickable using shell and perl
scripting, so that user can infer further details of the
individual or group of mapped gene ids. For clustering,
whenever two or more of the input IDs are found to lie
within a pre-computed distance cut-off (0.3 Mbp) with
respect to one another, the program assigns them to a
cluster and returns a web link for the user to analyze this
cluster further. Each gene model or cluster mapped to any
of the eight assembled pseudomolecules can be directly
visualized on the chickpea genome browser through a link
that integrates the tools at the CGWR backend, as
explained in the section above. In case, one or more input
gene IDs do not map to any of the eight pseudomolecules
or LGs, they are assigned to an ‘unassembled scaffold’ or a
virtual LG termed as ‘UN’ which can be seen as the last
(ninth) vertical bar on the map image. The program does
not carry out clustering analysis of gene models mapped
Misra et al. BMC Plant Biology (2014) 14:315
to this virtual pseudomolecule since the gene models are
unassembled and their spatial locations are unknown.
Regulatory element identification
Perl scripts were used for GFF file filtering, data
normalization for removal of overlapping gene stretches,
and for extraction of 300 bp upstream sequences for each
annotated gene model. A total of 20,057 such sequences
were obtained from the eight pseudomolecules and 18,826
scaffolds of Cicer arietinum nuclear genome and these
were submitted to transcription factors binding site
(TFBS) or cis-element prediction pipelines. Data on
regulatory regions or cis-elements in the upstream
regulatory regions of annotated chickpea gene models
was obtained by computational prediction methods.
For this, potential TFBSs were identified using PLACE [14]
and JASPAR [15] databases, two programs that use distinct
approaches, namely, literature-based, and position specific
scoring matrix (PSSM) based methods, respectively.
JASPAR contains annotated, matrix-based TFBS profiles
for multicellular eukaryotes, derived from ChIP-seq and
ChIP-chip whole-genome binding experiments. Briefly,
the elements of a PSSM correspond to scores reflecting
the likelihood of observing that particular position of the
candidate TFBS. The parameters used for JASPAR CORE
plantae included selection of eight plant species including
21 different transcription factors, each represented by a
non-redundant profile, with an initial relative profile score
threshold of 85%. The resulting data was refined using a
score value of 7 to match the approximate lowest score
obtained in the predicted TFBSs data file at 95%
threshold. All the 102,597 hits obtained in this manner
were incorporated into the CGWR browser using GFF3,
PHP and Perl. PLACE is essentially a literature based
database, containing curated and non-redundant nucleotide
sequence motifs found in plant cis-acting regulatory DNA
elements, extracted from previously published reports,
articles, and reviews on the regulatory regions of various
plants genes [14]. Mechanized perl modules were then
used to obtain PLACE predictions by entering each of the
20,057 chickpea upstream regulatory region sequences
into ‘PLACE Web Signal Scan’ grouped by signal.
Nucleosome positioning maps
Predictions for nucleosome start sites and occupancy on
the chickpea genome were carried out using a fortran
based R package NuPop. The method uses a duration
hidden Markov model with individual functions that
compute the Viterbi prediction of nucleosome position;
occupancy state and binding affinity score for a given
stretch of DNA [16,17]. Arabidopsis thaliana was found
to be the species with most similar base composition to
chickpea, and thus nucleosome state predictions for
chickpea were made using Arabidopsis model of pre-trained
Page 4 of 14
linker DNA length distribution. Among the parameters
used was the 4th order Markov chain model for both
nucleosome and linker DNA states. This model was
found to be slightly more effective in prediction, although
it required extra compute time (data not shown). Output
of these predictions was converted to tab delimited files
and thereafter to plots for visualization. For a genomics
region to be considered in a likely nucleosome state, the
criteria were delimited as follows: a minimum nucleosome
start-site score (> = 0.45) followed by at least 146 base
pairs, with high scores for nucleosome occupancy
(Average > = 0.8). Regions that did not satisfy this criterion
were treated as linker DNA states. In this manner, raw
NuPop scores were converted to plots using in-house shell
scripts for convenience of visualization. The track is
presented as a plot, wherein regions with linker DNA
states appear on the negative Y-axis while regions
with high likelihood of nucleosome states appear on
the positive Y-axis. Regions of the assembly that contain
consecutive series of N’s are shown with zero score, to
avoid confusion with predicted regions.
Storage, extraction and GUI
All analyses were carried out as described, and results
were converted to GFF format for storage, display and
extraction. Back-end MySQL (version 5.5.29) was used
to store all categories of data that enable sequence
search and gene based mapping. GBrowse was used for
construction and development of the genome browser,
through the Generic Model Organism Database (GMOD)
project, a collection of open source software tools for
creating and managing genome-scale biological data [18].
For chickpea, GBrowse-2.27 was used along with Apache,
standard perl libraries, libgd2 and MySQL on a Red
Hat Linux platform and was configured to show both
qualitative data such as the splicing structure of a gene,
and quantitative data such as microarray expression levels.
To improve responsiveness of the resource, the Apache
configuration file was modified to replace the usual CGI
implementation by the FastCGI protocol, and Perl FCGI
modules were installed. For efficiency, features and
sequences have been stored in a relational database whose
modules and dependencies serve as the basis for data
access in GBrowse. The data creation pipeline uses input
data in two formats for browser operation, namely GFF
and FASTA, both inter-convertible through bioperl
modules. The backend data loading pipelines use MySQL
and a tab-delimited file containing the various genomic
features in GFF format along with bioperl tools for loading
Bio::DB::GFF databases. Overall CGWR configuration
and customization has been performed through FCGI,
Javascript, PHP and HTML scripting. Front-end pages
were generated using HTML scripts. Different in-house
PHP and perl programs were written to create the output.
Misra et al. BMC Plant Biology (2014) 14:315
Mapped images are generated using CPAN modules
GD, ChromosomeMap-0.10 and ImageMagick-6.8.5-6
( In order to make the mapping
module of the CGWR more robust, shell scripts have
been added which can allow multiple users to access
and visualize mapping results simultaneously.
Results
This work is focused on the comparative genomic analysis
of the draft nuclear genome assembly of Cicer arietinum
genotype ICC4958 as published by our group recently [1].
At the top level, the current assembly is organized as
Ca_LG_1 to Ca_LG_8; representing WGS contigs
matched to the eight chickpea linkage groups, while
Ca_LG_0 represents scaffolds that could not be matched
to any of the eight pseudo-molecules. The chickpea
genomic resource can be accessed through the webpage
Figure 1 provides a
flowchart summary of the CGWR and its components. In
the following sections, we describe the main menu items
individually followed by a brief account of the available
tools and genomic tracks in the browser (represented
as colored, collinear blocks with text labels and strand
annotation) along with their salient features.
Page 5 of 14
with the repeat number and frequency. (X here, refers to
any of the four nucleotides A/C/T/G).
BLAST
The Basic Local Alignment Search Tool is a commonly
used alignment program for detecting sequence similarity.
Users can select the specific BLAST program and database
based on the nature of their query which may be DNA,
protein, translated RNA, or translated DNA. Database
options for this tool include the complete set of CDS and
proteins for ICC4958 as well as the nuclear genomic
sequence. Input sequence can be entered as text, in FASTA
format, or multiple sequences can be uploaded as files, if
required. The tool returns alignments in HTML format
and a summary of the output can be downloaded. In
addition to text based summary, this page directly connects
the tools menu to the chickpea browser within CGWR
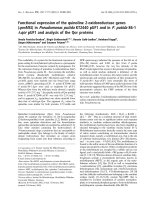
through a ‘browser’ link, as shown in Figure 2, to enable
detailed investigation of the genomic region of interest.
Upon every BLAST search, an additional ‘Alignment Track’
labeled “BLAST” gets added in the Browser for users to see
the exact region of the genome aligned to the query,
without any requirement for manual intervention.
CDS search
CGWR tools
The Tools menu of CGWR comprises a simple user-friendly
GUI that enables rapid scanning and extraction of desired
regions of the genome as well as pairwise alignments
with user specified sequences, for identification of
paralogs and orthologs. Various options are available
to users from this pull down menu, including SSR
Search, BLAST, CDS, Protein and Keyword Search, as
shown in Figure 2.
SSR search
This page enables microsatellite analysis for 64418
simple sequence repeats (SSRs) detected in chickpea
genome through in-silico identification. It contains a
form where users can provide the motif of an SSR of
interest, such as ACA. The tool finds all SSRs in the
chickpea genome that match an input string and split
the data for ease of interpretation resulting in a table
with frequency of occurrence at individual iterations
of the SSR. For example, ACA repeats occur at a total
of 231 locations in chickpea nuclear genome, of which five
iterations of ACA (i.e. ACAACAACAACAACA) occur at
112 positions whereas ten iterations (ACA10) occur at only
three positions, and so on. At the bottom of the results
page, this tool also returns an assessment of all ‘related’
SSR sequences that are one or two nucleotides longer than
the input SSR sequence. For the ACA example, ‘related’
SSRs would include all instances of ACAX, XACA and
XACAX, data for which gets scanned and reported along
Apart from BLAST, the CGWR also enables direct
Coding DNA Sequence (CDS) search for a known
gene model, ID of which can also be identified by a
BLAST search, as described above. The coding region
of a gene is the portion composed of exons, and
codes for protein. For an organism, it represents the
sum total of the genome that is composed of gene
coding regions. All CDSs predicted computationally
for chickpea [1] can be searched by this tool, where
users can paste one or more IDs of interest and obtain the
respective CDSs. Results are directly connected to the
chickpea browser to enable detailed investigation of
the genomic region of interest, as explained above.
Protein search
Similar to the CDS search, the computationally predicted
complement of translated regions for the chickpea genome
(as per ref [1]) can be scanned by ID number. This menu
supports text-based search providing quick and precise
access to any desired protein of chickpea. Results can be
downloaded and directly visualized in the genome browser,
with examples provided within the form.
Keyword search
In case users do not have any prior information such as
the sequence of interest or CIDs, the keyword tool
allows a search of all potential chickpea IDs that contain
a given input string of text in their annotation. For
example, the tool returns six potential matches to the
Misra et al. BMC Plant Biology (2014) 14:315
Page 6 of 14
Figure 2 The CGWR home page containing an outline of its features and capabilities. Insets depict typical outcomes of BLAST and
Mapping and clustering runs showing links to genome browser for visualization of the gene or cluster of interest on the chickpea genome.
term ‘reductoisomerase’, and the list of these six can be
downloaded along with information of each matched ID,
including gene description, locus, PFAM ID and GO
slim term. Further, the CGWR algorithm automatically
generates an interactive map for the searched query, so
that users can directly visualize the spatial patterns of
occurrence of the list of IDs obtained from their search.
CGWR maps
The Maps menu provides interactive chromosomal maps of
gene families, i.e. locations of desired gene models on their
respective pseudomolecules. This tool produces genomic,
sequence-based maps and displays pseudomolecules with
the coordinates being in base pairs. It can also be used to
click on any desired gene or cluster on the map in order to
evaluate and visualize clustering of the mapped gene models
on the chickpea genome. Users can obtain interesting
single view snapshots of the chickpea genome wherein
spatial position(s) of requested gene(s) can be displayed
simultaneously across the eight pseudomolecules. This
menu offers two procedures, one for visualization of
pre-existing maps for selected chickpea gene families,
and the other for customized construction of maps
for desired sets of gene models by the user.
Chickpea gene family maps
Of the 640 unique gene models identified to be associated
with the metabolism of flavonoids in chickpea, those that
could be mapped to the eight distinct pseudomolecules
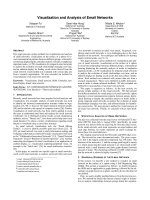
have been depicted in Figure 3A, and the highest number
of flavonoid gene models were found clustered on
pseudomolecule 3. Such a tendency to cluster was not
observed for gene models predicted to be associated with
carotenoid metabolism (data available on CGWR website
under Maps menu). Each gene or cluster can be analyzed
in detail by clicking on the respective bar on the map
image. For example, the top three flavonoid genes on
LG-3 fall into one cluster that can be clicked to see
full details of each member of the cluster, including
gene name, functional annotation, gene ontology, TF
binding sites, and complete sequence. More information
can be noted by clicking the link that connects each gene
Misra et al. BMC Plant Biology (2014) 14:315
Page 7 of 14
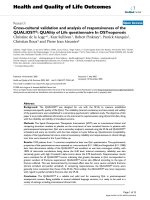
Figure 3 Genome maps of various chickpea gene families. (A) Flavonoids (B) Chickpea-specific gene models (C) DNA Transposons - RC
Helitrons (D) R-genes. In each panel, vertical bars represent the eight distinct chickpea pseudomolecules (LGs), while individual members of
respective gene families are marked in red horizontal lines on each bar, corresponding to genomic locations.
Misra et al. BMC Plant Biology (2014) 14:315
or cluster to the CGWR genome browser. Our analysis
across the entire plant kingdom revealed 9990 legume
specific gene models and 2751 chickpea specific gene
models in the chickpea genome and panel B of Figure 3
shows the mapped subset of the chickpea specific
genes. Further, the putative resistance related gene
models (R-genes) as identified through screening of
the chickpea unigene set were also mapped and these
appear to reside throughout the chickpea genome, although
clustering may occur within the specific conserved classes
that R-genes were assigned during the analysis (Figure 3D).
Almost one third of chickpea genome repeats were
identified to be various kinds of transposable elements, a
majority of which represented retrotransposons and about
5% constituted DNA transposons. Of the latter group,
Figure 3C shows the mapped RC helitrons, i.e. transposons
that are thought to replicate by a rolling circle mechanism,
and it can be seen that they are interspersed all over the
chickpea genome and clustered in a few regions. It is
notable that several types of LINEs and other gene
families also appear to be clustered on the chickpea
genome and it may be interesting to find out whether
the clustering occurs in other legume genomes as well.
This possibility can be queried within the CGWR by using
a combination of the browser and tools menu as described
in the following sections.
Customized maps
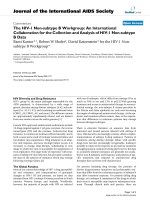
Figure 4 shows a flowchart based outline of the Maps
Tool in the CGWR. The ‘create your own map’ option
allows users to paste the IDs of their desired set of gene
models to visualize spatial location maps similar to the
ones depicted in Figure 3. On the submission form,
users can type the gene ID into the input box, and hit
enter on the keyboard. An example set of gene IDs is
provided within the form itself. Users can also determine
the CIDs of genes of interest through the keyword
search. As shown in Figure 4, the map tool returns a
table listing out the loci, start and end positions of the
specified gene IDs provided as input. At the top of this
table is a link to view Map that leads to the mapped
image. If the gene of interest lies on one of the unassembled
scaffolds, rather than one of the eight pseudomolecules, the
program assigns it to an independent unassembled unit or
virtual LG termed as ‘UN’. An example of such a case is
provided within the CGWR pre-generated maps. These
custom generated maps are interactive, allowing users to
click any region of interest on the map, to visualize details
about the respective region as described in the previous
section. In addition, users can directly find links to the
chickpea browser from any of the input gene models
mapped by this algorithm, as clicking on these links
redirects users to the corresponding regions of the
chickpea genome, as shown in Figure 4. These maps
Page 8 of 14
can also be downloaded as high-resolution images for
publication purposes. Thus, the CGWR provides direct
connection between its various features by connecting
Tools, Maps and the Browser at its backend.
Gene clustering
As shown in Figure 4, whenever two or more mapped
gene models are found to occur within a pre-computed
distance cut-off with reference to each other, they are
considered to be part of a physical genomic cluster. In
such cases, the output of the map will provide an
additional ‘Clustering’ link. With the help of this feature,
users can directly visualize the number of clusters and
composition of each cluster identified in the input set of
gene models. The maps are interactive and each cluster
on the map can be clicked manually for gaining insights
into its members, while users can also view the entire
genomic region containing such gene clusters on the
chickpea genome browser, for further analyses as
shown in Figure 4, such as the presence of common
upstream regulatory elements, or to identify nearby
gene models and their functions.
Chickpea genome browser
The genome browser is one of the primary capabilities
of the CGWR. Currently, the May 2013 assembly is
available; the next freeze of the assembly will be made
accessible as soon as it is released, in the near future.
Figure 5 shows the default browser display i.e. the first
10 kbp data on the first Chickpea pseudomolecule LG1,
although users can select any of the eight LGs from
the pull-down list in the Data Source, and positional
information can also be typed into the landmark or
position box on the top left corner, e.g., Ca_LG_1 for
the whole of chromosome 1 and Ca_LG_2:1..10,000
for the region from position 1 to 10,000 on chromosome
2. The region expanded in the browser will be highlighted
in pale blue in the Overview section as shown in Figure 5.
For the unassembled scaffolds, users can select Ca_LG_0
from the pull down data source list in the Search section,
and type the name and position of the desired scaffold.
Zooming and scrolling controls help to narrow or broaden
the displayed chromosomal range to focus on the
exact region of interest. Default browser display can
be altered as desired by using track controls offered
at the bottom of the browser enabled through the
‘configure tracks’ button, where about fifty different tracks
are available to choose from, as shown in Figure 5.
In order to avoid information overload on account of
such a large number of tracks, GBrowse controls can be
coordinated in such a manner that display for some
browser tracks may be turned off, and others may be
collapsed into a condensed single-line display. Tracks can
thus be hidden or filtered according to user preferences
Misra et al. BMC Plant Biology (2014) 14:315
Page 9 of 14
Figure 4 The Maps Tool of CGWR. This tool can be used for generating customized genome wide interactive maps of genes and gene families
of interest. Six kinds of pre-generated maps are available, along with clustering options. Seamless integration with the chickpea genome browser
as shown in the lower right panel enables further analysis.
using track-based toggles for on/off and hide/show modes,
apart from download, share, density and favorite modes.
There is also a configure mode on each track that allows
users to edit the display characteristics with respect to that
track. Hovering on the colored bar corresponding to
each track display releases an information bubble describing the respective track, and its data source(s),
wherever applicable. Clicking on individual colored
bars or features within a track opens a details page containing a summary of the respective properties of the
track, with additional feature-specific information such
as alignments or links to external information depending on the nature of the track. In the following section,
we provide a list of tracks and examples of typical
cross-track analyses that the CGWR browser can be
used for.
Gene structure prediction
Currently the browser has seven independent tracks for
genes and gene predictions that describe various aspects
of gene structure, including tracks for selecting 5′ and 3’
UTRs, coding region (CDS), exons and introns for genomic
DNA. The mRNA sequence for the predicted protein
sequence is also available, along with GC content and
six-frame translations of the genomic DNA.
Functional annotations
For protein or RNA coding genes, functional annotations
are provided in the ‘Region’ and ‘Details’ sections of the
main browser window. The uppermost ‘Named Gene’
track within Region section allows visualization of
gene models outside the user-selected highlighted area
expanded in all subsequent (lower) tracks. For visualization
of gene annotation within the user-selected highlighted
region, the ‘Annotation’ track can be used. These gene
models are in yellow bars, and mouse hovering will open a
bubble with functional annotation and PFAM domain
information, wherever available. Clicking on each gene
will return a page with detailed locus information, gene
description, protein family classification and gene ontology
Misra et al. BMC Plant Biology (2014) 14:315
Page 10 of 14
Figure 5 Typical display of the chickpea genome browser in the region of the first LG. Four main areas can be seen on the top left side of the
upper panel panel, namely, Search, Overview, Region and Details. The topmost ‘Search’ section identifies the exact genomic range displayed in the
browser (see ‘Landmark’ textbox on top left corner). The area highlighted in sky-blue shades in both of next two sections, namely, ‘Overview’ and ‘Region’,
is expanded in the remaining browser view. Accordingly, the current example (‘Details’ section) represents a 10 kbp stretch within 3 Mbp region of CA
LG 1. The 3 Mbp region has about 11 gene models (see yellow bands in ‘Region’ Section), of which only two lie within the expanded Details section (see
yellow bands in Annotation track). Annotation of the gene models can be seen by clicking the annotation bands in the expanded section, in the form of
a pop-up box, as shown here. In this image, seven genomic tracks have been toggled on, including retrotransposons, nucleosome states, and the
transcriptome. Users can select additional tracks from over forty-eight options in the present CGWR build, as shown in the lower left panel.
Information, as well as the nucleotide sequence of the
respective gene in FASTA format.
Molecular markers
The CGWR has a total of 12 individual tracks for assessment of molecular markers at the genomic level in chickpea. These include simple sequence repeats of two kinds,
namely, in-silico SSRs and sequencing based SSRs, PIP
markers, as well as tandem base substitutions and indels
with reference to three other chickpea varieties. A total of
1,644,016 markers are depicted in these tracks. All SSRs
identified on the genome can be visualized through an
SSR track that enables further data analysis of various
kinds. Hovering over an SSR will specify the number and
type of that repeat, as to the number of SSRs of that
specific kind present in the genome. For example a
given SSR may be the fiftieth tetrameric SSR or the
thousandth dimeric SSR etc. Clicking on the SSR will
return a page detailing locus information, type, length,
number and iteration of the SSR, along with the exact
SSR motif. This track also has the facility to obtain the
DNA from the flanking regions of the feature including
100 up- and down-stream bases to enable primer design
efforts. In addition, the CGWR browser enables further
interactive SSR analysis wherein users can find the number
and type of any desired SSR. This page contains a form
where length and motif of the SSR of interest can be typed
in, and it returns a table providing information about
Misra et al. BMC Plant Biology (2014) 14:315
whether SSRs of the respective kind are present, and if so,
the number of SSRs in the concerned chromosome will be
depicted as well. The SSR search options in the pull-down
‘Tools’ menu on the home bar at the top of the browser
further enables a scan of all kinds of ‘related’ SSRs that
differ by a length of one or two form the input SSR, as
described earlier. Nucleotide diversity has been measured at
the genomic scale by comparing ICC4958 with three other
cultivated and wild chickpea genotypes, namely, desi-type
JG62/ICC4951, kabuli-type ICCV2/IC12968, and wild-type
P1489777. Variations have been analyzed between these
four varieties revealing 32,919 InDels, and 1,504,646 SNPs
and 41,824 tandem base substitutions all of which can be
browsed in the CGWR through nine individual tracks
representing each of these three categories compared pairwise between IC4958 and one of the above-mentioned
genotypes. Each track, when clicked, provides details of
gene structural variation via alignments between IC4958
and the respective variety being compared, along with
additional flanking alignments from upstream and downstream regions, in order to assist in marker based studies
and for acquiring the DNA for additional features and
reverse complementation. The potential intron length
polymorphism marker track (PIP markers) shows the
markers that have been predicted using the PIP database.
Comparative genomics
As highlighted earlier, the most important and voluminous
data in CGWR represents the comparative assessment of
chickpea genome with other leguminous as well as nonleguminous plant species. In all the CGWR comprises 24
individual tracks for comparative genomics, of which, nine
tracks representing nucleotide variation between four
chickpea genotypes have been described above under
molecular marker section. Additionally, there are nine more
conservation tracks for depiction of orthologous gene
models between ICC4958 and six other legumes including
the kabuli genotype chickpea ‘CDC Frontier’, Glycine max,
Medicago truncatula, Phaseolus vulgaris, Cajanus cajan,
and Lotus japonicus, apart from Arabidopsis thaliana and
Vitis vinifera (both non-legumes). These ortholog tracks
show measures of evolutionary conservation and highlight
regions of the genome that may be functionally important
between the pair being considered. Clicking on the track
leads to details of locus position, gene IDs and FASTA
format sequences for both orthologous gene as well as the
chickpea gene under consideration. At the bottom of this
page is a link to the alignment between the orthologs. The
BLAST [12] search engine described earlier in the Tools
menu is also available to meet specific needs of comparison
and alignments. Apart from these 18 tracks, CGWR also
has six tracks for synteny evaluation of genotype ICC4958
with each of the six legume genomes listed above.
We recommend a large window size to enable visualization
Page 11 of 14
of the direction of synteny for a given region, as well as to
explore multiple syntenic matches between two genomes in
a given region. Clicking on the synteny regions pops up a
bubble that provides the start and end site for each
matched locus. Color codes have been maintained for each
plant species across the 24 comparative genomic tracks.
Blue, for example, represents Phaseolus vulgaris while red
represents Cajanus cajan, and so on.
Transcriptome
The browser contains tracks for detailed transcriptome
analysis, with over 27000 ESTs and 274 million filtered
reads representing transcripts of chickpea from independent
tissue/organ based samples. The track for EST returns locus
and strand information along with full nucleotide sequence
of the EST. For each transcript, the track provides
locus information, transcript description, data from gene
ontologies of molecular function, biological process and
cellular location, apart from enabling users to view
expression across each of the six tissue samples studied.
Regulatory regions
Specific binding of transcription factors (TFs) to short and
degenerate oligonucleotides on the genome is key to transcriptional regulation and gene expression. The CGWR
browser contains tracks for predicted TF binding sites
(TFBS) according to both PSSM based computational
scores (JASPAR track) [15], as well as literature based data
correspondence (PLACE tracks) [14]. For each track, the
browser provides information regarding strand, locus, TFBS
sequence motif, family-based classification as well as the
plant species with evidence of a similar binding site. The
family based classification allows one to decipher
what transcription factor might bind to the region of
interest and CGWR further provides details of the
identifier and each family. For example, the site
‘CAACTC’ is known to bind to transcription factor
CAREOSREP1, and is from the family of CAREs
(CAACTC regulatory elements) found in the promoter
region of a cysteine proteinase (REP-1) gene in rice.
Regulatory region analyses can usually result in multiple
TFBS predictions for the same site and therefore
incorporation of two independent tracks for this purpose in CGWR provides the additional advantage of
cross-referencing and evidence from multiple sources.
We recommend a low window size in the range of 5
to 10 kb in order to visualize multiple predictions in
an individual manner.
Transposable elements
Over 40% of the assembled draft genome represents interspersed repeats including various classes of transposable elements and these can be displayed individually. These
tracks are available for DNA transposons, retrotransposons
Misra et al. BMC Plant Biology (2014) 14:315
(LTRs) and other repetitive elements. The track for DNA
transposons can be used to visualize more than 80 different
kinds of DNA transposons as well as RC Helitrons. The
track for retrotransposons enables visualization and
analysis of various families of LINEs, SINEs and
LTRs. Elements that could not be be classified into
either of these two tracks have been assigned to a
third track within transposable elements, namely, the other
repetitive elements track, which consists of unknowns,
simple-repeats, satellites etc. Each transposable element has
been assigned a unique ID based on its genomic position.
Transposable element IDs that occur in multiple copies
with identical scores have been assigned sub-ids such as
N.1, N.2, N.3 and so on, depending upon the number
of occurrences. Clicking on an element will return a
page detailing locus information, type and family-based
classification of that specific transposon or retrotransposon,
along with its entire sequence.
Non-coding RNA predictions
Gene models for non coding RNAs have been predicted
for the chickpea genome, resulting in identification of
about 121 distinct Rfam families including miRNA,
snoRNA, rRNA, tRNA etc. These have been mapped to
the genome and can be visualized via five individual
tracks. Clicking these tracks returns a page containing
features of the respective RNA locus, such as anticodon
and amino acid specification (for tRNA), unique family
classification (for miRNAs and snoRNAs), strand information; complete sequence as well as 2-dimensional
structure notation.
Nucleosome positioning
Predictions for nucleosome states and linker DNA states
for chickpea have been made using Arabidopsis as index
species [16,17], and results have been normalized and
mapped to the chickpea genome as described in
methods. This track provides a plot with information
about nucleosome and linker DNA states. It superimposes
occupancy and binding affinity scores, Viterbi predictions
for optimal nucleosome positioning and the posterior
probability of a genomic position to be the start of a
nucleosome. For convenience of interpretation, regions
of the genome that have a higher tendency toward
nucleosome states are depicted on the positive Y-axis,
while regions with higher tendency towards linker DNA
states are shown on the negative Y-axis. A preliminary
computational correspondence between nucleosome
occupancy likelihood and gene structure reveals that
coding regions of the genome are significantly enriched
for nucleosome states than the regulatory regions, while
the promoters are significantly depleted of nucleosomes.
We also find that introns have much higher density for
nucleosome states than any other genomic region (data
Page 12 of 14
not shown). These and other interesting aspects of the
chickpea nucleosome positioning predictions are currently
being investigated further in our laboratory.
Component integration and other services
In order to facilitate seamless exchange of data between
its various components and capabilities, the CGWR
backend enables dynamic inter-connections and frequent
coupling of results between its three main sections, the
Tools, Maps and the genome Browser. For example, users
can carry out a BLAST run for identification of orthologs
of their sequence of interest, and use links on the output
page for direct access to the genomic regions containing
the orthologs of interest. The list of potential orthologs
can also be obtained by typing in a keyword of interest.
The IDs thus identified can be mapped to the assembled
genome for a high-resolution interactive image via the
Maps menu, where again, direct connection to the browser
is provided. For instance, the gene IDs of the chickpea
orthologs obtained in the BLAST search (under Tools
menu) can be pasted into the Maps menu to visualize
where these domains lie on the chickpea genome, and
whether they show any tendency towards spatial clustering.
Whenever a gene of interest is found to lie within close
proximity of other gene models of the same family, it is
assigned to a cluster that can be visualized on the
interactive map as well as the CGWR browser for
detailed analysis of other aspects of the clustered region.
Apart from these backend provisions, the Links menu of
CGWR provides access to a wide variety of datasets and
links to important external information regarding chickpea
and legume-based genomics research. This menu also
enables downloads of various datasets used in this work.
Example of a typical analysis
A user may have a gene of interest for which they want
to find legume and non-legume homologs. It is possible
to start by using BLAST of the sequence of interest
against the chickpea genome in the Tools menu, and
find the link to the browser on the BLAST output page.
This will lead to the chickpea homologous gene in the
browser display, and from here, similarity with six
legumes and two non–legume plants can be found by
using one of the 15 pre-computed comparative genomics
tracks. Alternatively, nine pre-computed tracks enable
detailed nucleotide level assessment of structural variations
between chickpea and its wild- and desi-type cultivars.
Clicking on these tracks will enable viewing comparative
alignments as well as information about the co-ordinates of
the alignment on both genomes. In case multiple homologs
of the gene of interest are found within chickpea, these can
all be mapped using the Maps menu for interactive and
convenient detection of clusters within the respective gene
family. The clusters, if any, can be further analyzed for
Misra et al. BMC Plant Biology (2014) 14:315
other features of interest in and around the region
via integrative links between maps and the genome
browser. For example, users can toggle the ortholog
tracks for the cluster to find out whether the concerned
set of gene models is clustered in any of nine other plant
genomes as well. Shared transcription factor binding sites,
if any, in the upstream regulatory regions of clustered
gene models can also be visualized through designated
tracks in the browser. With the EST, mRNA and transcript tracks visible, it is possible to see the extent, if any,
of tissue specific or organ specific expression for these
gene models in chickpea. Additionally, turning on some of
the TFBS prediction tracks would suggest whether there is
evidence for any specific TF binding to the promoters of
the identified homologs. Patterns of nucleosome arrays
can also be visualized for assessment of DNA accessibility
in these regions of the genome, and compared for overlap
with other features such as coding and non-coding areas.
Discussion
The construction and development of the Chickpea
Genomic Web Resource was undertaken to enable the
legume community to carry out coherent informaticsbased exploration of the recently sequenced chickpea
nuclear genome, including mapping and visualization of
structural and functional aspects of the underlying DNA
sequence. The CGWR offers a wide-ranging analysis of the
chickpea genome, along with options to carry out comparative cross-species studies of eleven other species or genotypes with respect to chickpea, and is the only plant-based
resource offering customized and interactive chromosomal
location maps for desired gene-models and gene-families.
Furthermore, the browser within CGWR is the only plant
genome browser that offers display and analysis of nucleosome positioning patterns, revealing instances of regularly
spaced arrays of nucleosomes along the coding regions,
along with a tendency for the upstream regulatory regions
to be relatively depleted of nucleosomes. CGWR results
can thus provide opportunities for future research
endeavors on comparative analysis of nucleosome
maps and how their genomic arrangement may control
gene regulation. Another unique feature of the CGWR is
exhaustive information on cis-regulatory element data in
the upstream regions of the chickpea nuclear genome,
based on distinct prediction approaches. Most of the
existing plant genome browsers provide conventional
data on gene models, transcripts, duplication, syntenic
regions and repetitive elements. In numerous cases, even this
information is unavailable. For example, a chickpea genome
browser is presently hosted by the Legume Information
System (LIS) at />gbrowse/Ca1.0/ [19]. It provides access to genome (version
1.0) and transcriptome assemblies (version v2) for the
CDC-Frontier (kabuli-type) chickpea genotype, but there is
Page 13 of 14
no support for intra- or inter- genome analyses. Another
database specific to cool season food legume genomes is
available at [20]. CSFL is
highly informative in terms of legume based QTLs, and
includes browsers and marker search tools for pea, lentil,
chickpea and Medicago, although it has no data on
desi-type chickpea, and its kabuli-type genome
browser has less than ten tracks with no possibility
for comparative genomics with any of the other cool
season food legumes. However, this comparative technical
discussion of both LIS and CFSL does in no way undermine
either resource, as they have a large number of advantages,
including state-of-the-art visualization techniques, highly
advanced QTL search options and regular global updates
on legume related news and workshops, providing substantial benefits for the community. In summary, we believe that
CGWR fills a different niche, rather than create redundancy
by competing with other platforms, and therefore it would
be welcome by the legume community. The innovative
approach implemented in the CGWR would pave the way
for in-depth display and interpretation techniques for
diverse kinds of biologically relevant data, thereby inspiring
multiple future research initiatives. Complete documentation and online tutorials are also available within the
CGWR, for understanding the resource and its capabilities.
Conclusions
The CGWR is a multi-faceted web resource for dynamic
analysis and specialized visual inspection of the most recent
draft assembly of the chickpea nuclear genome. It is freely
available without any login requirement at http://www.
nipgr.res.in/CGWR/home.php. Each new draft assembly of
chickpea will be integrated into the CGWR and made available as it is released. In future versions, we hope to modify
and expand the browser to add new features of interest to
the legume research community, such as incorporation of
biochemical pathways, simultaneous visualization of
multiple gene family maps in distinct colors and tracks for
comparative genomics with many more plant species.
Further, we hope to integrate the organellar genomes into
the CGWR to enable a more complete global analysis.
We welcome and encourage suggestions for new and
interesting tracks from our users.
Availability and requirements
Project name: Chickpea Genomic Web Resource (CGWR)
Project home page: />php.
Operating system (s): Platform independent
Programming language: Perl, PHP, FORTRAN, CGI
Other requirements: Nil
License: Open Source license GNU GPL v2
Any restrictions to use by non-academics: Available Freely
to The Community
Misra et al. BMC Plant Biology (2014) 14:315
Abbreviations
BLAST: Basic local alignment sequence tool; CA_LG: Cicer arietinum linkage
group; CDS: Coding DNA Sequence; CGI: Common Gateway Interface;
CGWR: Chickpea Genomic Web Resource; Contig: A continuous sequence of
DNA that has been assembled from overlapping cloned DNA fragments;
CPAN: Comprehensive Perl Archive Network; CTDB: Chickpea Transcriptome
Database; DNA: Deoxyribonucleic acid; EST: Expressed sequence tags;
GFF: Generic Feature Format; GFF3: Generic Feature Format Version 3;
GMOD: Generic Model Organism Database; GUI: Graphical user interface;
GBrowse: Generic Genome Browser; HTML: HyperText Markup Language;
LINEs: Long Interspersed Elements; LTRs: Long Terminal Repeats;
miRNAs: MicroRNAs; MySQL: Structured Query Language; NCBI: National
Center for Biotechnology Information; NGCP: Next Generation Challenge
Programme; PFam: Database having large collection of protein families;
PHP: Hypertext Preprocessor; PSL: Text file format for representing sequence
alignments; PSSM: Position-Specific Scoring Matrix; RC Helitrons: Rolling circle
Helitrons; RNA: Ribonucleic acid; rRNAs: Ribosomal RNAs; SINEs: Short
Interspersed Elements; snoRNAs: Small nucleolar RNAs; SNP: Single
nucleotide polymorphisms; SSR: Simple Sequence Repeat; STS: Sequence
Tagged Site marker represents a single, unique, sequence-defined point in a
genome; Supercontig: A supercontig consists of one or more sequence
contigs known to occur in a specific order and orientation;
TFBS: Transcription Factor Binding site; tRNAs: Transfer RNAs; WGS: Whole
genome shotgun sequencing method.
Page 14 of 14
4.
5.
6.
7.
8.
9.
Competing interests
The authors declare that they have no competing interests.
10.
Authors’ contributions
GM, PP and NB developed the CGWR modules, browser tracks and carried
out nucleosome positioning studies. PP constructed maps and clustering
modules. NB carried out TFBS predictions. MJ, SB and DC contributed the
various chickpea specific datasets used in this work. GY and AKT conceived
and designed the software. All authors coordinated to draft, read and
approve the final manuscript.
Acknowledgements
The CGWR has been developed under the Next Generation Challenge
Program on chickpea genomics (NGCP) funded by the Dept. of
Biotechnology (DBT) of the Govt. of India (Grant No. BT/PR12919/AGR/02/
676/2009). GM and PP were recipients of the senior research fellowship (SRF)
of the DBT, Govt. of India and the CSIR, Govt. of India, respectively, during
the period of work. GY is a recipient of Women’s Excellence Award by
Scientific and Educational Research Board (SERB), Dept. of Science and
Technology (DST), Govt of India. Facilities provided under the Biotechnology
Information System Network (BTISNET) grant of the NIPGR Sub-Distributed
Information center (Sub-DIC) of the DBT, Govt. of India, are gratefully
acknowledged (Grant No. BT/BI/04/069/2006). Useful inputs and ideological
contributions from the members of the CGWR user committee are also
gratefully acknowledged.
Received: 16 June 2014 Accepted: 30 October 2014
References
1. Jain M, Misra G, Patel RK, Priya P, Jhanwar S, Khan AW, Shah N, Singh VK,
Garg R, Jeena G, Sharma P, Kant C, Yadav M, Yadav G, Bhatia S, Tyagi AK,
Chattopadhyay D: A draft genome sequence of the pulse crop chickpea
(Cicer arietinum L.). Plant J 2013, 74:715–729.
2. Varshney RK, Song C, Saxena RK, Azam S, Yu S, Sharpe AG, Cannon S, Baek J,
Rosen BD, Tar'an B, Millan T, Zhang X, Ramsay LD, Iwata A, Wang Y, Nelson
W, Farmer AD, Gaur PM, Soderlund C, Penmetsa RV, Xu C, Bharti AK, He W,
Winter P, Zhao S, Hane JK, Carrasquilla-Garcia N, Condie JA, Upadhyaya HD,
Luo MC, et al: Draft genome sequence of chickpea (Cicer arietinum)
provides a resource for trait improvement. Nat Biotechnol 2013, 31:240–246.
3. Schmutz J, Cannon SB, Schlueter J, Ma J, Mitros T, Nelson W, Hyten DL,
Song Q, Thelen JJ, Cheng J, Xu D, Hellsten U, May GD, Yu Y, Sakurai T,
Umezawa T, Bhattacharyya MK, Sandhu D, Valliyodan B, Lindquist E, Peto M,
Grant D, Shu S, Goodstein D, Barry K, Futrell-Griggs M, Abernathy B, Du J,
Tian Z, Zhu L, et al: Genome sequence of the palaeopolyploid soybean.
Nature 2010, 463:178–183.
11.
12.
13.
14.
15.
16.
17.
18.
19.
20.
Varshney RK, Chen W, Li Y, Bharti AK, Saxena RK, Schlueter JA, Donoghue
MT, Azam S, Fan G, Whaley AM, Farmer AD, Sheridan J, Iwata A, Tuteja R,
Penmetsa RV, Wu W, Upadhyaya HD, Yang SP, Shah T, Saxena KB, Michael T,
McCombie WR, Yang B, Zhang G, Yang H, Wang J, Spillane C, Cook DR, May
GD, Xu X, et al: Draft genome sequence of pigeonpea (Cajanus cajan), an
orphan legume crop of resource-poor farmers. Nat Biotechnol 2011,
30:83–89.
Phaseolus vulgaris v0.9, DOE-JGI and USDA-NIFA [tozome.
net/commonbean]
Young ND, Debelle F, Oldroyd GE, Geurts R, Cannon SB, Udvardi MK,
Benedito VA, Mayer KF, Gouzy J, Schoof H, Van de Peer Y, Proost S, Cook
DR, Meyers BC, Spannagl M, Cheung F, De Mita S, Krishnakumar V,
Gundlach H, Zhou S, Mudge J, Bharti AK, Murray JD, Naoumkina MA, Rosen
B, Silverstein KA, Tang H, Rombauts S, Zhao PX, Zhou P, et al: The Medicago
genome provides insight into the evolution of rhizobial symbioses.
Nature 2011, 480:520–524.
Sato S, Nakamura Y, Kaneko T, Asamizu E, Kato T, Nakao M, Sasamoto S,
Watanabe A, Ono A, Kawashima K, Fujishiro T, Katoh M, Kohara M, Kishida Y,
Minami C, Nakayama S, Nakazaki N, Shimizu Y, Shinpo S, Takahashi C, Wada
T, Yamada M, Ohmido N, Hayashi M, Fukui K, Baba T, Nakamichi T, Mori H,
Tabata S: Genome structure of the legume, Lotus japonicus. DNA Res 2008,
15:227–239.
Donlin MJ: Using the generic genome browser (GBrowse). Curr Protoc
Bioinformatics 2009, 28:9.9.1–9.9. 25.
Jhanwar S, Priya P, Garg R, Parida SK, Tyagi AK, Jain M: Transcriptome
sequencing of wild chickpea as a rich resource for marker development.
Plant Biotechnol J 2012, 10:690–702.
Garg R, Patel RK, Jhanwar S, Priya P, Bhattacharjee A, Yadav G, Bhatia S,
Chattopadhyay D, Tyagi AK, Jain M: Gene discovery and tissue-specific
transcriptome analysis in chickpea with massively parallel pyrosequencing
and web resource development. Plant Physiol 2011, 156:1661–1678.
Swarbreck D, Wilks C, Lamesch P, Berardini TZ, Garcia-Hernandez M, Foerster
H, Li D, Meyer T, Muller R, Ploetz L, Radenbaugh A, Singh S, Swing V, Tissier
C, Zhang P, Huala E: The Arabidopsis Information Resource (TAIR): gene
structure and function annotation. Nucleic Acids Res 2008,
36:D1009–D1014.
Altschul SF, Madden TL, Schäffer AA, Zhang J, Zhang Z, Miller W, Lipman DJ:
Gapped BLAST and PSI-BLAST: a new generation of protein database
search programs. Nucleic Acids Res 1997, 25:3389–3402.
Haas BJ, Delcher AL, Wortman JR, Salzberg SL: DAGchainer: a tool for
mining segmental genome duplications and synteny. Bioinformatics 2004,
20(18):3643–6.
Higo K, Ugawa Y, Iwamoto M, Korenaga T: Plant cis-acting regulatory DNA
elements (PLACE) database: 1999. Nucleic Acids Res 1999, 27:297–300.
Portales-Casamar E, Thongjuea S, Kwon AT, Arenillas D, Zhao X, Valen E,
Yusuf D, Lenhard B, Wasserman WW, Sandelin A: JASPAR 2010: the greatly
expanded open-access database of transcription factor binding profiles.
Nucleic Acids Res 2010, 38:D105–110.
Xi L, Fondufe-Mittendorf Y, Xia L, Flatow J, Widom J, Wang JP: Predicting
nucleosome positioning using a duration Hidden Markov Model. BMC
Bioinformatics 2010, 11:346.
Wang HC, Wang HC, Ko TP, Lee YM, Leu JH, Ho CH, Huang WP, Lo CF,
Wang AH: White spot syndrome virus protein ICP11: A histone-binding
DNA mimic that disrupts nucleosome assembly. Proc Natl Acad Sci U S A
2008, 105:20758–20763.
Papanicolaou A, Heckel DG: The GMOD Drupal bioinformatic server
framework. Bioinformatics 2010, 26:3119–3124.
Gonzales MD, Archuleta E, Farmer A, Gajendran K, Grant D, Shoemaker R,
Beavis WD, Waugh ME: The Legume Information System (LIS): an
integrated information resource for comparative legume biology. Nucleic
Acids Res 2005, 33:D660–665.
Main, D, Cheng, C-H, Ficklin, S.P, Jung, S, Zheng, P, Coyne, C.J, McGee, R,
Mockaitis, K: The Cool Season Food Legume Database: An Integrated
Resource for Basic, Translational and Applied Research. Proceedings of the
International Plant and Animal Genome Conference: 12-16 January 2013, San
Diego, CA, USA