ChromoWIZ: A web tool to query and visualize chromosome-anchored genes from cereal and model genomes
Bạn đang xem bản rút gọn của tài liệu. Xem và tải ngay bản đầy đủ của tài liệu tại đây (951.49 KB, 9 trang )
Nussbaumer et al. BMC Plant Biology 2014, 14:348
/>
DATABASE
Open Access
chromoWIZ: a web tool to query and visualize
chromosome-anchored genes from cereal and
model genomes
Thomas Nussbaumer1†, Karl G Kugler1†, Wolfgang Schweiger2, Kai C Bader1, Heidrun Gundlach1,
Manuel Spannagl1, Naser Poursarebani3, Matthias Pfeifer1 and Klaus FX Mayer1*
Abstract
Background: Over the last years reference genome sequences of several economically and scientifically important
cereals and model plants became available. Despite the agricultural significance of these crops only a small number
of tools exist that allow users to inspect and visualize the genomic position of genes of interest in an interactive
manner.
Description: We present chromoWIZ, a web tool that allows visualizing the genomic positions of relevant genes
and comparing these data between different plant genomes. Genes can be queried using gene identifiers,
functional annotations, or sequence homology in four grass species (Triticum aestivum, Hordeum vulgare,
Brachypodium distachyon, Oryza sativa). The distribution of the anchored genes is visualized along the
chromosomes by using heat maps. Custom gene expression measurements, differential expression information, and
gene-to-group mappings can be uploaded and can be used for further filtering.
Conclusions: This tool is mainly designed for breeders and plant researchers, who are interested in the location
and the distribution of candidate genes as well as in the syntenic relationships between different grass species.
chromoWIZ is freely available and online accessible at />Keywords: Cereals, Bread wheat, Barley, Brachypodium, Rice, Comparative genomics
Background
Since the release of the sequenced genome of Arabidopsis thaliana in 2000 [1], more than 50 plant reference sequences have become available [2]. While the average
genome size in Angiosperms is about 6 Gb [3], sequencing efforts have focused mainly on smaller-sized genomes (< 1 Gb), which serve as models for large and
still unsequenced species or on more accessible crop
plant genomes such as rice (Oryza sativa). The cereal
species of the Pooideae subfamily, including bread wheat
(Triticum aestivum), barley (Hordeum vulgare), and rice
are among the most important crops and share a high
degree of syntenic conservation on a genome-wide
level [4,5]. Among the crops, hexaploid bread wheat
* Correspondence:
†
Equal contributors
1
Plant Genome and System Biology (PGSB), Helmholtz Center Munich,
D-85764 Neuherberg, Germany
Full list of author information is available at the end of the article
(T. aestivum, 2n = 6x = 42, AABBDD) contains the largest and most complex genome with a size of roughly
17 Gb [6]. Despite its high economic relevance – 20% of
the calories consumed by the world’s population derive
from bread wheat – its genome has so far not been completely assembled. It has taken several years to provide a
reference sequence for even one chromosome (3B, [7]),
which by itself exceeds the genome size of rice almost
3-fold. Recently, shotgun sequencing and flow cytometry
provided the basis for a gene annotation of the complete
bread wheat genome comprising ~124 k gene models [6].
Furthermore, for selected chromosomes or chromosome arms, a physical map has been established and
genetically anchored (e.g. 1A [8,9], 1BS [10], 3B [7,11],
6A [12]). For barley an anchored physical map that
covers 3.9 Gb cumulative map length has been released
[13,14], including 26 k high-confidence genes and
© 2014 Nussbaumer et al.; licensee BioMed Central Ltd. This is an Open Access article distributed under the terms of the
Creative Commons Attribution License ( which permits unrestricted use,
distribution, and reproduction in any medium, provided the original work is properly credited. The Creative Commons Public
Domain Dedication waiver ( applies to the data made available in this
article, unless otherwise stated.
Nussbaumer et al. BMC Plant Biology 2014, 14:348
/>
comprises shotgun assemblies from three cultivars.
Most shotgun contigs have already been anchored by
population genetics. This approach, called POPSEQ
[15], was also used to improve the anchoring of
the physical map [13]. Like bread wheat and barley,
Brachypodium (Brachypodium distachyon) also belongs to the Pooideae subfamily within the Poaceae
family. It has a relatively small genome (~300 Mb) and
has been widely used as a model organism to study
the structure and evolution of other grass species [16].
Rice is another important member of the Poaceae family
and represents one of the most important staple foods
worldwide. To successfully integrate all the different
resources, e.g. genetic information and gene expression
measurements, for these crop species, heterogeneous
datasets need to be combined. Therefore, tools and standards for interlinking anchored datasets are required
(reviewed in [17]). One of the approaches for combining
heterogeneous datasets is the “GenomeZipper” [4]. It establishes a virtual order of genes in plants without assembled chromosomes by exploiting the highly conserved
synteny to smaller, already sequenced genomes. Largesized syntenic regions, together with genetic marker sets
enable an anchoring of most genes for larger-sized cereals
including e.g. barley [14], rye (Secale cereale) [18] and
Aegilops tauschii [19]. Since after the split from their
common ancestor, the position of most genes was conserved, this approach provides robust approximations
of the gene positions and order [20].
A small number of tools exist that allow users to inspect
the genomic position of query genes in target genomes.
For barley it is possible to map query sequences by using
IPK Viroblast ( or barleymap ( However,
to our knowledge, no web-based tool exists that covers
several genomes and allows calculating and visualizing the
gene density along the chromosome. This is especially
of importance when several dozen genes need to be
mapped, e.g. for analyzing a quantitative trait locus
(QTL). Transcriptome-oriented studies might reveal a
set of gene candidates and the corresponding genomic
position supports in removing false-positives gene candidates and defining the genetic or physical location of
the QTL. None of the listed tools provide queries based
on functional annotation or the integration of expression data. As part of the GenomeZipper, we have previously implemented a module ‘chromoWIZ’ which was
introduced to ease detection of syntenic regions for a
yet unassembled genome and several sequenced and assembled genomes including Brachypodium [16], rice
[21] and sorghum (Sorghum bicolor) [22]. Here, we describe the web-based version of chromoWIZ along with
new features. Originally, chromoWIZ was restricted to
local use as part of the GenomeZipper package and
Page 2 of 9
allowed a mapping of genes or shotgun contigs of one
chromosome or chromosome arm against the reference
genomes Brachypodium, rice and sorghum. To find
genomic positions for genes of interest, in the latest,
web-based version functional annotations and sequence
homology can be used to find the corresponding regions within the corresponding genome. For grouped
or clustered genes chromoWIZ now visualizes the physical position in a group-wise manner. In its latest
version, chromoWIZ integrates the anchoring results
of both the International Barley Genome Sequence
Consortium (IBSC [14]), and the International Wheat
Genome Sequencing Consortium (IWGSC [6]) and allows comparing sequences against the genomes of
Brachypodium and rice. This tool is mainly designed
for breeders and plant researchers, who are interested
in the location and the distribution of candidate genes
as well as in the syntenic relationships between different grass species. In order to illustrate the features of
chromoWIZ and to explain the basic work-flows, we
present different use cases. The application website
can be accessed at: mholtz-muenchen.
de/plant/chromoWIZ/index.jsp without any restrictions.
Construction and content
chromoWIZ runs on a webserver at the PGSB site [23].
The tool’s back-end is implemented in the programming
language Python. The front-end uses native HTML and
Javascript for data visualization and navigation. Mapping
information and gene information were collected from
the official releases of the Brachypodium, rice, barley
and bread wheat genomes [6,14,16,21]. For Brachypodium protein and coding sequences, as well as functional
annotation information were collected from the PGSB
database [23] using gene models’ version 1.2. For barley
we integrated the datasets that were provided with
the genetically anchored physical map [14], which is
hosted at />barley/public_data. For bread wheat, gene models from
version 2.2 ( />wheat/IWGSC) were included. The MSU7 annotation has
been integrated for rice [21]. More details for the currently
used datasets and the corresponding updates are provided
on the chromoWIZ web site.
Utility
Application of chromoWIZ
chromoWIZ allows visualizing the location of anchored
genes along chromosomes on the basis of functional
gene annotations, sequence homology or gene lists. So
far, the web tool includes the crop species bread wheat
(T. aestivum), barley (H. vulgare) and the closely related
but much smaller Brachypodium (B. distachyon) and rice
(O. sativa) genomes. Anchored genes are clustered
Nussbaumer et al. BMC Plant Biology 2014, 14:348
/>
together along the chromosome in non-overlapping genomic or genetic intervals, referred to as bins. In Brachypodium and rice, every bin represents one megabase
(Mb) of non-overlapping chromosomal sequence. For
barley 10 Mb and for bread wheat 5 CentiMorgan (cM)
intervals are used. Bins are visualized as heat maps to
enable an intuitive view along the entire chromosomes.
The genomic positions in barley are highlighted relative
to the anchored physical BAC contigs which were strung
together to form virtual chromosomes. All genes within
chromoWIZ are linked to external databases providing
additional information on the gene models (e.g. for
bread wheat EnsemblePlants embl.
org/Triticum_aestivum/Info/Index). The sequences of
tagged genes within a bin can be downloaded in the
FASTA format. To obtain the genomic location for
genes of interest, referred to as “tagged genes”, chromoWIZ provides several search methods (Table 1): By
sequence homology a set of query sequences can be
mapped against the annotated gene models using nucleotide or protein BLAST searches, requiring a predefined e-value and sequence identity. Alternatively, if
known, a list of species-specific gene identifiers can be directly provided instead of sequences. To query families of
genes (e.g. genes sharing a specific Gene Ontology (GO)
term or PFAM domain [24,25], an annotation-based approach has been included. The distribution of query genes
is visualized by heat maps, which depict the relative distribution of the query-matching genes compared to the overall number of genes along the chromosomes. In addition,
the overall gene distribution is shown, as the number of
anchored genes varies between the different bins. To see
whether certain chromosome (−arms) are enriched for
tagged genes an enrichment analysis is provided. The significance of over-representation of genes tagged is assessed
Page 3 of 9
by a one-sided Fisher’s exact test and a Bonferroni adjustment of P values. Furthermore, labeled groups of genes can
be included, e.g. genes being clustered or co-expressed or
that were grouped together based on sequence similarity to
allow for a group-wise visualization and analysis. The Data
Manager is a part of chromoWIZ that enables the upload of
various user-specific datasets and performs a validation of
input data prior to integration into the chromoWIZ search
interface. These data are subsequently only visible for the
respective user and available for 24 hours before they are
being automatically removed from the servers. Gene expression is an important factor for judging the relevance of
candidate genes. In chromoWIZ, by using the Data Manager, users can optionally upload expression values for their
genes of interest. Similar to expression data, information
about differential expression can be provided. With expression data at hand, functional information can be combined
with the genomic positions.
The following use cases illustrate different aspects of
chromoWIZ. The first use case describes how candidate
genes can be mapped against the reference genome sequences using the gene identifiers, sequence-based
searches or functional annotations. The second use case
illustrates how a list of genes can be filtered based on
their expression or by including information about differential expression. In the third use case we show how
chromoWIZ allows highlighting syntenic regions between bread wheat and Brachypodium or barley. In the
fourth use case we use published expression data to illustrate how the gene-to-group information can help in
refining the genomic position of a resistance QTL. This
is granted by transferring data from ancient to recent
reference sequences. The fifth use case finally gives an
example of how chromoWIZ can be applied for comparative genomic analysis.
Table 1 A variety of search features are provided by chromoWIZ
Search feature
Description
Data needed
Sequence similarity
Genes can be searched using homology either on nucleotide sequence level (BLASTN) or
protein sequence level (BLASTP).
-
Gene identifier
List of gene identifiers as provided within the genome release.
-
Gene Ontology (GO)
annotation
Genes can be searched based on their GO annotation.
-
PFAM annotation
Genes can be searched based on their PFAM annotation.
-
Expression variation
Gene expression levels need to vary across conditions in order to filter for interesting genes
as quantified by using the coefficient of variation (sample standard deviation divided by the
sample mean).
Expression matrix
Presence of expression
The expression has to surpass a custom expression threshold in at least one condition.
Expression matrix
Differential expression
Genes have to be in a list of genes being differentially expressed, as provided by the user.
List of differentially expressed
genes
Gene clustering
Genes have to be in a certain group of clustered genes. Clustering information is provided
by the user.
Gene to cluster linkage list
While some features are always available for all genomes, for the expression-based searches the user has to upload the corresponding data first.
Nussbaumer et al. BMC Plant Biology 2014, 14:348
/>
Use case 1: finding genes using identifiers, sequence
similarity or annotations
One of the very basic functionalities of chromoWIZ is
searching and visualizing genes by their identifiers.
Given a set of species-specific gene identifiers their genomic position can be highlighted. In case no identifiers
are available, an alternative approach is to provide sequence information for the corresponding genes. To illustrate this feature, we use the following example: A list
of 19 gene identifiers from Brachypodium, preselected
from a particular genomic region, was provided to the
search interface (the gene identifiers are given in Additional
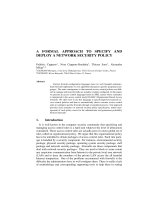
file 1). chromoWIZ provides two outputs: First a heat map
which depicts the number of all anchored genes along the
chromosomes per bin (Figure 1A), and secondly, a heat
map showing only the anchored genes that meet the query
criteria (tagged genes) is shown (Figure 1B). For the given
example the corresponding bin (bin9, 9-10 Mb) on
chromosome 5 is highlighted. To illustrate the sequencebased search, we first extracted the gene sequences from
this bin, by using the FASTA export functionality of chromoWIZ. This set of sequences was then provided to the
search interface in order to perform a homology-based
search. By only visualizing matches below an e-value of
10E-5, sequence identity of 100% and by requiring a best bidirectional match (flag ‘BBH’ has to be set) we again retrieved the bin containing the genes.
Page 4 of 9
Besides the gene identifier and homology-based search,
chromoWIZ also offers a search by gene annotation functionalities. A user might be interested in a particular gene
family and would like to analyze whether members of that
family have increased or decreased copy numbers compared to other genomes. One way to analyze differences in
copy numbers is to compare the amount of genes on the
basis of protein families (PFAM [25]) or Gene Ontology
(GO [24]) terms and chromoWIZ includes annotation information from these sources. In the given example,
we aimed at visualizing all genes that are annotated
under the Gene Ontology (GO) term GO:0043565
(sequence-specific DNA binding) that e.g. comprises transcription factors. In Brachypodium, we found matches to
349 genes, in bread wheat matches to 421 (732 including
genetically unanchored) genes, and in barley we found
matches to 225 (340) genes.
Use case 2: filtering for differentially expressed genes and
usage of expression constraints
RNA-seq data is commonly used to analyze gene expression on a genome-wide level. It can efficiently be processed by means of analysis pipelines such as Cufflinks
[26] or HTSeq [27]. After finding gene candidates based
on their expression patterns it is often of interest to
explore their respective genomic position. chromoWIZ
provides features for combining expression data with
Figure 1 Heat map visualization of gene density. chromoWIZ visualizes the gene distribution of (A) all genes anchored as compared to
(B) the number of genes matching the query criteria. The tooltip reports the relative and absolute number of tagged genes per bin.
Nussbaumer et al. BMC Plant Biology 2014, 14:348
/>
positional information: (i) gene-to-group information
can be provided. (ii) lists of differentially expressed
genes can be included, and (iii) expression data of all
genes can be integrated. Figure 2 shows the Data Manager input and the extended query features on the entry
site, which are available once the data sets are included.
Gene-to-group information is provided by an input file
where the first column contains the gene identifier and
the second column defines the group. The differentially
expressed genes (DEGs) are provided via an input file
that contains the gene identifiers. Also expression information can be provided in a file, where columns represent the conditions of interest. Details about the file
formats are given on the chromoWIZ help page. When
information about differentially expressed genes is included, the user can specify whether only differentially
expressed genes should be queried. If expression information is included, genes can be filtered by two criteria:
Either by a ‘Minimum expression’ criterion, meaning
that at least in one condition the expression must exceed
a given threshold. Alternatively, to find genes with expression variation across conditions, a user can set a
‘CV’ (coefficient of variation, given by dividing the sample standard deviation by the sample mean) filter, to only
keep genes with a minimum required CV value.
For illustration we extracted 692 barley transcripts
that are differentially expressed between two Tibetan
wild barley genotypes in response to low potassium
Page 5 of 9
treatment [28]. The transcript sequences as given in
Table S3 of [28] ( />pone.0100567.s009) were mapped against the genetically anchored barley gene models using BLASTN (sequence identity greater than 95%, e-value of 10E-10,
BBH criterion). The 450 matching genes were compiled into a list of differentially expressed genes
(Additional file 2) and uploaded by using the Data
Manager. When searching barley for anchored differentially expressed genes we obtained 286 hits scattered
across the different chromosomes.
Use case 3: pronounced syntenic regions shared in grass
species
chromoWIZ has been repeatedly used to define and refine
syntenic regions among related reference genomes [29,30].
For illustration, we used gene models of bread wheat
chromosome 4A [6] and to initiated a sequence homology
search against Brachypodium and barley genes. In total
4,830 genes are annotated on chromosome 4A and the
corresponding sequences were extracted and aligned
against both genomes using BLASTN (sequence identity
of at least 70% and an e-value of 10E-5, best bidirectional
hit). We found matches against chromosomes 1 and 4 in
Brachypodium and a rearrangement of an approximately
3 Mb genomic region that was shifted from the short
arm of chromosome 1 to the long arm (Figure 3A).
Figure 2 Integration of gene expression information. Gene expression information, lists of differentially genes, and/or gene-to-group mapping
data can be uploaded for enabling expression-based querying of genes. The different color codes highlight the search options, which become
available after uploading the corresponding data.
Nussbaumer et al. BMC Plant Biology 2014, 14:348
/>
Page 6 of 9
Figure 3 Synteny between bread wheat chromosome 4A, Brachypodium and barley. Using chromoWIZ, genes from the bread wheat
chromosome 4A were mapped against Brachypodium (A) and against barley (B) in order to highlight syntenic regions.
Additionally, in chromosome 4, the centromeric and pericentromeric near regions were tagged. When bread wheat
chromosome 4A was compared against barley, besides the
largely homeologous chromosome 4H, syntenic regions
on chromosome 5H and chromosome 7H were found,
comprising genomic regions of 40 Mb respectively
(Figure 3B). These findings are consistent with the
documented chromosome rearrangements of bread
wheat chromosome 4A [31].
Use case 4: providing cluster information for tagging genes
Clustering genome-wide expression data into meaningful
subsets has become a standard procedure in many
transcriptome-oriented studies. Several methods enable
to perform such a partitioning of data, e.g. by hierarchical clustering, k-means clustering or network-based approaches. chromoWIZ provides support for group-wise
analyses as it allows uploading gene-to-group information. The example data for this use case originates from
a co-expression network study assessing the effect of
fungal pathogens on different bread wheat lines [32].
The five bread wheat lines in this study were characterized by the presence or absence of particular quantitative
trait loci (QTL), which confer different resistance levels.
This data has been used to infer a co-expression network with the Weighted Correlation Network Analysis
approach (WGCNA, [33]). WGCNA can be utilized to
find clusters of highly connected genes, so called network
modules, based on inferring a correlation-based weighted
gene network. After mapping the bread wheat transcriptome data to a 454 sequencing based whole genome
assembly [34] and after quantifying the expression using
Cufflinks [26], we observed eight different modules which
represented distinct expression patterns containing 3,273
genes in total. One module was of particular interest
as the related gene expression depicted a pronounced
response to the fungal pathogen. The corresponding
nucleotide sequences are given in Additional file 3.
Using chromoWIZ those transcripts were mapped
against the bread wheat genome survey sequence [6]
by requiring a best bidirectional match and sequence
identity of at least 95%. A significant enrichment for
chromosome (−arms) 3B, 5BL, and 7DL was found
(Figure 4). This is in support of the experimental setup as one of the major Fusarium head blight resistance QTLs (Fhb1) that segregates between resistant
and susceptible lines and is located on the short arm
of chromosome 3B [35].
Use case 5: comparative genomics in chromoWIZ for
analyzing UDP-gylcosyltransferases
chromoWIZ can be used to detect homologous genes
and their locations in the four cereal and model genomes
using the implemented BLAST searches. To illustrate this,
we searched for Brachypodium UDP-glycosyltransferases
(UGT) homologous genes in rice, barley, and bread wheat.
The Brachypodium UGT gene family contains five members of which several encode for the ability to inactivate
the mycotoxin deoxynivalenol (Additional file 4) [36].
Deoxynivalenol is a potent inhibitor of protein biosynthesis produced by Fusarium graminearum, which is a
pathogen also to wheat and barley [37]. The presence/activity of such UGTs may confirm high resistance. Yet, their
identification remains challenging also due to the sheer
Nussbaumer et al. BMC Plant Biology 2014, 14:348
/>
Page 7 of 9
Figure 4 Chromosome (−arm) enrichment of genes responsive to a fungal pathogen. Bread wheat chromosome (−arm) enrichment for
genes, which were responsive to Fusarium graminearum. Chromosome (−arms) 3B, 5BL, and 7DL are found to be significantly enriched for these genes.
size of the UGT superfamily, which comprises 178
members in Brachypodium and probably several hundred in bread wheat [36]. chromoWIZ mapped these
six genes to the third and fourth bin on chromosome
5 in Brachypodium. In order to find putative orthologous genes, we extracted the sequences and mapped
them against rice, bread wheat and barley. In barley,
matches were found to the 2H (3) and 5H (1) chromosomes using 70% identity and e-value of 10E-5 as
search criterions. In addition a match to a yet genetically unanchored gene was found. In rice, matches on
chromosome 4 (8) and chromosome 9 (1) were observed, confirming previous findings [36]. In bread
wheat matches to 2A (1), 2B (1), 2D (1) and 5A (1) indicate possible homoeologous gene-clusters on linkage
group 2, however most genes (13) did not receive any
genetic position yet. No matches were observed for
chromosome 3B containing the Fhb1 locus [35], which
was previously shown to govern the higher ability to
inactivate the toxin [38].
Discussion
chromoWIZ allows searching for candidate genes and
visualizing their density and localizations along chromosomes of selected grass genomes. Genes can be searched
by using several options, e.g. by gene identifiers, by functional annotation, by sequence homology search or by
gene-to-group mappings. The tool is implemented in a
flexible way to ensure that novel genomes or updates of
existing genomes can be easily undertaken. Export features are provided and extended functionality is activated if gene expression data or clustering information is
provided.
chromoWIZ enables the integration of expression-based
information to filter for candidate genes
While there are several tools that provide information,
mapping, and visualizations capabilities with respect to
syntenic relationships in plant genomes [39,40], there
is a lack for tools to query and interactively inspect
genetically and physically anchored genes. One of the
major advantages of chromoWIZ over other tools such
as barleymap ( or
IPK Viroblast ( />is that expression data can be included to filter by several
criteria and thereby selecting the most relevant genes. In
addition, clustering information and gene-to-group mappings such as sets of co-expressed genes, selected gene
families and/or differentially expressed genes can be included and independently analyzed. The different datasets
can be imported by using the Data Manager as intrinsic
part of the chromoWIZ web application. After uploading
the data additional filtering and search options appear on
the entry page (Table 1 and Figure 2).
chromoWIZ enables transferring previous results to the
current reference sequences
chromoWIZ allows linking gene anchoring information
with the annotated gene information and provides access
to the gene candidates and their localization as well as
to their neighboring genes. With actively ongoing projects and the consequential updates of the reference sequences of bread wheat and barley, data need to be
mapped to a common reference sequence to compare
previous results against current ones. We demonstrated
this approach by using a particular gene co-expression
module that comprised the major response of bread
wheat genes against a fungal pathogen [32]. As shown in
Nussbaumer et al. BMC Plant Biology 2014, 14:348
/>
use case 4 chromoWIZ allowed transferring previous
analysis [32] onto updated resources by mapping from
an earlier bread wheat genome draft [34] to more recent
chromosome-arm sorted shotgun contigs [6].
chromoWIZ enables to detect larger syntenic blocks
within yet unfinished genomes
For (novel) grass genomes, chromoWIZ can be used to
detect and analyze syntenic regions with respect to Brachypodium, rice, barley, and bread wheat. In use case 3,
annotated gene models of bread wheat chromosome 4A
were used to detect syntenic regions in comparison to
barley and Brachypodium (Figure 3). This chromosome
is of particular interest, because in most cases barley and
wheat chromosomes are collinear [4]. For this specific
chromosome syntenic regions appeared also on barley
chromosomes 5H and 7H [31]. Furthermore, when arm
sorted chromosome datasets become available for a newly
sequenced but not yet assembled genome, chromoWIZ
can help to allocate genes to corresponding syntenic
regions in barley, rice, bread wheat, and Brachypodium.
Thereby, it offers a first glance at the genome structure of
these plants, particularly for revealing rearrangements and
introgression and to analyze more complex nested syntenic structures.
Conclusions
chromoWIZ provides a valuable and user-friendly interface to access anchored genes for agriculturally important crops and model genomes. By using the different
query options it is possible to flexibly narrow down regions of interest and/or gene candidates. With future
updates it is planned to include more species and to extend the range of features prior to allow interactive and
integrative searches on evolving large and complex crop
plant genomes.
Availability and requirements
chromoWIZ is freely available without any restrictions
at />index.jsp.
License: Not required.
Any restrictions to use by non-academics: None.
Availability of supporting data
The data sets supporting the results of this article are included within the article (and its additional files).
Additional files
Additional file 1: List of genes for use case 1. List of 19 genes as
taken from a particular genomic bin in Brachypodium and used for
demonstrating the basic functionality of chromoWIZ.
Page 8 of 9
Additional file 2: Barley genes responsive to low potassium for
use case 2. List of barley genes matching transcripts from a study about
Tibetan wild barley genotypes under low potassium [28] those were used
for integration into the Data Manager.
Additional file 3: List of fungal pathogen-responsive genes for use
case 4. List of genes that were clustered together in a Fusarium
graminearum responsive network module as reported in [32].
Additional file 4: List of UDP-glycosyltransferases homologs as
reported in use case 5. Brachypodium genes of the UDP-glycosyltransferases
family and their homologous matches to rice, barley, and bread wheat.
Abbreviations
BBH: Best bidirectional hit; GO: Gene Ontology; IBSC: International Barley
Genome Sequencing Consortium; IWGSC: International Wheat Genome
Sequencing Consortium; POPSEQ: Anchoring and ordering NGS contig
assemblies by population sequencing; QTL: Quantitative trait loci; UGT:
UDP-dependent glycosyltransferases; WGCNA: Weighted Correlation
Network Analysis.
Competing interests
The authors declare that they have no competing interests.
Authors’ contributions
HG, TN, and KFXM initiated the first version of the software. TN, KGK, and
KCB implemented the software. KGK, TN, WS, NP, MS, MP, and KFXM drafted
and designed the use cases. TN, KGK, WS, and KFXM drafted and wrote the
manuscript. All authors approved the final version of the manuscript.
Acknowledgements
We gratefully acknowledge the Funding by the Deutsche
Forschungsgemeinschaft (DFG) SFB 924 to KFXM and by the Austrian
Science Fund (FWF) special research project F37 (F3705, F3711).
Author details
1
Plant Genome and System Biology (PGSB), Helmholtz Center Munich,
D-85764 Neuherberg, Germany. 2Institute for Biotechnology in Plant
Production, IFA-Tulln, University of Natural Resources and Life Sciences,
A-3430 Tulln, Austria. 3Leibniz Institute of Plant Genetics and Crop Plant
Research (IPK), OT Gatersleben, Corrensstraße 3, D-06466 Stadt Seeland,
Germany.
Received: 1 September 2014 Accepted: 24 November 2014
References
1. Arabidopsis Genome Initiative: Analysis of the genome sequence of the
flowering plant Arabidopsis thaliana. Nature 2000, 408(6814):796–815.
2. Michael TP, Jackson S: The first 50 plant genomes. Plant Genome 2013,
6(2). />plantgenome2013.03.0001in.
3. Morrell PL, Buckler ES, Ross-Ibarra J: Crop genomics: advances and applications. Nat Rev Genet 2011, 13(2):85–96.
4. Mayer KF, Martis M, Hedley PE, Simkova H, Liu H, Morris JA, Steuernagel B,
Taudien S, Roessner S, Gundlach H, Kubalakova M, Suchankova P, Murat F,
Felder M, Nussbaumer T, Graner A, Salse J, Endo T, Sakai H, Tanaka T, Itoh T,
Sato K, Platzer M, Matsumoto T, Scholz U, Dolezel J, Waugh R, Stein N:
Unlocking the barley genome by chromosomal and comparative
genomics. Plant Cell 2011, 23(4):1249–1263.
5. Bolot S, Abrouk M, Masood-Quraishi U, Stein N, Messing J, Feuillet C, Salse J:
The ‘inner circle’ of the cereal genomes. Curr Opin Plant Biol 2009,
12(2):119–125.
6. International Wheat Genome Sequencing Consortium: A chromosome-based
draft sequence of the hexaploid bread wheat (Triticum aestivum) genome.
Science 2014, 345(6194):1251788.
7. Choulet F, Alberti A, Theil S, Glover N, Barbe V, Daron J, Pingault L, Sourdille
P, Couloux A, Paux E, Leroy P, Mangenot S, Guilhot N, Le Gouis J, Balfourier
F, Alaux M, Jamilloux V, Poulain J, Durand C, Bellec A, Gaspin C, Safar J,
Dolezel J, Rogers J, Vandepoele K, Aury JM, Mayer K, Berges H, Quesneville
H, Wincker P, et al: Structural and functional partitioning of bread wheat
chromosome 3B. Science 2014, 345(6194):1249721.
Nussbaumer et al. BMC Plant Biology 2014, 14:348
/>
8.
9.
10.
11.
12.
13.
14.
15.
16.
17.
18.
19.
20.
21.
22.
23.
24.
Breen J, Wicker T, Shatalina M, Frenkel Z, Bertin I, Philippe R, Spielmeyer W,
Simkova H, Safar J, Cattonaro F, Scalabrin S, Magni F, Vautrin S, Berges H,
International Wheat Genome Sequencing C, Paux E, Fahima T, Dolezel J,
Korol A, Feuillet C, Keller B: A physical map of the short arm of wheat
chromosome 1A. PLoS One 2013, 8(11):e80272.
Lucas SJ, Akpinar BA, Kantar M, Weinstein Z, Aydinoglu F, Safar J, Simkova H,
Frenkel Z, Korol A, Magni F, Cattonaro F, Vautrin S, Bellec A, Berges H,
Dolezel J, Budak H: Physical mapping integrated with syntenic analysis to
characterize the gene space of the long arm of wheat chromosome 1A.
PLoS One 2013, 8(4):e59542.
Raats D, Frenkel Z, Krugman T, Dodek I, Sela H, Simkova H, Magni F,
Cattonaro F, Vautrin S, Berges H, Wicker T, Keller B, Leroy P, Philippe R, Paux
E, Dolezel J, Feuillet C, Korol A, Fahima T: The physical map of wheat
chromosome 1BS provides insights into its gene space organization and
evolution. Genome Biol 2013, 14(12):R138.
Paux E, Sourdille P, Salse J, Saintenac C, Choulet F, Leroy P, Korol A,
Michalak M, Kianian S, Spielmeyer W, Lagudah E, Somers D, Kilian A, Alaux
M, Vautrin S, Berges H, Eversole K, Appels R, Safar J, Simkova H, Dolezel J,
Bernard M, Feuillet C: A physical map of the 1-gigabase bread wheat
chromosome 3B. Science 2008, 322(5898):101–104.
Poursarebani N, Nussbaumer T, Simkova H, Safar J, Witsenboer H, van
Oeveren J, Dolezel J, Mayer KF, Stein N, Schnurbusch T: Whole-genome
profiling and shotgun sequencing delivers an anchored, gene-decorated,
physical map assembly of bread wheat chromosome 6A. Plant Journal
2014, 79(2):334–347.
Ariyadasa R, Mascher M, Nussbaumer T, Schulte D, Frenkel Z, Poursarebani
N, Zhou R, Steuernagel B, Gundlach H, Taudien S, Felder M, Platzer M,
Himmelbach A, Schmutzer T, Hedley PE, Muehlbauer GJ, Scholz U, Korol A,
Mayer KF, Waugh R, Langridge P, Graner A, Stein N: A sequence-ready physical
map of barley anchored genetically by two million single-nucleotide
polymorphisms. Plant Physiol 2014, 164(1):412–423.
International Barley Genome Sequencing Consortium, Mayer KF, Waugh R,
Brown JW, Schulman A, Langridge P, Platzer M, Fincher GB, Muehlbauer GJ,
Sato K, Close TJ, Wise RP, Stein N: A physical, genetic and functional
sequence assembly of the barley genome. Nature 2012, 491(7426):711–716.
Mascher M, Muehlbauer GJ, Rokhsar DS, Chapman J, Schmutz J, Barry K,
Munoz-Amatriain M, Close TJ, Wise RP, Schulman AH, Himmelbach A, Mayer
KF, Scholz U, Poland JA, Stein N, Waugh R: Anchoring and ordering NGS
contig assemblies by population sequencing (POPSEQ). Plant J 2013,
76(4):718–727.
International Brachypodium Initiative: Genome sequencing and analysis of
the model grass Brachypodium distachyon. Nature 2010, 463(7282):763–768.
Spannagl M, Martis MM, Pfeifer M, Nussbaumer T, Mayer K: Analysing complex
Triticeae genomes—concepts and strategies. Plant Methods 2013, 9(1):35.
Martis MM, Zhou R, Haseneyer G, Schmutzer T, Vrana J, Kubalakova M, Konig
S, Kugler KG, Scholz U, Hackauf B, Korzun V, Schon CC, Dolezel J, Bauer E,
Mayer KF, Stein N: Reticulate evolution of the rye genome. Plant Cell 2013,
25(10):3685–3698.
Jia J, Zhao S, Kong X, Li Y, Zhao G, He W, Appels R, Pfeifer M, Tao Y, Zhang
X, Jing R, Zhang C, Ma Y, Gao L, Gao C, Spannagl M, Mayer KF, Li D, Pan S,
Zheng F, Hu Q, Xia X, Li J, Liang Q, Chen J, Wicker T, Gou C, Kuang H, He G,
Luo Y, et al: Aegilops tauschii draft genome sequence reveals a gene
repertoire for wheat adaptation. Nature 2013, 496(7443):91–95.
Poursarebani N, Ariyadasa R, Zhou R, Schulte D, Steuernagel B, Martis MM,
Graner A, Schweizer P, Scholz U, Mayer K, Stein N: Conserved synteny-based
anchoring of the barley genome physical map. Funct Integr Genomics 2013,
13(3):339–350.
International Rice Genome Sequencing Project: The map-based sequence
of the rice genome. Nature 2005, 436(7052):793–800.
Paterson AH, Bowers JE, Bruggmann R, Dubchak I, Grimwood J, Gundlach H,
Haberer G, Hellsten U, Mitros T, Poliakov A, Schmutz J, Spannagl M, Tang H,
Wang X, Wicker T, Bharti AK, Chapman J, Feltus FA, Gowik U, Grigoriev IV,
Lyons E, Maher CA, Martis M, Narechania A, Otillar RP, Penning BW, Salamov
AA, Wang Y, Zhang L, Carpita NC, et al: The Sorghum bicolor genome and
the diversification of grasses. Nature 2009, 457(7229):551–556.
Nussbaumer T, Martis MM, Roessner SK, Pfeifer M, Bader KC, Sharma S,
Gundlach H, Spannagl M: MIPS PlantsDB: a database framework for
comparative plant genome research. Nucleic Acids Res 2013,
41(Database issue):D1144–D1151.
Ashburner M, Ball CA, Blake JA, Botstein D, Butler H, Cherry JM, Davis AP,
Dolinski K, Dwight SS, Eppig JT, Harris MA, Hill DP, Issel-Tarver L, Kasarskis A,
Page 9 of 9
25.
26.
27.
28.
29.
30.
31.
32.
33.
34.
35.
36.
37.
38.
39.
40.
Lewis S, Matese JC, Richardson JE, Ringwald M, Rubin GM, Sherlock G: Gene
ontology: tool for the unification of biology. Gene Ontol Consortium Nat
Genet 2000, 25(1):25–29.
Finn RD, Bateman A, Clements J, Coggill P, Eberhardt RY, Eddy SR, Heger A,
Hetherington K, Holm L, Mistry J, Sonnhammer EL, Tate J, Punta M: Pfam: the
protein families database. Nucleic Acids Res 2014, 42(Database issue):D222–D230.
Trapnell C, Roberts A, Goff L, Pertea G, Kim D, Kelley DR, Pimentel H,
Salzberg SL, Rinn JL, Pachter L: Differential gene and transcript expression
analysis of RNA-seq experiments with TopHat and Cufflinks. Nat Protoc
2012, 7(3):562–578.
Anders S, Pyl PT, Huber W: HTSeq-a Python framework to work with highthroughput sequencing data. Bioinformatics 2014. />content/biorxiv/early/2014/02/20/002824.full.pdf.
Zeng J, He X, Wu D, Zhu B, Cai S, Nadira UA, Jabeen Z, Zhang G:
Comparative transcriptome profiling of two Tibetan wild barley
genotypes in responses to low potassium. PLoS One 2014, 9(6):e100567.
Kopecky D, Martis M, Cihalikova J, Hribova E, Vrana J, Bartos J, Kopecka J,
Cattonaro F, Stoces S, Novak P, Neumann P, Macas J, Simkova H, Studer B,
Asp T, Baird JH, Navratil P, Karafiatova M, Kubalakova M, Safar J, Mayer K,
Dolezel J: Flow sorting and sequencing meadow fescue chromosome 4F.
Plant Physiol 2013, 163(3):1323–1337.
Pfeifer M, Martis M, Asp T, Mayer KF, Lubberstedt T, Byrne S, Frei U, Studer B:
The perennial ryegrass GenomeZipper: targeted use of genome resources
for comparative grass genomics. Plant Physiol 2013, 161(2):571–582.
Hernandez P, Martis M, Dorado G, Pfeifer M, Galvez S, Schaaf S, Jouve N,
Simkova H, Valarik M, Dolezel J, Mayer KF: Next-generation sequencing
and syntenic integration of flow-sorted arms of wheat chromosome 4A
exposes the chromosome structure and gene content. Plant J 2012,
69(3):377–386.
Kugler KG, Siegwart G, Nussbaumer T, Ametz C, Spannagl M, Steiner B,
Lemmens M, Mayer KF, Buerstmayr H, Schweiger W: Quantitative trait
loci-dependent analysis of a gene co-expression network associated with
Fusarium head blight resistance in bread wheat (Triticum aestivum L.).
BMC Genomics 2013, 14:728.
Langfelder P, Horvath S: WGCNA: an R package for weighted correlation
network analysis. BMC Bioinformatics 2008, 9:559.
Brenchley R, Spannagl M, Pfeifer M, Barker GL, D'Amore R, Allen AM,
McKenzie N, Kramer M, Kerhornou A, Bolser D, Kay S, Waite D, Trick M,
Bancroft I, Gu Y, Huo N, Luo MC, Sehgal S, Gill B, Kianian S, Anderson O,
Kersey P, Dvorak J, McCombie WR, Hall A, Mayer KF, Edwards KJ, Bevan MW,
Hall N: Analysis of the bread wheat genome using whole-genome
shotgun sequencing. Nature 2012, 491(7426):705–710.
Cuthbert PA, Somers DJ, Thomas J, Cloutier S, Brule-Babel A: Fine mapping
Fhb1, a major gene controlling fusarium head blight resistance in bread
wheat (Triticum aestivum L.). TAG Theor Appl Genet 2006, 112(8):1465–1472.
Schweiger W, Pasquet JC, Nussbaumer T, Paris MP, Wiesenberger G,
Macadre C, Ametz C, Berthiller F, Lemmens M, Saindrenan P, Mewes HW,
Mayer KF, Dufresne M, Adam G: Functional characterization of two
clusters of Brachypodium distachyon UDP-glycosyltransferases encoding
putative deoxynivalenol detoxification genes. Mol Plant Microbe Interact
2013, 26(7):781–792.
Desjardins AE: Fusarium Mycotoxins: Chemistry, Genetics and Biology. APS
Press; 2006.
Lemmens M, Scholz U, Berthiller F, Dall'Asta C, Koutnik A, Schuhmacher R,
Adam G, Buerstmayr H, Mesterhazy A, Krska R, Ruckenbauer P: The ability to
detoxify the mycotoxin deoxynivalenol colocalizes with a major
quantitative trait locus for Fusarium head blight resistance in wheat.
Mol Plant Microbe Interact 2005, 18(12):1318–1324.
Revanna KV, Munro D, Gao A, Chiu CC, Pathak A, Dong Q: A web-based
multi-genome synteny viewer for customized data. BMC Bioinformatics
2012, 13:190.
Soderlund C, Bomhoff M, Nelson WM: SyMAP v3.4: a turnkey synteny system
with application to plant genomes. Nucleic Acids Res 2011, 39(10):e68.
doi:10.1186/s12870-014-0348-6
Cite this article as: Nussbaumer et al.: chromoWIZ: a web tool to query
and visualize chromosome-anchored genes from cereal and model
genomes. BMC Plant Biology 2014 14:348.