Isolation and functional characterization of a high affinity urea transporter from roots of Zea mays
Bạn đang xem bản rút gọn của tài liệu. Xem và tải ngay bản đầy đủ của tài liệu tại đây (1.86 MB, 15 trang )
Zanin et al. BMC Plant Biology 2014, 14:222
/>
RESEARCH ARTICLE
Open Access
Isolation and functional characterization of a high
affinity urea transporter from roots of Zea mays
Laura Zanin1*, Nicola Tomasi1, Corina Wirdnam2, Stefan Meier2, Nataliya Y Komarova2, Tanja Mimmo3,
Stefano Cesco3, Doris Rentsch2 and Roberto Pinton1
Abstract
Background: Despite its extensive use as a nitrogen fertilizer, the role of urea as a directly accessible nitrogen
source for crop plants is still poorly understood. So far, the physiological and molecular aspects of urea acquisition
have been investigated only in few plant species highlighting the importance of a high-affinity transport system.
With respect to maize, a worldwide-cultivated crop requiring high amounts of nitrogen fertilizer, the mechanisms
involved in the transport of urea have not yet been identified. The aim of the present work was to characterize the
high-affinity urea transport system in maize roots and to identify the high affinity urea transporter.
Results: Kinetic characterization of urea uptake (<300 μM) demonstrated the presence in maize roots of a high-affinity
and saturable transport system; this system is inducible by urea itself showing higher Vmax and Km upon induction. At
molecular level, the ORF sequence coding for the urea transporter, ZmDUR3, was isolated and functionally characterized
using different heterologous systems: a dur3 yeast mutant strain, tobacco protoplasts and a dur3 Arabidopsis mutant.
The expression of the isolated sequence, ZmDUR3-ORF, in dur3 yeast mutant demonstrated the ability of the encoded
protein to mediate urea uptake into cells. The subcellular targeting of DUR3/GFP fusion proteins in tobacco protoplasts
gave results comparable to the localization of the orthologous transporters of Arabidopsis and rice, suggesting a partial
localization at the plasma membrane. Moreover, the overexpression of ZmDUR3 in the atdur3-3 Arabidopsis mutant
showed to complement the phenotype, since different ZmDUR3-overexpressing lines showed either comparable or
enhanced 15[N]-urea influx than wild-type plants. These data provide a clear evidence in planta for a role of
ZmDUR3 in urea acquisition from an extra-radical solution.
Conclusions: This work highlights the capability of maize plants to take up urea via an inducible and high-affinity
transport system. ZmDUR3 is a high-affinity urea transporter mediating the uptake of this molecule into roots. Data
may provide a key to better understand the mechanisms involved in urea acquisition and contribute to deepen the
knowledge on the overall nitrogen-use efficiency in crop plants.
Keywords: Corn, High affinity transport system, DUR3, Maize, Nitrogen (N), Root, Urea
Background
By 2050, the global population is expected to be 50% higher
than at present and global grain demand is projected to
double ( />Issues_papers/HLEF2050_Global_Agriculture.pdf).
Today the productivity of crops is based on the application of high amounts of industrially produced nitrogen
(N) fertilizer, even though crop plants utilize only 30-40%
of the applied N [1]. As a consequence, the wide use of
* Correspondence:
1
Dipartimento di Scienze Agrarie e Ambientali, University of Udine, via delle
Scienze 208, I-33100 Udine, Italy
Full list of author information is available at the end of the article
synthetic N fertilizer has led to negative impacts on the
environment and on farmer economies. In addition, the N
use efficiency (NUE) of cereal crops has declined in the
last 50 years [2].
Based on these considerations, crop yield needs to be
improved in a more cost-effective and eco-compatible
way. This goal could be achieved by increasing the NUE
of cereals and optimizing the acquisition of naturally occurring and applied N. Reducing the amount of fertilizers
in maize culture will have economic and environmental
benefits. In particular combining reduced fertilizer application and breeding plants with better NUE is one of the
main goals of research in plant nutrition [3].
© 2014 Zanin et al.; licensee BioMed Central Ltd. This is an Open Access article distributed under the terms of the Creative
Commons Attribution License ( which permits unrestricted use, distribution, and
reproduction in any medium, provided the original work is properly credited. The Creative Commons Public Domain
Dedication waiver ( applies to the data made available in this article,
unless otherwise stated.
Zanin et al. BMC Plant Biology 2014, 14:222
/>
Urea is the most frequently used N fertilizer in the
world, with annual amounts of over 50 million tons
accounting for more than 50% of the world N-fertilizer
consumption (www.fertilizer.org/Statistics). The great increase in urea-fertilizer use during the last decades is
mainly due to its competitive price and the high N content
(46% of mass), that allow reducing transport and distribution costs [4]. Besides the chemical input as fertilizer, urea
is also a natural organic molecule synthesized by most organisms [5,6]. In plants, urea represents an important
metabolic intermediate produced during N-recycling [6],
while in mammals the urea production is associated with
the detoxification of N compounds [7].
Although urea might be derived from both natural and
chemical syntheses, in the soil it usually occurs only at
micromolar concentrations (less than 10 μM [8-10]).
Also in soils of fertilized crop-plants, the urea concentration is maintained at low levels (up to 70 μM [11]). In
part, this is due to the presence of microbial ureases in
the soil solution, which rapidly hydrolyse urea into carbon dioxide and ammonia. However, low concentrations
of urea could remain in soils also after enzymatic degradation, since the microbial urease activity shows an affinity constant in the millimolar range [12]. As evolutionary
adaptation, plants might have developed strategies to use
this diluted but available N source through high affinity
urea uptake systems [5].
Only few studies have investigated the molecular basis
of urea transporters in higher plants. The first research
was published by Liu et al. [13] reporting the cloning
and characterization of a high affinity urea transporter
of Arabidopsis, called AtDUR3. The coding sequence of
AtDUR3 showed weak homology to an ortholog of
Saccharomyces cerevisiae (ScDUR3), a member of the
sodium-solute symporter (SSS) gene family, which is
widespread in microorganisms, animals, and humans
[14,15]. Members of the SSS family have been described to transport a wide range of solutes, such as
sugars, amino acids, nucleosides, inositols, vitamins,
anions, and urea [14,16,17]. AtDUR3 showed no significant homology to any other protein of Arabidopsis
[13]. Similarly, in the rice genome, OsDUR3 is the only
gene that has significant homology to AtDUR3, suggesting that plant DUR3 proteins might represent a
transporter subfamily consisting of only one member
[18,19]. To date, in higher plants only Arabidopsis and
rice DUR3 have been characterized at the molecular
and physiological level [13,18,19].
The aim of the present work was to identify and functionally characterize the high affinity transport system involved in urea acquisition in maize. To do this, the kinetic
properties of urea uptake in intact maize roots were determined. The putative urea transporter ZmDUR3-ORF was
isolated and its localization analysed using GFP-fusion
Page 2 of 15
proteins; its capability to transport urea was demonstrated
by expression in heterologous systems, i.e. dur3 Saccharomyces cerevisiae and Arabidopsis thaliana mutants.
Results
Urea acquisition in maize plants
To evaluate the capacity of maize roots to take up urea,
a concentration dependent net-influx analysis was performed using 5-day-old plants grown in N-free nutrient
solution. Before the uptake experiment, plants were exposed
for 4 hours to a nutrient solution containing 1 mM urea as
sole N source (urea treatment), or without N (control). Net
uptake rates were determined measuring urea depletion
from assay solutions, containing 2.5 to 300 μM urea
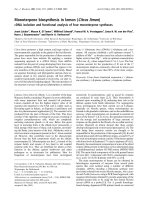
(Figure 1).
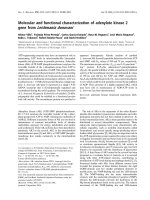
In roots of control plants, the uptake rates of urea
showed a typical saturation kinetic corresponding to the
Michaelis-Menten model (Figure 1a). Interestingly, the
exposure of roots to 1 mM urea before the uptake assay
modified the kinetic parameters (Figure 1b). Indeed the
net urea influx in roots of urea pre-treated plants was
more than 2 fold higher compared to that measured in
control plants, with Vmax values of about 19 and 9 μmol
urea g−1 fresh weight (FW) h−1, respectively. The urea
pre-treatment also affected the affinity, which decreased
in pre-treated plants more than 3.5 times with respect to
control plants (Km about 22 μM and 6 μM, respectively).
In order to independently verify the capacity of maize
plants to acquire urea, 15[N] -labelled urea was supplied in
the nutrient solution. After 24 hours of treatment the accumulation of 15 N was 327.3 (±13.8) mg 100 g−1 dry
weight (DW) in shoots and 421.1 (±18.4) mg 100 g−1 DW
in roots. During the time span of the experiment, no detectable degradation of urea occurred in the nutrient solution (data not shown). In this way considering 15 N-data,
maize plants took up around 25 μmol 100 mg−1 DW of
urea from the external solution.
To investigate the contribution of urea taken up by
roots in terms of intact molecule in the plants, the concentration of urea in roots and shoots of maize plants was
analysed (Additional file 1: Figure S1). After 24 hours
comparable amounts of urea were detected in urea- and
control- treated plants. Nevertheless, the concentrations
of urea within maize tissues, roots or shoots, were significantly different during the time span of the experiment.
After 4 and 8 hours, the urea concentration decreased in
roots and increased in shoots of urea-treated plants. This
modulation in urea content might suggest a translocation
of urea (as intact molecule) even if a higher degradation in
roots and a synthesis in shoots cannot be excluded.
In silico identification of a maize urea transporter
With the aim to identify a high affinity urea transporter
from maize, an in-silico search was performed based on
Zanin et al. BMC Plant Biology 2014, 14:222
/>
Page 3 of 15
Figure 1 Kinetic assay of urea uptake by maize roots. The concentration-dependent uptake was measured using 5-day-old maize plants exposed
for 4 h to a nutrient solution supplied with 1 mM urea as a sole nitrogen source (b) or not (control plants, a). Subsequently roots were incubated for 10
minutes in the assay solution containing urea at different concentrations (2.5-5-10-25-50-100-200-300 μM). Values are means ± SD (n = 3).
sequence similarity with AtDUR3 (At5g45380) using the
BLAST algorithm on the Aramemnon plant membrane
protein database (-koeln.
de/index.ep, ARAMEMNON v. 7.0© [20]). In the maize
genome, only one predicted sequence coding for a DUR3
homolog (putative transcript AC202439.3_FGT006) was
identified on chromosome 6 (113,848,061-113,853,627).
The expression of ZmDUR3 was confirmed by several
EST-sequences present in the Nucleotide EST Database from GenBank (dbEST, .
gov/nucest): BQ164112, BQ164020, FL011289, FL448872,
DV550376, AW400387, BQ163839, BQ163822 and FL011290.
Most ESTs covered the 3′-region of AC202439.3_FGT006
while only FL011289 and FL011290 aligned at the 5′-region.
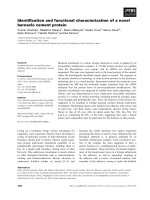
We thus referred to this gene as ZmDUR3 (Figure 2).
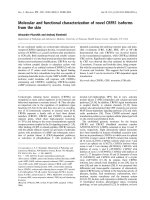
When widening the search only a single predicted
DUR3 ORF was found within each of the plant species analysed. The phylogenetic analysis revealed that
putative DUR3 proteins are closely related among monocots, such as maize, rice, wheat, barley and millet
(Figure 2), with more than 80% identity at the amino
acid level.
Expression pattern of ZmDUR3 in maize tissues
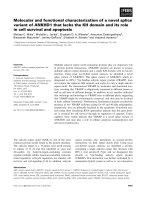
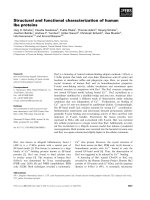
As reported in Figure 3, real time RT-PCR data show
the expression pattern of ZmDUR3 in maize plants up
to 4 hours of root exposure to urea. The highest gene
expression level of ZmDUR3 was reached in roots while
in leaves the transcript amount was at least an order of
magnitude lower.
Up to 4 hours of urea treatment, the presence of the
nitrogen source in the external solution induced a significant down regulation of the gene expression. On the
other hand, in urea and control leaves the expression
levels were comparable and not significantly influenced
by the treatment.
The coding sequence of ZmDUR3 was isolated from maize
root mRNA
Using gene specific primers, a transcript from maize
root was amplified by RT-Assembly-PCR and cloned
into the yeast expression vector pDR197 [21]. The sequencing results showed an open reading frame of 2196bp, ZmDUR3-ORF [GenBank: KJ652242], coding for 731
amino acids. The alignment with the genomic sequence
(AC202439.3_FG006) revealed four exon regions of 192,
108, 663 and 1233 bp. The length and the location of the
exons were different from those predicted (Additional file 2:
Figure S2). In addition, in comparison to the predicted
cDNA (AC202439.3_FGT006), the isolated ZmDUR3-ORF
contained three non-synonymous substitutions in the nucleotide sequence, modifying the following amino acids:
K149N; A167V; Q559H. The nucleotide responsible for the
Q559H modification was also detected in a maize EST
Zanin et al. BMC Plant Biology 2014, 14:222
/>
Page 4 of 15
Figure 2 Phylogenetic tree of DUR3 urea transporters. A phylogentic analyses was performed using the DUR3 amino acid sequences of
Saccharomyces cerevisiae (Sc, AAA34582), Zea mays (Zm, KJ652242), Oryza sativa (Os, NP_001065513), Arabidopsis thaliana (At, NP_199351)
and putative DUR3 orthologs from Aegilops tauschii (Aegt, EMT22254), Triticum urartu (Tu, EMS63712.1), Hordeum vulgare (Hv, BAJ94433.1),
Brachypodium distachyon (Bd, XP_003571687), Setaria italica (Si, XP_004965066), Sorghum bicolor (Sb, XP_002438118), Cucumis sativus (Cs,
XP_004146194.1), Vitis vinifera (Vv, XP_002263043), Populus trichocarpa (Pt, XP 002303472.1), Solanum lycopersicum (Sl, XP_004245999), Prunus
persica (Pp, EMJ11521.1), Medicago truncatula (Mt, XP_003612583), Glycine max (Gm, XP_003523904). The tree was constructed by aligning
the protein sequences by Clustal-W and the evolutionary history was inferred using the Neighbor-Joining method. The percentage of
replicate trees in which the associated taxa clustered together in the bootstrap test (1000 replicates) are shown next to the branches. The
tree is drawn to scale, with branch lengths in the same units as those of the evolutionary distances used to infer the phylogenetic tree. The
evolutionary distances were computed using the Poisson correction method and are in the units of the number of amino acid substitutions
per site.
sequence (BQ164112). The region containing the other two
substitutions was not covered by ESTs. However, the presence of asparagine (N) and histidine (H) instead of lysine
(K) and glutamine (Q), respectively, was also found in the
amino-acid sequence of rice OsDUR3 [19].
Blast analysis revealed that the ZmDUR3 cDNA had
a high similarity with OsDUR3 (84% nucleotide sequence identity with a 94% of query coverage). Similar
percentages were also observed at amino acid level
with an identity of 83 and 75% to OsDUR3 and
AtDUR3, respectively (Additional file 3: Figure S3).
ZmDUR3 comprises 731 amino acids containing fifteen
predicted transmembrane spanning domains (TMSDs)
with outside orientation of the N-terminus (prediction
performed by TOPCONS, and
confirmed by TMHMM 2.0, />services/TMHMM/). The comparison between ZmDUR3
and the rice ortholog OsDUR3 (721 amino acids) revealed
a similar predicted topology (Additional file 4: Figure S4), especially with respect to the number of TMSDs, and N- and
C-terminus orientation.
Functional characterization of ZmDUR3
The functional characterization was performed using different approaches in heterologous systems: i) functional
complementation of a Saccharomyces cerevisiae dur3
Zanin et al. BMC Plant Biology 2014, 14:222
/>
Figure 3 Transcriptional analyses of ZmDUR3 in root and
shoots of maize in response to urea treatment. 5 day-old plants
were exposed for a maximum of 4 hours to nutrient solution without
addition of any N source (Control plants) or supplied with 1 mM urea
(Urea treated plants). Gene mRNA levels were normalized with respect
to the mean transcript level of the housekeeping gene ZmRPS4; relative
changes in gene transcript levels were calculated on the basis of the
mean transcript level of ZmRPS4 in roots of Control plants at 0 hour
(Relative gene expression = 1). Values are means ± SD of three
independent experiments (ANOVA, Student-Newman-Keuls, P < 0.05,
n = 3). Capital letters are referred to the statistical differences in the
roots, while lower letters are referred to shoots.
mutant, ii) subcellular localization of ZmDUR3/GFP
(Green Fluorescent Protein) fusion proteins in Nicotiana
tabacum protoplasts and iii) 35sCaMV:: ZmDUR3
overexpression in the atdur3 mutant line of Arabidopsis
thaliana.
Page 5 of 15
In order to verify the ability to transport urea, the
ZmDUR3-ORF was expressed in a dur3-mutant strain of
S. cerevisiae, as described previously by Liu et al. [13].
The mutant YNVWI (Δura3, Δdur3) is defective in urea
uptake and cannot grow on less than 5 mM urea as sole
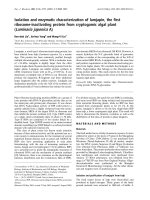
N source [13]. Results showed that the dur3 mutant
strain transformed with the vector pDR197 barely grew
on a medium containing 1, 2 or 3 mM urea. On the
other hand, the heterologous expression of ZmDUR3ORF enabled YNVWI to grow well on urea medium
(Figure 4). Moreover, since ZmDUR3 has a high GCcontent (around 80% GC content in the first 100 bp),
the level of heterologous expression in other organisms
may be limited. So, to reduce the GC content and
favour the expression of ZmDUR3, 48 nucleotides in
the first 216 nt of ZmDUR3 were modified. These
modifications are all synonymous substitutions occurring only at nucleotide level (as specified in the Methods).
A great improvement in the yeast growth on urea medium
was observed transforming YNVWI with a modified
version of ZmDUR3-ORF (called ZmDUR3mod-ORF,
Figure 4).
The YNVWI mutant expressing ZmDUR3-ORFs (ZmDUR3and ZmDUR3mod-transformants) did not show any apparent growth difference on medium supplemented with
0.5% ammonium sulphate, as N source. When grown on
selective plates supplemented with urea as a sole N source,
growth differences between ZmDUR3- and ZmDUR3modtransformants became apparent. In particular, the size of
the colonies of ZmDUR3mod-transformants was larger in
comparison to those of the native ZmDUR3-ORF, and this
Figure 4 ZmDUR3 mediates urea uptake in S. cerevisiae. Growth of the urea uptake-deficient strain YNVW1 expressing ZmDUR3 and ZmDUR3mod.
The mutant YNVW1 transformed with the vector pDR197 (first row), and pDR197 carrying ORFs ZmDUR3 (middle row) or ZmDUR3mod (third row).
Medium contained 0.5% of ammonium sulphate (SD) or urea at three different concentrations (1, 2 or 3 mM urea) as a sole nitrogen source. Pictures
were taken after 5 days of incubation.
Zanin et al. BMC Plant Biology 2014, 14:222
/>
different growth was visible for all urea concentrations
tested.
Transient expression of ZmDUR3/GFP fusion proteins in
tobacco protoplasts
Functional complementation of the yeast mutant YNVWI
by ZmDUR3 indicated that at least in a heterologous
system the transporter is localized at the plasma membrane. To confirm this subcellular localization, N- and
C-terminal fusion proteins of ZmDUR3 and GFP (Green
Fluorescent Protein) were transiently expressed in tobacco
(N. tabacum) protoplasts (Figure 5a,b). Tobacco protoplasts were also transformed with AtPTR1-YFP [22] or
with free GFP, which were used as plasma membrane and
cytosolic control, respectively (Figure 5).
In free-GFP expressing protoplasts the fluorescent
signal was localized in the cytoplasm (Figure 5c). In
protoplasts expressing ZmDUR3-GFP (Figure 5a) and
GFP-ZmDUR3 (Figure 5b) plasma membrane localization
could not be unequivocally demonstrated, since the green
fluorescence was mostly confined to internal membranes.
The functionality of ZmDUR3mod/GFP constructs was
verified in dur3-yeast mutant.
Page 6 of 15
Overexpression of ZmDUR3 in Arabidopsis mutant line
atdur3-3
In order to test the activity of ZmDUR3 in planta,
ZmDUR3mod was overexpressed in a dur3 mutant line of
Arabidopsis. The atdur3-3 mutant is defective in the endogenous urea transporter AtDUR3 and showed impaired growth on a medium with urea (<5 mM) as sole
N source [18]. In particular the mutant line showed a
slow development and chlorotic leaves at 0.5 and 1 mM
urea [18], suggesting a condition of N deficiency.
Three independent 35sCaMV: ZmDUR3mod-overexpressing lines were tested: line-A, line-B and line-C.
Plants were grown for 16 days on sterile half strength
MS medium without any additional N, or supplemented
with urea at three different concentrations (0.5, 1.0 or
3.0 mM urea) or 0.5 mM ammonium nitrate. The complementation assay demonstrated that in all three overexpression lines the capacity to grow on a medium
supplemented with 0.5 mM and 1 mM urea was restored (Figure 6a). On agar plates without N supply, all
plants showed a poor development of shoots and roots
and symptoms of N deficiency appeared. On medium
containing 0.5 mM urea, wild type shoots developed
Figure 5 Localization of ZmDUR3/GFP fusion proteins in tobacco protoplast. (a) Co-localization of ZmDUR3-GFP and plasma membrane localized AtPTR1-YFP, (b) GFP-ZmDUR3 and AtPTR1-YFP, and (c) free GFP. Fluorescence was detected using a confocal laser-scanning microscope:
bright-field images (first column), chlorophyll fluorescence (red signal, second column), GFP-fluorescence (green signal, third column); YFP-fluorescence
(purple signal, as control for plasma membrane localization, fourth column) are shown. In the last column, merged images show chlorophyll fluorescence
(red), GFP-fluorescence (green) and YFP-fluorescence (purple). Diameter of protoplasts was approximately 40 μm.
Zanin et al. BMC Plant Biology 2014, 14:222
/>
Page 7 of 15
Figure 6 Growth of ZmDUR3mod-expressed in the dur3-3 Arabidopsis mutant. The Arabidopsis dur3 mutant, atdur3-3 [18], was transformed
with ZmDUR3mod-ORF under the control of the CaMV 35S-promoter. (a) Growth of the wild type Col-0 (WT), atdur3-3 mutant line and three
ZmDUR3mod-overexpressing lines (atdur3-3 + ZmDUR3-A, −B, −C) on sterile half strength MS medium supplied with 1 μM NiCl2 and 50 μM NO−3
and different concentrations of urea or 0.5 mM ammonium nitrate (AN) as a sole N source. (b) Effect of urea treatment on root morphology in
Arabidopsis plants grown with 0.5 mM urea. Plants were grown for 16 days on nutrient agar-medium.
slightly better than dur3 shoots, as previously described
by Kojima et al. [18]. At 0.5 mM urea, the ZmDUR3modoverexpressing lines grew better than wild type plants with
a good development of shoots and with a higher root proliferation (Figure 6b). It is interesting to note that on agar
plates supplemented with 0.5 mM urea, overexpression
lines showed a higher biomass production with a significantly higher fresh weights than wild type or atdur3-3
mutant plants (Figure 7). No detectable differences were
observed among all Arabidopsis lines tested when plants
were grown on 3 mM urea or on 0.5 mM ammonium nitrate (Figure 6a).
Phenotyping results were validated by 15[N]-urea influx assay using 6-weeks-old Arabidopsis plants. Col-0,
atdur3-3 and atdur3-3 + ZmDUR3-A, −B, −C overexpression lines were grown in hydroponic culture in a
complete nutrient solution containing 1 mM ammonium
nitrate for 38 days before being transferred for 4 days in a
N-free nutrient solution. At the time of the experiment,
no phenotypical differences in root architectures were
visible between different Arabidopsis lines under these
growth conditions. When 100 μM 15[N]-urea was supplied to roots, all three ZmDUR3-overexpressing lines
were able to take up urea, restoring the wild-type
transport rates (Figure 8). In particular, the highest
urea uptake rates were found in line B of the atdur33 + ZmDUR3 overexpression line, while line -A and -C
showed levels of urea uptake comparable to those in wild
type plants.
Discussion
Although urea is the most used N fertilizer worldwide,
little is known on the capacity of crop plants to use urea
per se as an N source. Maize is one of the crops supplied
with huge amount of urea fertilizers and it is known that
urea sustains N nutrition. However, it is not clear how
much urea is directly taken up [23]. Therefore in this
work, the high affinity urea uptake by maize roots was
Zanin et al. BMC Plant Biology 2014, 14:222
/>
Page 8 of 15
Figure 7 Effect of urea treatment on biomass production of Arabidopsis plants grown on 0.5 mM urea. Arabidopsis plants were grown on
sterile half strength MS medium supplemented with 1 μM NiCl2 and 50 μM NO−3 plus 0.5 mM urea as sole N sources (same growth conditions
described for Figure 6b). The fresh weights of 14 plants were measured after 16 days. Data are mean ±SD of three independent experiments and
different letters above the bars indicate statistically significant differences (ANOVA, Student-Newman-Keuls, P < 0.05, n=3).
characterized and a high affinity urea transporter (ZmDUR3)
identified and functionally characterized.
Among higher plants, the kinetic characterization of
urea uptake was previously described only in Arabidopsis and rice [18,19]. In the present work, intact maize
roots exposed to urea up to 300 μM, showed saturable
kinetics of urea transport fitting into the MichaelisMenten model (Figure 1). This behaviour is compatible
with the presence of a high-affinity transport system for
urea in maize roots, with kinetic features similar to those
already characterized in other higher plants [18,19].
The kinetic assay in maize roots revealed an important
aspect of urea uptake that has not been previously described in higher plants. Data showed that when maize
plants were supplied with 1 mM urea for 4 hours, the affinity and capacity to take up this N source in the highaffinity concentration range (2.5-300 μM) increased in
comparison to plants without urea pre-treatment (Figure 1).
Thus, urea pre-treatment increases its own uptake, causing
a modification of the kinetic parameters, which is very
similar to the well-described physiological induction by
substrate of the inducible high-affinity-nitrate transport
system (iHATS) [24].
On the other hand, concerning the low-affinity transport
system, the up-regulation of urea uptake by pre-treatment
with urea was previously reported in Arabidopsis [25]. Results were inferred from influx assays performed by exposing plants to a high concentration of urea, 10 mM 15 N-urea
(corresponding to 20 mM total N). The influx capacity of
urea-fed plants (>300 μmol urea g−1 DW h−1) was higher
than in N-starved plants or plants fed with ammonium nitrate or ammonium nitrate plus urea, which showed values
around 200 μmol urea g−1 DW h−1. Thus, these data suggest
that in Arabidopsis [25] and maize (Figure 1), roots are able
to induce urea uptake when urea is available in the external
medium. Moreover, as observed in the present work, the induction of HATS in maize roots might reflect an efficient
response of plants by increasing the capacity of urea acquisition especially when this N source occurs at micromolar
levels in the soil solution. Although after 24 hours high
amount of external urea are taken up by the roots, the total
concentration of urea as an intact molecule within maize
plants did not increase (Additional file 1: Figure S1). So, the
urea treatment seemed to have no effect on urea content in
maize, similar results were also reported by Mérigout et al.
[23]. This result may be explained by the high activity of the
cytosolic urease enzyme, ubiquitously present in plant tissues, which has been shown to efficiently hydrolyse urea
within the plant tissues [26]. Nevertheless, data here presented showed a transient modulation of urea content
Zanin et al. BMC Plant Biology 2014, 14:222
/>
Page 9 of 15
Figure 8 15[N]-urea influx in Arabidopsis plants. Urea uptake into roots was determined using 6-weeks-old plants of wild type Col-0 (WT),
atdur3-3 mutant line and three ZmDUR3mod-transformed lines (atdur3-3 + ZmDUR3-A, −B, −C) grown in a complete nutrient solution containing
nitrogen as 1 mM ammonium nitrate. 4 days before the experiment, plants were transferred to N-free medium. For the assay, 100 μM 15[N]-urea
was supplied to the medium for 15 min. Data are mean ±SD of three independent experiments and different letters above the bars indicate
statistically significant differences (ANOVA, Student-Newman-Keuls, P < 0.05, n=3).
within the tissues suggesting a translocation of urea from
roots to shoots.
Among higher plants, urea transporters have been
identified only as orthologs of ScDUR3, an urea transporter of S. cerevisiae. Up to date, only AtDUR3 and
OsDUR3, of Arabidopsis and rice, respectively have
been functionally characterized, while in other monocots and dicots putative DUR3-orthologs were predicted by bioinformatics (Figure 2). In Arabidopsis,
AtDUR3 has been described to be a major component
of the high-affinity transport system, suggesting that
also in other plants, the DUR3-orthologs might play a
crucial role in urea acquisition. The expression level of
DUR3 orthologs has been shown to be increased by
the nitrogen deficiency in Arabidopsis and rice plants
[18,19]. As reported for the orthologous gene in rice
[19], the expression level of ZmDUR3 coding for the
putative urea transporter in maize is different among
the tissues (Figure 3). The higher expression of the gene
coding for DUR3 in the radical tissue might reflect its involvement in the mechanisms of urea acquisition from the
root external medium. Roots of N-deficient plants treated
with nitrogen sources exhibits divergent expression level
of DUR3 orthologs: in rice, OsDUR3 is weakly induced
after 3 hours of treatments with 1 mM urea [19], in Arabidopsis, 1 mM urea represses AtDUR3 expression at 3 and
6 hours and induced it at 9 and 24 hours [18]. In maize
plants, during the timespan when 1 mM urea induced an
increase in the root capacity to take up urea, the expression level was decreasing (Figure 3) similarly to the variations found by Kojima et al. [18]. Therefore in the short
term, the modulation in the root capacity to take up urea
is not related to changes in the expression level of the
gene ZmDUR3, suggesting the involvement of regulation
mechanisms that do not operate at transcriptional level.
Expression of ZmDUR3 in a dur3-S. cerevisiae mutant
demonstrated a functional urea transport (Figure 4). As
ZmDUR3-transformants grew very slowly, a ZmDUR3ORF was prepared with a lower GC content and therefore
an optimized codon usage for S. cerevisiae. Therefore in
the first part (10%) of the ORF, G and C in the third codon
position were replaced with A or T generating codons
which are more frequently used in yeast. Interestingly the
ZmDUR3mod-transformants grew slightly faster than yeast
mutants transformed with the unmodified ZmDUR3-ORF
(Figure 4). Since the two constructs differed only at
Zanin et al. BMC Plant Biology 2014, 14:222
/>
nucleotide level, the slow growth rate of ZmDUR3ORF-expressing cells might be the consequence of a
lower accumulation of ZmDUR3 protein possibly deriving
from a lower transcription/translation of the native maize
transgene in comparison to the ZmDUR3mod-transformed
yeast.
These results highlight that especially for plant species
with a high GC content, the ORF-optimization strategy
may be a valid method to improve the expression of
transgenes in heterologous systems like yeast or also in
other model organisms allowing an easier molecular
characterization of plant proteins.
The yeast complementation assay demonstrated that
ZmDUR3 can mediate urea uptake from the external
medium into the cells. With the aim to clarify the subcellular localization of ZmDUR3, tobacco protoplasts were
transiently transformed with ZmDUR3mod-ORF fused
with GFP. Results showed that the fluorescent signal
was mostly detected in internal membranes (Figure 5),
although the localization of a minor fraction of ZmDUR3GFP on plasma membrane would be compatible with the
observed signal. These localization results are comparable
to those previously reported in Arabidopsis protoplasts for
the orthologs of rice and Arabidopsis, OsDUR3 and
AtDUR3 [19]. For these proteins, the fluorescent signals
were not uniformly distributed at the periphery of protoplasts, indicating that the protein might be localized
not only at the plasma membrane, but also in internal
membranes.
Besides GFP-localization, further experimental evidences
suggested that DUR3 might not exclusively be targeted
to the plasma membrane. In particular, for AtDUR3
the plasma membrane localization in Arabidopsis root
cells was previously described by two immunological
approaches. Kojima et al. [18] used polyclonal antibodies
against AtDUR3 in two independent analyses: a protein
gel-blot analysis of membrane-protein fraction from
Arabidopsis roots and an immunohistochemical assay
on whole-mount root samples. Both immunological
techniques gave the same results: although AtDUR3 localized at the plasma membrane, a fraction of the protein appeared to be localized in the cytoplasm. The authors
suggested that a fraction of AtDUR3 might reside in endomembrane compartments, reflecting proteins that were
moving to or from the plasma membrane [18].
Interestingly, in root cells, the subcellular-localization
of another high affinity transporter (Arabidopsis IronRegulated Transporter 1, IRT1) was found to be mainly
localized in the early endosomes [27] while at the plasma
membrane the abundance of IRT1 was low and tightly
regulated by an ubiquitin-dependent trafficking and
turnover. The turnover of the IRT1 protein was investigated and the localization of IRT1 was explained by the
authors as a result of a “rapid endocytosis and slower
Page 10 of 15
recycling to the plasma membrane, where it likely performs iron uptake from the soil, and is addressed to the
lytic vacuole for turnover” [27]. The authors concluded
that the internal traffic controls the amounts of IRT1
protein at the plasma membrane and therefore participates in the tight regulation of the nutrient uptake.
These considerations about IRT1 suggest that the presence of ZmDUR3 in internal membranes may reflect a
similar situation where the abundance of the protein at
the plasma membrane is under control of a trafficking/
recycling pathway. This hypothesis is further supported
by the fact that the higher root uptake capacity of urea
(Figure 1) was not accompanied by an overexpression of
ZmDUR3 (Figure 3).
To provide more detailed assessment of the molecular
and physiological role of this maize transporter in
planta, the overexpression of ZmDUR3mod in a dur3
mutant line of Arabidopsis was performed. All three
overexpression lines were able to phenotypically recover
the dur3-mutant (Figure 6a) and produced significantly
higher plant biomass and root proliferation than dur3
mutant and wild type (Figure 6a,b; Figure 7). This result
might reflect a possible overexpression of the transgene
in all the tissues of lines A, B and C, determining an improvement on the utilization of urea (translocation, allocation, redistribution) within the plants.
In short term 100 μM 15[N]-urea influx experiment
(Figure 8), all three lines complement the mutant phenotype, reaching the highest uptake rates in line B. The differences in the uptake rates might be due to a different
expression level of the transgene ZmDUR3 in the three
independent lines.
Moreover the influx experiment was performed at a micromolar concentration suggesting the capacity of ZmDUR3
to operate in the high affinity range. In conclusion, these evidences demonstrated the complementation of the mutant
phenotype by ZmDUR3 and confirmed the physiological
role of this protein as a high-affinity transporter of urea from
soil into plants.
Conclusions
For the first time, we report a physiological characterization
of urea uptake in roots of intact maize plants. Results
indicated that at micromolar urea concentrations (up
to 300 μM urea), maize roots are able to take up this N
source using a high affinity transport system characterized by saturable kinetics. Moreover, the pre-treatment
of plants with urea increases their capacity to take up
urea, showing that high-affinity uptake of urea is inducible by the substrate.
The capability of the identified ZmDUR3 to phenotypically complement dur3 yeast and Arabidopsis mutants
further demonstrates that ZmDUR3 encodes a highaffinity urea uptake system in maize.
Zanin et al. BMC Plant Biology 2014, 14:222
/>
Methods
Maize growth conditions
Maize seeds (Zea mays L., cv. PR33T56, Pioneer Hi-bred
Italia S.p.A., Parma, Italy) were germinated on a plastic
net placed at the surface of an aerated 0.5 mM CaSO4
solution in a growth chamber at 25°C in the dark. After
3 days, the seedlings were transferred into an aerated
hydroponic system containing 0.5 mM CaSO4 under
controlled climatic conditions: day/night photoperiod,
16/8 h; light intensity, 220 μmol m−2 s−1; temperature
(day/night) 25/20°C; relative humidity 70 to 80%. After
2 days (5-days-old) plants were transferred for a maximum of 24 h in a N-free nutrient solution containing
(μM): KCl 5; CaSO4 500; MgSO4 100; KH2PO4 175;
NaFe-EDTA 20; H3BO3 2.5; MnSO4 0.2; ZnSO4 0.2;
CuSO4 0.05; Na2MoO4 0.05. N was supplied in the form
of 1 mM CO (NH2)2 (urea-treated plants); or as control,
plants were exposed to a N-free nutrient solution (control-plants). The pH of solution was adjusted to pH 6.0
with potassium hydroxide (KOH).
For the experiments of 15[N]-urea acquisition, ureatreated plants were exposed to nutrient solution containing 1 mM 15[N]-urea (98 atom% 15[N]; ISOTEC® Stable
Isotopes, Sigma Aldrich, Milano, Italy).
Measurement of net high-affinity urea uptake in maize
plants
After 4 hours from the beginning of the N-treatment,
roots of intact seedlings were immersed for 10 min, a time
span during which uptake remained linear, in 40 ml of a
constantly stirred and aerated solution containing 500 μM
CaSO4 and up to 300 μM urea (2.5, 5, 10, 25, 50, 100, 200
or 300 μM urea). For each urea concentration, the uptake
rates were determined using six urea-treated and six
control-plants. Net uptake rate was measured as urea depletion from the solution per unit of time. Thus, samples
of the solution (60 μl) were taken every 2 min and the
urea content was determined by diacetylmonoxime and
thiosemicarbazide colorimetric assay (modified from
Killingsbaeck [28]). Therefore a 60 μl aliquot was mixed
thoroughly with 120 μl of colour development reagent,
which consisted of 1:1 mixed colour reagent [7% (v/v)
0.2 M diacetylmonoxime; 7% (v/v) 0.05 M thiosemicarbazide]: mixed acid reagent [20% (v/v) sulphuric acid
(H2SO4); 0.06% (v/v) 74 mM ferric chloride hexahydrate
in 9% (v/v) ortho-phosphoric acid]. The samples were
incubated for 15 min at 99°C (lid temperature: 105°C) in
a thermocycler. The samples were cooled 5 min on ice
and the urea concentration was determined spectrophotometrically by measuring the absorbance at
540 nm using a microtiter plate reader. The uptake
rates were expressed as μmol urea g−1 root FW h−1.
Kinetic parameters of the high-affinity urea uptake system (Vmax and Km) were calculated in the 2.5-300 μM
Page 11 of 15
concentration range by NonLinear Regression-Global
Curve Fitting and the statistical analysis was performed
by Normality Test (Shapiro-Wilk) using SigmaPlot 12.0
(Systat software, Point Richmond, USA).
Determination of urea concentration
Root and leaf urea concentrations were measured in
time-course (up to 24 hours of treatment) by colorimetric assay as described above (modified from Killingsbaeck [28]). Approximately 100 mg (fresh weight) of
freeze plant tissues were milled and suspended in 1 ml
of water at 99°C for 3 min. After centrifugation at
15000 g for 2 min, 60 μl of supernatant were incubated
with 120 μl of colour-development reagent as previously
described. Kojima et al. [18] reported that ureides allantoin, ornithine, arginine and uric acid did not interfere
with the urea determination by diacetylmonoxime and
thiosemicarbazide.
15
[N]-analysis
Approximately 1 mg of dried root and leaf tissues was
transferred into a tin capsule for measurement of δ15N
in one run. The analysis was carried out using a Delta V
isotope ratio mass spectrometer (Thermo Scientific, Bremen, Germany) equipped with a Flash EA 1112 Elemental Analyser (Thermo Scientific, Bremen, Germany). The
isotope ratios were expressed in δ ‰ versus air for δ15N
according to the following formula: δ ‰ = [(Rsample–
Rstandard)/Rstandard]⋅ 1000 where Rsample is the isotope ratio measured for the sample and Rstandard is the isotope
ratio of the international standard. R is the abundance
ratio of the minor, heavier isotope of the element to the
major, lighter isotope, as 15 N/14 N. The isotope values
were calculated against international reference materials:
L-glutamic acid USGS 41, ammonium sulphate IAEAN-2 (IAEA-International Atomic Energy Agency, Vienna,
Austria) and urea 33802174IVA (IVA Analysentechnik
e.k.). The uncertainty of the nitrogen isotopic determination was ± 0.3‰.
Molecular work
RNA extraction
Total RNA was isolated from roots and leaves of maize
plants. The RNA extractions were performed using the
Invisorb Spin Plant RNA kit (Stratec Molecular, Berlin,
Germany) as reported in the manufacturer’s instructions
( The integrity of RNA was qualitatively checked on a 1% agarose gel and quantified by
spectrophotometer Nanodrop 2000 instrument (Thermo
Scientific, Wilmington, USA).
Real-time RT-PCR experiments
One μg of total RNA was retrotranscribed in cDNA using
Oligo-dT23 and the Superscript II Reverse Transcriptase
Zanin et al. BMC Plant Biology 2014, 14:222
/>
(Gibco BRL, Basel, Switzerland), a RNase H derivative of
moloney murine leukemia virus, according to the manufacturer’s protocol. After RNA digestion with 1 U RNase
A (USB, Cleveland, USA) for 1 h at 37°C, gene expression
analyses were performed by adding 0.16 μl of the cDNA
to the real-time RT-PCR complete mix, FluoCycle™ sybr
green (20 μl final volume; Euroclone, Pero, Italy), in a
DNA Engine Opticon Real Time PCR Detection (Biorad,
Hercules, USA).
Based on a ZmDUR3-EST sequence (BQ164112), specific primers (Tm = 58°C) were designed to generate
109 bp PCR product: CCTCAATCTGGTGGGTGTCT
and ATTGGCCTTTCTCCACAGC (PCR efficiency 81%).
Real-time RT-PCR analyses were performed in triplicates
on three independent experiments. The analyses of
real-time result were performed using Opticon Monitor 2 software (Biorad) and R (version 2.9.0; http://
www.r-project.org/) with the qPCR package (version
1.1-8; [29]). Efficiencies of amplification were calculated following the authors’ indications [29]. Data were
normalized with respect to the transcript level of the
housekeeping gene (ZmRPS4, AF013487, GCAACGTTG
TCATGGTGACT and CTCCACGTGAATGGTCTCAA,
PCR efficiency 86%) using the 2-ΔΔCT method, where
ΔΔCT = (CT,Target − CT,HK)Time x − (CT,Target − CT,HK)Time 0 [30].
ZmDUR3-ORF cloning
In order to clone ZmDUR3-ORF, two reverse transcription reactions (RT-reaction) were performed, one reaction
was transcribed using Oligo-dT23 while in the other reaction a specific primer for the ZmDUR3-ORF was used
(2 μM; reverse 5′-CAGGAATGAGGTGAAGAGCGCG
AAGAAGGCGC-3′). For each reaction, 2 μg of total RNA
were reverse transcribed.
Since the first 200 bp of the predicted ORF sequence
were high in GC%, the ZmDUR3-ORF was amplified in
two separate PCR-reactions; i.e. generating two fragments
with an overlap of 20 bp, which were subsequently assembled using Assembly-PCR. The 5′-fragment (192 bp) covered the first part of the ORF sequence (from +1 to
+192 bp) and was amplified from cDNA obtained with
the ZmDUR3-specific primer (50 ng as template of PCR
reaction). The 3′-fragment (2024 bp) covered most of the
remaining ORF sequence (from +172 up to +2196) and
was amplified using cDNA obtained with oligo-dT23
(100 ng as template of PCR reaction).
All PCR reactions were performed in a 50 μL reaction
volume containing 5 × GC Buffer for Phusion® HighFidelity DNA Polymerase, 0.2 mM ATP, 0.2 mM TTP,
0.3 mM GTP, 0.3 mM CTP, 0.4 μM forward primer,
0.4 μM reverse primer, 2 U Phusion® High-Fidelity DNA
Polymerase (New England Biolabs (UK) Ltd., Hitchin,
United Kingdom) following the temperature protocol:
98°C for 30 s; 98°C for 10 s, 58 - 68°C for 30 s, 72°C for
Page 12 of 15
30 s to 2 min, 35 cycles; 72°C for 10 min. The 5′-fragment
was amplified using 5′-CGGAATTCATGGCCGCTGGC
GGCGCCGGC-3′ as forward primer and 5′-CAGGAAT
GAGGTGAAGAGCGCGAAGAAGGCGC-3′ as reverse
primer (Tm = 68°C, elongation at 72°C for 30 s). The
3′-fragment was amplified using 5′-TTCTTCGCGC
TCTTCACCTC-3′ as forward primer and 5′-CGCGG
ATCCTTAAGCTAGCGAAAGATTATCTTCATC-3′ as
reverse primer (Tm = 58°C, elongation at 72°C for
2 min). The 5′- and 3′-fragments of the ZmDUR3ORF were assembled using the approach of Assembly
PCR. The PCR reaction was carried out with 10 ng
5′-fragment and 10 ng 3′-fragment, as template; using
5′-CGGAATTCATGGCCGCTGGCGGCGCCGGC-3′ as
forward primer and 5′-CGCGGATCCTTAAGCTAGCG
AAAGATTATCTTCATC-as reverse primer (Tm = 62°C,
elongation at 72°C for 1 min 30 s). The full-length
ZmDUR3-ORF [GenBank: KJ652242] was amplified and
cloned into the S. cerevisiae expression vector pDR197
[21] using the restriction sites for EcoRI and BamHI. The
nucleotide sequence was verified by sequencing.
ZmDUR3mod-ORF cloning
In order to reduce the GC content and to facilitate the expression of ZmDUR3 in heterologous organisms, 48 nucleotides in the first 216 nt of ZmDUR3 were modified.
These modifications are all synonymous substitutions
occurring only at the third base of the codons (the codonusage preference in yeast was chosen as described by
This modified ZmDUR3,
called ZmDUR3mod [GenBank: KJ652243], differs from the
ZmDUR3 only at nucleotide level, while the encoded amino
acids remain unchanged (Additional file 5: Figure S5).
The modified region was obtained by assembling two
primers, Assembly-1 Primer (5′-GGAATTCATGGCTG
CTGGTGGTGCTGGTGCTTGTCCTCCACCAGGTCT
AGGTTTTGGTGGTGAATATTATTCTGTTGTTGAT
GGTGCTTGTAGTCGTGATGG -3′) and Assembly-2
Primer (5′-GGTGCTTGTAGTCGTGATGGTAGCTTT
TTTGGCGGTAAACCAGTTCTAGCTCAAGCTGTT
GGTTATGCTGTCGTTCTTGGTTTTGGTGCTTTC
TTCGCGCTCTTCACCTC-3′), which were synthetized in vitro (Microsynth AG, Balgach, Switzerland).
Two consecutive Assembly PCR reactions were performed to add the long primers to the 3′-fragment.
In the first PCR reaction, 10 ng of 3′-fragment were used
as template, while Assembly-2 Primer and 3′-fragment
were assembled by PCR, i.e. 10 ng of 3′-fragment
were used as template; while Assembly-2 Primer and
5′-CGCGGATCCTTAAGCTAGCGAAAGATTATCT
TCATC-3′ were used as forward and reverse primers, respectively (Tm = 62°C elongation at 72°C for 1 min 30 s).
10 ng of purified PCR product were used as template for
the consecutive PCR with forward and reverse primers:
Zanin et al. BMC Plant Biology 2014, 14:222
/>
Assembly-1 Primer and 5′-CGCGGATCCTTAAGCTAGC
GAAAGATTATCTTCATC-3′ (Tm = 62°C, elongation at
72°C for 1 min 30 s).
Using the restriction sites EcoRI and BamHI, the fulllength ZmDUR3mod-ORF was cloned into vector pDR197
[21] and sequenced.
Although the optimization of codon usage in ZmDUR3mod was developed for a better expression in yeast, the
modified sequence was also used to perform the functional characterization of DUR3 in tobacco protoplasts
and A. thaliana, since also in these latter organisms a high
GC content might interfere with the translation of the
transcripts.
Expression in Saccharomyces cerevisiae
S. cerevisiae strain YNVWI (Δura3, Δdur3 [13]) was transformed with vector pDR197 (negative control) or plasmids
harbouring the ORF sequences (pDR197-ZmDUR3 and
pDR197-ZmDUR3mod) as described by Liu et al. [13].
Transformants were first selected on synthetic dextrose
minimal medium [31] with Oxoid agar (Difco, Detroit,
USA) [32]. Single colonies were tested on urea (1, 2 or
3 mM) or ammonium sulphate (0.5% w/v) as sole N
source. The pH of the medium was adjusted with 1 M
KOH (pH 5.6). The cells were grown for 2–3 days at 28°C.
Protein localization in Nicotiana tabacum protoplasts
For transient expression of ZmDUR3mod in tobacco protoplasts, two plasmids harbouring the sequence for
the Green Fluorescent Protein (GFP) were fused at
the N- or C-terminus of ZmDUR3 using vectors pUC18Sp-GFP6 and pUC18-GFP5T-Sp [22]. ZmDUR3mod-ORF
sequence without stop codon was amplified using
primers (5′-ATAACTAGTATGGCTGCTGGTGGTGCT
GG-3′, 5′-ATAtAGATCTGCAGCTAGCGAAAGATTAT
CTTCATCG-3′), and cloned into pUC18-Sp-GFP6 using
the SpeI and BglII sites, yielding ZmDUR3mod: GFP. On
the other hand, to obtain the GFP: ZmDUR3mod construct,
the ZmDUR3mod-ORF sequence with stop codon was
amplified using primers (5′-ATATCTAGAATGGCTGC
TGGTGGTGCTGG-3′, 5′-ATAATGCATTTAAGCTAG
CGAAAGATTATCTTCATCG-3′), and cloned into pUC18GFP5T-Sp using the NheI and PstI sites.
Protoplast isolation and transformation was performed
as described earlier [33]. For co-localization experiments
pUC-PTR1-Sp-EYFP [22] was used as marker for the plasma
membrane. Tobacco protoplasts were co-transformed
with either pUC18-ZmDUR3mod-GFP6 or pUC18-GFP5TZmDUR3mod and pUC-PTR1-Sp-EYFP. As control, free
GFP (pUC18-GFP5T-Sp) was transiently expressed in tobacco protoplasts. As reported by Komarova et al. [22],
protoplasts were examined with a SP2 AOBS confocal
microscope (Leica Microsystems, Wetzlar, Germany), excited with an argon laser at 458 nm for GFP and 514 nm
Page 13 of 15
for YFP. Fluorescence was detected at 492–511 nm for
GFP, at 545–590 nm for YFP and 628–768 nm for chlorophyll epifluorescence detection. Diameter of tobacco protoplasts was approximately 40 μm.
Generation of ZmDUR3mod-overexpressing Arabidopsis
lines and growth phenotyping
The ZmDUR3mod-ORF was excised from pDR197ZmDUR3mod using EcoRI and BamHI and ligated into
vector pBF1 [34] at the EcoRI and BglII sites. Using
this pBF1- ZmDUR3mod construct as template, the
ZmDUR3mod-ORF was amplified using primers (5′-A
TTTAGGTGACACTATAG-3′, 5′-CGCGGATCCTTA
AGCTAGCGAAAGATTATCTTCATC -3′) and cloned into
the final vector pCHF5 [35] in the BamHI site, generating a
construct named pCHF5-ZmDUR3mod. Arabidopsis atdur33 plants [18] were transformed by dipping inflorescences
into a cell suspension (OD600 = 0.6) of Agrobacterium
tumefaciens GV3101 harbouring pCHF5-ZmDUR3mod,
as described by Clough & Bent [36]. Harvested seeds were
germinated on soil; plants at two-leaf-stage were treated with
glufosinate (150 mg l−1; BASTA® 200, Bayer CropScience
Deutschland GmbH, Langenfeld, Germany) to select
transformed lines. The experiments were performed
using independent ZmDUR3-overexpressing lines of
T2 or T3 generation.
For growth complementation tests, surface-sterilized
seeds were grown on agar plates as described by Kojima
et al. [18]. Plants were grown on modified half-strength
Murashige and Skoog (MS) medium without N, supplemented with 1 μM NiCl2 and 50 μM KNO3. Either
500 μM NH4NO3 or 500, 1000 and 3000 μM urea were
added as N sources, alternatively no N was added (negative
control). Col-0, atdur3-3 and three atdur3-3 transformed
lines (atdur3-3 + ZmDUR3-A, −B, −C overexpression
lines) were cultured for 16 days in a growth chamber
with photoperiod, 24 h; light intensity, 220 μmol m−2 s−1;
temperature, 20-22°C; relative humidity, 70 to 80%.
Hydroponic culture of Arabidopsis plants and
root uptake
15
[N]-urea
Arabidopsis thaliana seeds (Col-0; atdur3-3; atdur3-3 +
ZmDUR3-A, −B, −C overexpression lines) were germinated
on half strength MS-agar medium as described by Norén
et al. [37]. After 10 days, the seedlings were transferred for
6 weeks to hydroponic conditions as previously described
by Kojima et al. [18]. During the entire growth period N
was supplied as 1 mM NH4NO3. 4 days before the experiment, plants were transferred to medium lacking N (no N).
Urea influx measurements into plant roots were conducted after rinsing the roots in 0.5 mM CaSO4 solution
for 1 min, followed by incubation for 15 min in nutrient
solution containing 100 μM of 15[N]-urea (98 atom% 15 N;
ISOTEC® Stable Isotopes, Sigma Aldrich, Milano, Italy) as
Zanin et al. BMC Plant Biology 2014, 14:222
/>
Page 14 of 15
the sole N source. After a final rinse of 1 min in 10 mM
non-labelled, ice-cold urea and a second rinse of 1 min in
0.5 mM CaSO4 solution, the Arabidopsis roots were
sampled and dried at 40°C and analysed as previously
described.
Authors’ contributions
NT, DR and RP designed and oversaw the research. LZ, NT, SM performed
the research. CW contributed to the isolation of ZmDUR3 and yeast
complementation assay. NYK participated in the GFP-localization assays. TM
and SC carried out the 15[N]-urea analyses. LZ, NT, DR, RP wrote the article.
All authors read and approved the final manuscript.
Phylogenetic and statistical analyses
Acknowledgements
We wish to thank Nicolaus von Wirén (IPK Gatersleben, Germany) for
providing S. cerevisiae strain YNVWI and the Arabidopsis dur3-3 mutant.
The work was supported by a grant from the Italian autonomous region of
Friuli Venezia Giulia and the Italian Ministry of University and Research.
Phylogenetic analyses were conducted using MEGA version 6 software [38]. The tree was constructed by aligning
the protein sequences by Clustal-W and the evolutionary
history was inferred using the Neighbor-Joining method.
The percentage of replicate trees in which the associated
taxa clustered together in the bootstrap test (1000 replicates) are shown in Figure 2 next to the branches. The
tree is drawn to scale, with branch lengths in the same
units as those of the evolutionary distances used to infer
the phylogenetic tree. The evolutionary distances were
computed using the Poisson correction method and are in
the units of the number of amino acid substitutions per
site.
For the experiments with maize and Arabidopsis plants,
three independent experiments were performed using six
(if not otherwise specified) plants for each sample; each
sample was measured performing three technical replicates. Statistical significance was determined by one-way
analysis of variances (ANOVA) using Student-NewmanKeuls test, taking P < 0.05 as significant. Statistical analysis
were performed using SigmaPlot Version 12.0 software.
Additional files
Additional file 1: Figure S1. Urea concentration in roots and shoots of
maize in response to the presence of urea in hydroponic solution. 5-day-old
maize plants were exposed for a maximum of 24 h to a nutrient solution
without any nitrogen source (Control plants) or supplied with 1 mM urea as
a sole nitrogen source (Urea treated plants). Values are means ± SD of three
independent experiments (ANOVA, Student-Newman-Keuls, P < 0.05, n = 3).
Capital letters are referred to the statistical differences in the roots, while
lower letters are referred to shoots.
Additional file 2: Figure S2. Schematic representation of the position
of exons of the predicted (a) and isolated (b) sequence of ZmDUR3-ORF
on the genomic sequence (from +1 bp of start codon, to stop codon
+5567 bp). In the table, the numbers are referred to the position on the
genomic locus coding for ZmDUR3. (*) six nucleotides are not present in
the fourth exon of the isolated ZmDUR3-ORF.
Additional file 3: Figure S3. Amino-acid alignment of ZmDUR3,
OsDUR3 and AtDUR3. The alignment was made using Clustal-W.
Additional file 4: Figure S4. Comparison of predicted topologies of
ZmDUR3 and OsDUR3 (prediction was performed by />Additional file 5: Figure S5. Nucleotide differences between ZmDUR3
(upper row) and ZmDUR3mod (lower row) sequences. To generate
ZmDUR3mod (KJ652243), the nucleotide sequence of the first 216
nucleotides of ZmDUR3 (KJ652242) was modified by substituting only the
third base of the codons (highlighted in yellow), with no difference
occurring at the amino acid level.
Competing interests
The authors declare that they have no competing interests.
Author details
1
Dipartimento di Scienze Agrarie e Ambientali, University of Udine, via delle
Scienze 208, I-33100 Udine, Italy. 2Institute of Plant Sciences, University of
Bern, Altenbergrain 21, CH-3013 Bern, Switzerland. 3Faculty of Science and
Technology, Free University of Bolzano, Piazza Università 5, I-39100 Bolzano,
Italy.
Received: 12 May 2014 Accepted: 6 August 2014
Published: 29 August 2014
References
1. Raun WR, Johnson GV: Improving nitrogen use efficiency for cereal
production. Agron J 1999, 91:357–363.
2. Tilman D, Cassman KG, Matson PA, Naylor R, Polasky R: Agricultural
sustainability and intensive production practices. Nature 2002, 418:671–677.
3. Hirel B, Le Gouis J, Ney B, Gallais A: The challenge of improving nitrogen
use efficiency in crop plants: towards a more central role for genetic
variability and quantitative genetics within integrated approaches. J Exp
Bot 2007, 58:2369–2387.
4. Miller AJ, Cramer MD: Root nitrogen acquisition and assimilation. Plant
Soil 2004, 274:1–36.
5. Kojima S, Bohner A, von Wirén N: Molecular mechanisms of urea transport
in plants. J Membr Biol 2006, 212:83–91.
6. Wang WH, Kohler B, Cao FQ, Liu LH: Molecular and physiological aspects
of urea transport in higher plants. Plant Sci 2008, 175:467–477.
7. Sands JM: Renal urea transporters. Curr Opin Nephrol Hy 2004, 13:525–532.
8. Cho BC, Park MG, Shim JH, Azam F: Significance of bacteria in urea
dynamics in coastal surface waters. Mar Ecol-Prog Ser 1996, 142:19–26.
9. Mitamura O, Kawashima M, Maeda H: Urea degradation by picophytoplankton
in the euphotic zone of Lake Biwa. Limnol 2000, 1:19–26.
10. Mitamura O, Seike Y, Kondo K, Ishida N, Okumura M: Urea decomposing
activity of fractionated brackish phytoplankton in Lake Nakaumi. Limnol
2000, 1:75–80.
11. Gaudin R, Dupuyu J, Bournat P: Suivi du contenue en azote de la solution
du sol d’une riziere apres placement d’uree. Agron Trop 1987, 42:13–19.
12. Dalal RC: Distribution, salinity, kinetic and thermodynamic characteristics
of urease activity in a vertisol profile. Aust J Soil Res 1985, 23:49–60.
13. Liu LH, Ludewig U, Frommer WB, von Wirén N: AtDUR3 encodes a new
type of high-affinity urea/H + symporter in Arabidopsis. Plant Cell 2003,
15:790–800.
14. Reizer J, Reizer A, Saier MHJ: A functional superfamily of sodium/solute
symporters. Biochim Biophys Acta 1994, 1197:133–166.
15. Jung H: The sodium/substrate symporter family: structural and functional
features. FEBS Lett 2002, 529:73–77.
16. Turk E, Wright EM: Membrane topology motifs in the SGLT cotransporter
family. J Membrane Biol 1997, 159:1–20.
17. Saier MHJ: A functional-phylogenetic classification system for transmembrane
solute transporters. Microbiol Mol Biol R 2000, 64:354–411.
18. Kojima S, Bohner A, Gassert B, Yuan L, von Wirén N: AtDUR3 represents the
major transporter for high-affinity urea transport across the plasma
membrane of nitrogen-deficient Arabidopsis roots. Plant J 2007, 52:30–40.
19. Wang WH, Köhler B, Cao FQ, Liu GW, Gong YY, Sheng S, Song QC, Cheng XY,
Garnett T, Okamoto M, Qin R, Mueller-Roeber B, Tester M, Liu LH: Rice DUR3
mediates high-affinity urea transport and plays an effective role in
improvement of urea acquisition and utilization when expressed in
Arabidopsis. New Phytol 2012, 193:432–444.
Zanin et al. BMC Plant Biology 2014, 14:222
/>
Page 15 of 15
20. Schwacke R, Schneider A, Van Der Graaff E, Fischer K, Catoni E, Desimone M,
Frommer WB, Flügge UI, Kunze R: ARAMEMNON, a novel database for
Arabidopsis integral membrane proteins. Plant Physiol 2003, 131:16–26.
21. Rentsch D, Laloi M, Rouhara I, Schmelzer E, Delrot S, Frommer WB: NTR1
encodes a high affinity oligopeptide transporter from Arabidopsis. FEBS
Lett 1995, 370:264–268.
22. Komarova NY, Meier S, Meier A, Suter Grotemeyer M, Rentsch D:
Determinants for Arabidopsis peptide transporter targeting to the
tonoplast or plasma membrane. Traffic 2012, 13:1090–1105.
23. Mérigout P, Gaudon V, Quilleré I, Xavier Briand X, Daniel-Vedele F: Urea use
efficiency of hydroponically grown maize and wheat. J Plant Nutr 2008,
31:427–443.
24. Orsel M, Filleur S, Fraisier V, Daniel-Vedele F: Nitrate transport in plants:
which gene and which control? J Exp Bot 2002, 53:825–833.
25. Mérigout P, Lelandais M, Bitton F, Renou JP, Briand X, Meyer C, DanielVedele F: Physiological and transcriptomic aspects of urea uptake and
assimilation in Arabidopsis plants. Plant Physiol 2008, 147:1225–1238.
26. Witte CP: Urea metabolism in plants. Plant Sci 2011, 180:431–438.
27. Barberon M, Zelazny E, Robert S, Conéjéro G, Curie C, Friml J, Vert G:
Monoubiquitin-dependent endocytosis of the IRON-REGULATED
TRANSPORTER 1 (IRT1) transporter controls iron uptake in plants. P Natl
Acad Sci USA 2011, 108:E450–E458.
28. Killingsbaeck A: Extraction and colorimetric determination of urea in
plants. Acta Agr Scand 1975, 25:109–112.
29. Ritz C, Spiess AN: qpcR: an R package for sigmoidal model selection in
quantitative real-time polymerase chain reaction analysis. Bioinformatics
2008, 24:1549–1551.
30. Livak KJ, Schmittgen TD: Analysis of relative gene expression data using
real-time quantitative PCR and the 2ΔΔCt method. Methods 2001, 25:402–408.
31. Burke D, Dawson D, Stearns T: Methods in Yeast Genetics. New York: Cold
Spring Harbor Laboratory Press; 2000.
32. Wickerham LJ: Taxonomy of yeasts. USDA Tech Bull 1951, 1029:1–19.
33. Weichert A, Brinkmann C, Komarova NY, Dietrich D, Thor K, Meier S, Suter
Grotemeyer M, Rentsch D: AtPTR4 and AtPTR6 are differentially expressed,
tonoplast-localized members of the peptide transporter/nitrate transporter
1 (PTR/NRT1) family. Planta 2012, 235:311–323.
34. Baukrowitz T, Tucker SJ, Schulte U, Benndorf K, Ruppersberg JP, Fakler B:
Inward rectification in KATP channels: a pH switch in the pore. EMBO J
1999, 18:847–853.
35. Hiltbrunner A, Viczián A, Bury E, Tscheuschler A, Kircher S, Tóth R,
Honsberger A, Nagy F, Fankhauser C, Schäfer E: Nuclear accumulation of
the phytochrome A photoreceptor requires FHY1. Curr Biol 2005,
15:2125–2130.
36. Clough SJ, Bent AF: Floral dip: a simplified method for Agrobacterium‐
mediated transformation of Arabidopsis thaliana. Plant J 1998, 16:735–743.
37. Norén H, Svensson P, Andersson B: A convenient and versatile hydroponic
cultivation system for Arabidopsis thaliana. Physiol Plantarum 2004,
121:343–348.
38. Tamura K, Stecher G, Peterson D, Filipski A, Kumar S: MEGA6: molecular
evolutionary genetics analysis version 6.0. Mol Biol Evol 2013, 30:2725–2729.
doi:10.1186/s12870-014-0222-6
Cite this article as: Zanin et al.: Isolation and functional characterization
of a high affinity urea transporter from roots of Zea mays. BMC Plant
Biology 2014 14:222.
Submit your next manuscript to BioMed Central
and take full advantage of:
• Convenient online submission
• Thorough peer review
• No space constraints or color figure charges
• Immediate publication on acceptance
• Inclusion in PubMed, CAS, Scopus and Google Scholar
• Research which is freely available for redistribution
Submit your manuscript at
www.biomedcentral.com/submit