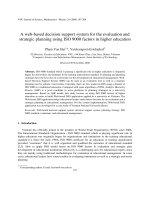
The impact of F-PEC scale and strategic planning in the family business
Bạn đang xem bản rút gọn của tài liệu. Xem và tải ngay bản đầy đủ của tài liệu tại đây (524.38 KB, 10 trang )
Accounting 4 (2018) 11–20
Contents lists available at GrowingScience
Accounting
homepage: www.GrowingScience.com/ac/ac.html
The impact of F-PEC scale and strategic planning in the family business
Nazanin Haji Mirza Hossein Yazdia*
Department of Management and Accounting, South Tehran Branch, Islamic Azad University, Tehran, Iran
CHRONICLE
ABSTRACT
a
Article history:
Received January 9, 2017
Received in revised format
January 11 2017
Accepted May 22 2017
Available online
May 24 2017
Keywords:
Family business
Culture
Power
Family experience
Strategic planning
Due to the thrive of family businesses in the current economic situation, to solve the problem
of the definition of these businesses, in this paper we suggest using a scale that measures the
quality of family influence through three dimensions: power, experience, and culture. The
family influence on power, experience and culture (F-PEC) scale, as well as strategic planning,
have been tested precisely using a random sample of more than 211 people from two companies
of Golestan and Shemshal industrial group located in Tehran, Iran through using the
confirmatory factor analysis technique. The Scale shows a high level of reliability. F-PEC has
been used in a number of studies to theoretical development, particularly in terms of the impact
of family influence on the individual resources and as a source of competitive advantage. In
this research, strategic planning is also considered as a source of competitive advantage and its
impact on the success of the family business has been investigated.
© 2018 Growing Science Ltd. All rights reserved.
1. Introduction
During the past few years, family business has been considered as a separate academic discipline since
the 1990s (Chua et al., 1999; Carlock & Ward, 2001; Witt, 2003; Chrisman et al., 2003a, 2003b). Small
family businesses do not just represent small scale economic activity but they are the outcome of
entrepreneurial ambition and family involvement, which indicates that willpower and emotional
commitment blend with calculative considerations (Johannisson & Huse, 2000). According to Bird et
al. (2002) and Flören (2002) “family business research is becoming increasingly sophisticated and
rigorous”. Anderson and Reeb (2003) studied the relationship between founding-family ownership and
firm performance and reported that family ownership was prevalent and substantial. They also reported
that family firms could perform better than non-family ones. The relationship between family holdings
and business performance was considered to be nonlinear. Astrachan et al. (2002) developed an
alternative technique for evaluating the extent of family influence on any firm, enabling the
measurement of the effect of family on revenue components.
* Corresponding author.
E-mail address: (N. Mirza Hossein Yazdi)
© 2018 Growing Science Ltd. All rights reserved.
doi: 10.5267/j.ac.2017.5.001
12
Birley and Pleitner (2001) reported the findings of a 16-country study on owner managers’ behaviors
in terms of both business and family decisions. Cabrera-Suárez et al. (2001) applied two theoretical
methods from the strategic management field to investigate the critical process and analyzed how it
could be managed efficiently. The conceptual framework provided an insight for understanding the
nature and transfer of knowledge within the family business, which is a basis for developing
competitive advantage over nonfamily businesses. Faccio and Lang (2002) analyzed the ultimate
ownership and control of 5,232 business enterprises in 13 Western European countries. Widely held
companies were believed to be more important in the UK and Ireland, while family controlled
companies in continental Europe. Financial and large companies were more likely widely held, while
non-financial and small companies were more likely family controlled. Heck and Scannell Trent (1999)
presented U. S. prevalence data and their relationships to different family business definitions
presented. The level of prevalence indicated an association with gender, ownership/management,
involvement of family members, and generation of owner.
Johannisson and Huse (2000) investigated how contrasting ideologies influence on the selection
process of outside directors in the small family business. Kayser and Wallau (2002) performed a survey
in Germany and stated that although manufacturing family businesses maintain a rather small number
of products due to their high degree of specialization, they export their products worldwide.
Increasingly, the firms are intensifying their service orientation and going into cooperative relationships
with other enterprises, even in sensitive strategic areas like research and development. They concluded
that in spite of the continuing high ranking of values such as independence and maintaining the
enterprise under the effect of the family, enterprises are open for cooperative activities within the firm
(Klein & Blondel, 2002). Stewart (2003) considered the expenses and advantages of a role for kinship
in business.
1.1 F-PEC scale of family influence
There are at least three important dimensions of family influence: power, experience and culture. A
common problem mentioned later that is not considered in the F-PEC is evaluation. Self-identification
is not considered because the repeatability of such results is questionable at best. Power refers to the
dominance exerted by financing businesses such as stocks held by the family and through leadership
and/or control of the business through the management and/or participation in management by family.
Subcriteria of power include stock, the percentage of senior management positions and relative board
positions retained by the family. Experience refers to the whole experience that family brings to the
business and will be operational by the generation in the management employment and ownership. In
fact, the more generations are in company, the more the chance of related familial memory. Culture,
refers to the values and commitment and employs the family business commitment questionnaire.
(Carlock & Ward, 2001). Family commitment has been observed in the overlap between family and
business values. Three dimensions of power, experience and culture of the F-PEC scale, constitute an
indicator of the impact of family. (See Appendix 1 for a copy of F-PEC scale).
1.2 power, ownership, administration and management
Subscales of power in F-PEC scale consider the percentage of family members on the Board of
Directors and the percentage of members that are on the board through family members. A family can
affect business through the extent and quality of the ownership, administration and management
participation. a measure should not taking into account only these issues, but it also should consider
the legal, political and economic considerations related to different cultures (Whyte, 2003).
Since the early 1970s, family participation as leaders of family firms has been considered. This
Research has focused on a number of different topics, including legitimate leadership, performance,
N. Mirza Hossein Yazdi / Accounting 4 (2018)
13
the theory of principal-agent and government structures. Subscale of power in F-PEC evaluates the
degree of influence or Total domination of family members. This level of influence can be seen through
ownership, management and administration as changeable or additive, though, this is also an empirical
question. Families influence through management and administration can be measured as a proportion
of family members in board. In contrast, indirect effects could mean a board called the family members,
but there is no family member in it. This type of indirect influence of family, can be substantial. To
optimized assess of this effects, a weighting system should be used. Likely impact of a third party, such
as a non-family member has a range from 0 to 100 percent. An outsider can be expected to have less
impact than one of the family members, even if he/she is selected by the family desires. For example,
a weak non-family member who works in a strong family environment, leaves half of his/her decision
to family, which means that about 50 percent of family influence is exercised. Conversely, a strong
non-family member in a poor family environment has much more personal impact. If someone aims to
measure all of these direct impacts, we propose a conservative weighting of the indirect familial
influence with the scale's lower limit of 10%.Then considering the above views, the first hypothesis
arises in this way:
Hypothesis 1: The family power affects the family business.
1.3 Experience: generation in control of the family business
Subscale of experience is related to succession and refers to the number of family members who have
contribution in business. A number of scholars stated that when a company wishes to transfer to the
next generation, can only be regarded as a family business. Others believe that at least a generation
transition should occur. It may be argued that the level of experience that comes from a succession
process is the highest from the first generation to the second. During the first generation of ownership,
many provisions have been deployed. So the second and subsequent generations may add lesser value
to this process. We point out that the experience of family business from succession can be seen as an
exponential function. Accordingly, the generation of family ownership and who is governing the board
of management dimensions weight based on the non-linear algorithms.
Hypothesis 2: Family Experience affects the family business.
1.4 Culture, family values against business
Family business culture is formed by the values that are rooted in an organization (Klein, 2000). The
important individual values can be incorporated in the internal political issues, in the manner of
communication, ways of dealing with conflict and the degree of business centralization versus its
decentralization. Evaluating the overlap of the company and family values, can be difficult, because
the issues of definition and time, should be considered.
This is not a simple solution to assess the individual or organization values. F-PEC scale seeks the
views of members of the CEO/owner-manager to the extent of overlapping between family and
business values as well as family commitment to the business. However, the culture subscale seeks the
views of the CEO/owner-manager, a strong case can be created to achieve the desires of other family
members in order to achieve a larger image. On the one hand, exclusive reliance on self-reports of
CEOs for the validation of a tool can create problems of bias. On the other hand, is not always possible
to get multiple answers or to identify the right people. We believe that CEOs are sufficient to represent
the business and families operations.
Hypothesis 3: culture and family values affect the family business.
14
1.5. Strategic Planning
Strategic planning is the subject of many investigations. While intuitively it is assumed that there is a
positive relationship between direct planning and development of the company, findings are
inconsistent. Some researchers of entrepreneurship have questioned the value of strategic planning for
new companies and small businesses. It is argued that the lack of internal flexibility was created by the
constraints of organizational flexibility and ability to adapt to an imposed formal strategic planning.
Instead, it is believed that a more informal and flexible approach to strategy (such as emerging and
adaptive strategies) which gives the possibility to change and adaptation will enhance the performance.
Furthermore, when we think about the limitations of resources, time and energy are required to develop
strategic plans, some argue that the company leader's time may be spent better on the value creation
activities. In family firms there is a risk that wealth preservation and conservative approaches was
preferred, which acts against the needed strategic changes and prevent the growth of the company. In
fact, the fastest growing family companies has been shown as the Proactive planning for the future and
actively participate in strategic planning (Upton and others).
Hypothesis 4: Family Strategic Planning affects the family business.
It should be noted, Chrisman et al. (2003a, 2003b) suggested that without theory, there is no causal
relationship, and the goal of helping family businesses to manage better their businesses, to conduct
research. Each theory of the family firm should describe why family businesses are distinct, and how
this uniqueness is created,
2. Research Methodology
This study utilized a non-experimental research - survey methods. The questionnaire consists of 5 parts.
The first part of this study is designed to assess the demographic information such as gender, age and
education. The second part of this form evaluates the measure of family power through the percent of
family ownership, the percentage of family members in management team, the percentage of family in
the Board items (See Appendix). In the third section, respondents answer the questions about family
experience within a 5-point Likert scale with these items: how many generations of family have been
the owners the company? How many generations were in management positions? How many
generations have been active on the board? In the fourth part, respondents express their views about
the culture in family businesses. These criteria are derived from the Klein’s research (2001). This
measure consists of 12 items that measured dimensions that are presented in the Appendix, where these
items were integrated in the final model. In the last part of the questions about strategic plans of family
businesses were asked and the impact of this criterion on the family business was measured. Target
population for this study includes the qualified individuals in family firm, a sample of more than 211
people of the Golestan Company and "Shemshal Industrial Group were selected using random sampling
and tested using affirmative factor analysis during 3 days in December 2014.
2.1. The data analysis
According to Table 1, alpha coefficients of all variables are higher than 0.70 and therefore questions
have desirable reliability.
Table 1
The reliability calculation of research variables
Dimensions
Family power
Family experience
Culture
Strategic Planning
Total
Number of Questions
3
3
12
3
21
Cronbach's alpha coefficients
0.776
0.793
0.898
0.812
0.912
15
N. Mirza Hossein Yazdi / Accounting 4 (2018)
2.2 Descriptive Statistics
As can be seen in Table 2, Most of the sample were female (66%), aged between 20 and 30 (50%), and
those who have bachelor's degrees (73%), respectively. In addition, 102 of them (48%) had an
experience less than 5 years. Other demographic characteristics are shown in Fig. 1.
1%5%
5%
4%
8%
19%
48%
50%
44%
29%
87%
20-30
30-40
40-50
50<
Age
12
14
16
5>
Years of education
5--10
10--20
20<
Job experience
Fig. 1. Personal characteristics of the participants
Table 2
Descriptive statistics for research variables and Kolmogorov-Smirnov test
Variable
Family power
Family experience
Culture
Strategic Planning
Mean
3.64
3.73
3.44
3.7
Standard deviation
0.81
0.81
0.7
0.83
Kolmogorov-Smirnov statistic
1.3
1.09
1.17
1.18
Significance level
0.07
0.188
0.131
0.126
According to Table 2, the family experience variable has the highest mean (of 3.73) and the culture
variable has the least (3.44). The data dispersion of strategic planning variable is higher due to the
higher standard deviation of (0.83). According to the Kolmogorov-Smirnov test results, the significance
level for all the research variables is higher than 0.05 and this means confirmation of normal distribution
hypothesis of the data. Therefore, the structural equation modeling and parametric tests can be used.
Before examining the hypotheses, the software Spss 16 was used to identify correlations between
variables and the Spearman correlation test was used for the ranking nature of data.
Table 3
Correlation between variables (p <0.01)
Variable
Family power
Family experience
Culture
Strategic Planning
Family power
1
-
Family experience
0.44a
1
-
Culture
Strategic Planning
0.51a
0.38a
1
-
0.40a
0.53a
0.36a
1
The results of correlation analysis showed that all research variables have statistically significant
correlations (symbol “a” in the table means Significant of relations in significant level of 0.01 (p <0.01).
In addition, because the correlation coefficient is positive it can be said that there is positive and
significant correlations between variables (Table 3).
16
2.3 Measurement models
In Structural equation modeling, it is needed to test two models. The first model is a measurement
model for each latent variable. Measurement model shows the factor loadings of observed variables
(factors) for each latent variable. The common Fitting criteria in Measurement models for each of latent
variables is presented in Table 5. Among fitting criteria, if the chi-square ratio to the degree of freedom
is less than 2, then the model has a proper fitting. The RMSEA index less than 0.05 is desirable. About
the other indicators much closer to 1 is also more desirable. As can be seen, the major fitting criteria of
all latent variables are in the good and acceptable range. In general, we can say that the sub-models of
research are fitted properly.
Table 4
The fitting criteria of the measurement models of the Research latent variables
Indicators
Acceptable rate
Family power
Family experience
Culture
Strategic Planning
X2/df
<2
0.32
0.19
0.008
0.03
RMSEA
<0.05
0
0
0
0
NFI
>0.9
0.99
0.99
1
1
CFI
>0.9
1
1
1
1
IFI
>0.9
1
1
1
1
RFI
>0.9
0.99
0.99
1
1
GFI
>0.9
0.99
0.99
1
1
PRATIO
>0.5
0.33
0.33
0.33
0.33
PNFI
>0.5
0.33
0.33
0.33
0.33
PCFI
>0.5
0.33
0.33
0.33
0.33
AGFI
>0.9
0.99
0.99
1
0.99
2.4 Structural equation model
After testing the measurement models now it is necessary to present the structural model that represents
the relationship between latent variables. Using the structural model, we can evaluate the research
hypotheses. The structural model is created using the Amos software version 18.
Fig. 2. The first order Confirmatory factor analysis
Table 5
The ultimate model fit indices
X2/df
Indicators
Acceptable rate
<2
Result
2.48
RMSEA
<0.05
0.08
NFI
Fig. 3. The second order Confirmatory factor analysis
CFI
>0.9 >0.9
0.9 0.93
RFI
GFI
PRATIO
>0.9 >0.9
0.93 0.86
IFI
>0.9
0.91
>0.5
0.72
PCFI
AGFI
>0.5 >0.5
0.65 0.68
PNFI
>0.9
0.86
17
N. Mirza Hossein Yazdi / Accounting 4 (2018)
The Fitting criteria of the First order confirmatory factor analysis model in Table 5 shows the improper
fitting of the model. So using the Amos corrective measures the model was reformed and the errors
with the highest corrective indicators were related and indicators recovered as shown in Table 6.
Table 6
The fitting Indicators of the Research's first order Confirmatory-corrective model
Indicators
Acceptable rate
Total model
X2/df
RMSEA
NFI
CFI
IFI
RFI
GFI
PRATIO
PNFI
PCFI
AGFI
<2
1.3
<0.05
0.038
>0.9
0.95
>0.9
0.98
>0.9
0.98
>0.9
0.92
>0.9
0.96
>0.5
0.62
>0.5
0.59
>0.5
0.61
>0.9
>0.92
2.5 Judgment about research relationships in the confirmatory factor analysis
As shown in Table 7, the level of significance for all relations is between 0.05 and zero, (*** means
0.001> p). So all four factors of the family power, family experience, strategic planning and culture
play a crucial role in defining the variable of family business so that power has the higher rank than the
rest of the variables and the culture has the least. In addition, according to factor analysis of the firstorder, all latent variables of research (family power, family experience, strategic planning and Culture)
have a significant correlation.
Table 7
Estimation Indicators of Research model after correction
nonstandard
Estimation
Family power
Family experience
Strategic Planning
Culture
q1
q2
q3
q4
q5
q6
p1
p2
p3
q19
q20
q21
Family power
Family experience
Culture
Family experience
Family power
Family power
<--<--<--<--<--<--<--<--<--<--<--<--<--<--<--<--<-->
<-->
<-->
<-->
<-->
<-->
Family business
Family business
Family business
Family business
Family power
Family power
Family power
Family experience
Family experience
Family experience
Culture
Culture
Culture
Strategic Planning
Strategic Planning
Strategic Planning
Family experience
Culture
Strategic Planning
Strategic Planning
Strategic Planning
Culture
1.000
.726
.658
.566
1.000
1.100
.930
1.000
1.308
.951
1.000
1.247
1.076
1.000
1.185
1.683
.278
.171
.135
.204
.267
.245
standard
estimation
error
Critical
ratio
significance
level
.117
.113
.094
6.216
5.800
6.055
***
***
***
.111
.100
9.877
9.258
***
***
.128
.108
10.182
8.781
***
***
.118
.105
10.568
10.214
***
***
.126
.215
.053
.037
.032
.044
.050
.046
9.434
7.840
5.268
4.559
4.221
4.645
5.303
5.322
***
***
***
***
***
***
***
***
standard
estimation
.885
.692
.764
.623
.730
.800
.687
.680
.972
.640
.688
.886
.807
.605
.702
.887
.582
.445
.425
.559
.676
.590
To test the research hypothesis that explains that each of the variables of the family power, family
experience, strategic planning and culture influence the family business, t - test was used. According
to Table 8, the test statistic value is higher than 1.96 for all variables, the upper and lower limit have
the same sign and are positive and the significance level is 0.000 which is less than 0.05. Therefore, we
can say that the null hypothesis is rejected and the opposite hypothesis is confirmed for the testing
variables. This means that the family power, the family experience, strategic planning and the culture
affect the family business. As we can see, all means are higher than the mean of population (=3), which
indicates the beliefs of respondents about the high influence of each variable on the family business.
18
Table 8
The results of t-test
Variable
Family power
Family experience
Strategic Planning
Culture
sample
size
mean
value of
the test
statistic
degrees
of
freedom
significance
level
211
211
211
211
3.64
3.73
3.7
3.44
11.39
13.15
12.29
9.06
210
210
210
210
0
0
0
0
Mean confidence interval
with 95% CI
upper limit
lower limit
0.749
0.528
0.841
0.622
0.812
0.586
0.532
0.342
3. Conclusion
The results show that all four factors of family power, family experience, strategic planning and culture
play a crucial role in defining and explaining the variable of family business so that the family power
has the higher rank than other variables and culture has the lowest. Also according to the statistical
results and the answers of the respondents it was concluded that the strategic planning has direct
relationship with the family business and has correlation with the other three dimensions and ultimately
none of the dimensions were removed from the model and the relationships were confirmed. The results
of the research are important that they provide empirical support for the validity and reliability of the
F-PEC scale. Since they get theoretical support and have been widely used (e.g. Klein, 2003) and have
been approved by the researchers.
Acknowledgement
The authors would like to thank the anonymous referees for constructive comments on earlier version
of this paper.
References
Anderson, R. C., & Reeb, D. M. (2003). Founding‐family ownership and firm performance: evidence
from the S&P 500. The Journal of Finance, 58(3), 1301-1328.
Astrachan, J. H., Klein, S. B., & Smyrnios, K. X. (2002). The F-PEC scale of family influence: A
proposal for solving the family business definition problem. Family business review, 15(1), 45-58.
Bird, B., Welsch, H., Astrachan, J. H., & Pistrui, D. (2002). Family business research: The evolution
of an academic field. Family Business Review, 15(4), 337-350.
Birley, S., & Pleitner, H. J. (2001). Owner-manager attitudes to family and business issues: A 16
country study. Entrepreneurship Theory and Practice, 26(2), 63-76.
Carlock, R., & Ward, J. (2001). Strategic planning for the family business: Parallel planning to unify
the family and business. Springer.
Cabrera-Suárez, K., De Saá-Pérez, P., & García-Almeida, D. (2001). The succession process from a
resource-and knowledge-based view of the family firm. Family Business Review, 14(1), 37-46.
Chrisman, J. J., Chua, J. H., & Sharma, P. (2003). Current trends and future directions in family
business management studies: Toward a theory of the family firm. Coleman white paper series, 4(1),
1-63.
Chrisman, J.J., Chua, J.H., & Steier, L.P. (2003a). An introduction to theories of family business.
Journal of Business Venturing, 18, 441–448.
Chrisman, J.J., Chua, J.H., & Zahra, S.A. (2003b). Creating wealth in family firms through managing
resources: Comments and extensions. Entrepreneurship, Theory & Practice, 27(4), 359–365.
Chua, J.H., Chrisman, J.J., & Sharma, P. (1999). Defining the family business by behavior.
Entrepreneurship, Theory & Practice, 23(4), 19–39.
N. Mirza Hossein Yazdi / Accounting 4 (2018)
19
Faccio, M. & Lang, L. (2002). The ultimate ownership of Western European corporations. Journal of
Financial Economics, 65(3), 365–395.
Flören, R.H. (2002). Crown princes in the clay: An empirical study on the tackling of succession
challenges in Dutch family farms. Dissertation, Universiteit Nyenrode.
Heck, R.K.Z. & Scannell Trent, E. (1999). The prevalence of family business from a household sample.
Family Business Review, 12(3), 209–224.
Johannisson, B. & Huse, M. (2000). Recruiting outside board members in the small family business:
An ideological challenge. Entrepreneurship and Regional Development, 12(4), 353–378.
Kayser, G. & Wallau, F. (2002). Industrial family businesses in Germany: Situation and future. Family
Business Review, 15(2), 111–115.
Klein, S. B. (2000). Family businesses in Germany: Significance and structure. Family Business
Review, 13(3), 157-181.
Klein, S.B. & Blondel, C. (2002). Ownership structure of the 250 largest listed companies in Germany.
INSEAD working paper 2002/123/IIFE.
Stewart, A. (2003). Help one another, use one another: Toward an anthropology of family business.
Entrepreneurship, Theory & Practice, 27(4), 383–396.
Witt, P. (2003). Corporate governance systeme im Wettbewerb, Wiesbaden: Deutscher
Universitätsverlag.
Whyte, M.K. (1995). The social roots of China's economic development. The China Quarterly, 144,
900-1019.
Appendix
Variables and Items
row
Family power
1
2
3
Family experience
4
5
6
Family Culture
7
8
9
10
11
12
13
4
15
16
17
18
Strategic Planning
19
20
21
Description
family ownership Percent of stocks
% Of the family members in management team
% of The family members in the Board
How many generations has been the business owner?
How many generations have been in management positions in the company?
How many generations has been active on the board?
Family members are agreed with the objectives, policies and business plans.
Family members have a sense of loyalty to the family business
Family and business values are similar.
Family members support the family business in discussions with friends, staff, and other families.
Family members really care about the fate of the family business.
I understand and support my family decision making about the future of family business.
Other family members are proud to say that we're part of the family business.
Family members want to go beyond the usual effort to help make a successful family business.
Family influence on your business
Family business decision making has a positive impact on my life.
We achieve many things with family business in the long.
we share the Similar values with our family
We have strategy to achieve our goals.
We have a plan for our business,.
We know what we need to achieve our goals.
20
© 2018 by the authors; licensee Growing Science, Canada. This is an open access
article distributed under the terms and conditions of the Creative Commons Attribution
(CC-BY) license ( />