Asset allocation and strategies on investment portfolio performance: A study on the implementation of employee pension fund in Indonesia
Bạn đang xem bản rút gọn của tài liệu. Xem và tải ngay bản đầy đủ của tài liệu tại đây (385.01 KB, 12 trang )
Accounting 6 (2020) ***–***
Contents lists available at GrowingScience
Accounting
homepage: www.GrowingScience.com/ac/ac.html
Asset allocation and strategies on investment portfolio performance: A study on the implementation
of employee pension fund in Indonesia
Sugeng Wahyudia, Hasanudinb* and Irene Rini Demi Pangestutia
aDiponegoro
b
University, Semarang, Indonesia
National University, Jakarta, Indonesia
CHRONICLE
Article history:
Received March 9 2020
Received in revised format March
15 2020
Accepted May 18 2020
Available online
May 18 2020
Keywords:
Asset allocation
Turnover
Board size
Institutional ownership
Diversification
Portfolio
Performance
ABSTRACT
This study aims to analyze the ability to determine the weight of securities of stocks, bonds, mutual
funds and deposits in the implementation of employer pension funds in Indonesia based on variables
of asset allocation, portfolio turnover, board size, institutional ownership and diversification of the
portfolio performance. The data collection method used was non-participant observation. By using a
data pooling technique which combined time series data over period 2016-2018 and a cross section
data of 64 Employer Pension Funds (DPPK, Employer Pension Funds), 192 observed analysis units
were obtained. The effect of the variables was analyzed by using Structural Equation Modeling (path)
as the analysis technique and using LISREL (Linear Structural Relationships) program. The test results
showed that the asset allocation strategy had a positive effect on the investment portfolio performance.
The same also happened to institutional ownership and diversification variables which also had a
positive and significant effect on the investment portfolio performance. However, this study showed
that there was no positive effect on the board size and portfolio turnover on the investment portfolio
performance. Theoretical and managerial implications and also the limitations of this study are
discussed at the end of this study.
© 2020 by the authors; licensee Growing Science, Canada
1. Introduction
The research investigated the effects of grit and employability on organizational commitment by mediating job involvement of
the private higher education in Indonesia. This research used a quantitative approach with a survey method. The sample of this
research is 130 lecturers selected by purposive sampling. The data were obtained by distributing questionnaires and analyzing
with path analysis based on supporting correlation and descriptive statistics. The results of the research confirm that grit,
employability and job involvement had significant direct effects on organizational commitment, grit and employability had
significant direct effects on job involvement, and grit and employability had significant indirect effects on the organizational
commitment by mediating job involvement. A fit research model was found on the effects of grit and employability on
organizational commitment mediating by job involvement. This model can be discussed as a reference by researchers and
practitioners in developing models of organizational commitment in the future and any context. To meet liquidity needs such as
a payment of pension benefits in a short term (1 to 2 years), the pension funds are advised not to invest the funds in either
medium or high-risk instruments, but are allocated for investment in low-risk instruments, such as the BI (Bank Indonesia) Rate,
* Corresponding author.
E-mail address: (Hasanudin)
© 2020 by the authors; licensee Growing Science, Canada
doi: 10.5267/j.ac.2020.5.010
2
and deposits, or better known as money market instruments. For medium-term liquidity needs (3 to 5 years), these medium-term
funds can be invested in the instruments such as bonds, sukuk and other medium-risk instruments. While for long-term liquidity
needs (over 5 years), these long-term funds can be invested in high-risk investment instruments. The above three instruments,
bonds, sukuk and shares, are better known as capital market instruments. Another factor that must be considered in investment
is the agency theory problem regulated in the corporate governance system which arises when ownership and control are
separated.
Managers and shareholders are not identical because managers can take actions that benefit themselves at the expense of
shareholders. Therefore, a good corporate governance system must create a mechanism that regulates managers to act in the
interests of shareholders by providing incentives. This mechanism can be derived from external or internal factors of the
company, while the second interaction determines the control of the total effectiveness of the corporate governance structure
(Shleifer & Vishny, 1997). The ownership structure of the company has an influence on the company value. Broadly speaking,
the ownership structure consists of two ownerships namely managerial and institutional ownership. In addition, the company
ownership consists of institutional and individual ownership or a mixture of both in certain proportions (Siallagan & Machfoedz,
2006). Institutional investors are thought to have the ability to prevent loss management compared to individual investors. The
institutional investors are considered more professional in overcoming their investment portfolios, so that there is a possibility
of lower financial distortions. The greater the percentage of shares held by institutional investors, the more effective the
supervision is because it can control the opportunistic behavior of managers and reduce agency costs (Jensen 1968). La Porta et
al. (1999) mentions that the most reasonable ownership mechanism in emerging market countries was the concentrated
ownership structure with a 10% oversight limit. At the same separation of control rights, Claessens et al. (2000) found that the
highest ownership occurred in Indonesia (67%) and Singapore (55%). Faccio and Lang (2002) found that the largest ownership
in Norway (34%) and in Belgium (25%) at the limit of 20%. Besley and Prat (2003) noted that the agency conflict on pension
funds was different from the companies in general because there were no problems with the separation of ownership and control.
What is important in the Pension Fund determines who is at risk. In a defined benefit pension plan, the beneficiary bears the
risk because the participants will feel the poor workings of the investment from the fund management. Therefore, the rules
owned must have a strong impact on the person responsible for controlling the funds. On the other hand, the board of directors
on pension funds must cover the proportion of directors who will represent the beneficiaries. In the practice, however, directors
generally are appointed by fund owners and thus can reduce their independence. Therefore, the number of outsiders is not
positively correlated with investment returns and therefore, other good governance factors are also important. In the literature,
board size and proportion of boards are often found in corporate governance systems. Small board size is believed to be able to
improve company performance due to increased monitoring. Whereas on large boards, board members have smaller
communication opportunities in decision-making processes involving larger boards (Jensen 1993). Consistent with this idea,
Yermack (1996) examined the inverse relationship between the board size and profitability, asset utilization, and Tobin's Q.
One of the main concepts in financial planning is the importance of asset allocation strategies (making long-term decisions at
the moment about how to allocate assets in order to be invested in different types of assets such as cash, certain interest, property
and shares). By adopting investment policies in the long run, it is believed that portfolio returns can be optimized in the form of
decreasing average yields from different types of assets (Brennan et al., 1997). Practically, a financial planning recommends an
asset allocation strategy for investors based on the company's risk profile and strives to maintain investment portfolios according
to the standards (Taylor 2010). In this study, the researchers tried to understand the effect of variable of asset allocation (AA),
portfolio turnover (PTO), board Size (BS), Institutional Ownership (IO) and Diversification (DEVR) on portfolio performance
(KP) of employer pension fund institutions in Indonesia.
2. Literature Review and Hypothesis Development
2.1. The Effect of Asset Allocation on Portfolio Performance
Asset allocation strategies are generally interpreted as allocating investors’ portfolios to a number of major asset classes (Drobetz
& Köhler 2002; Sharpe 1991). The asset allocation is usually defined as the formation of normal asset class weights or passive
asset class weights. The analysis of asset allocation was first carried out by Brinson et al. (1986) and updated Brinson et al.
(1991) through a phenomenal article that this process contribution to the total investment performance was of 93.6% and 91.5%.
Drobetz and Köhler (2002) emphasized that there are several activities that must be carried out by investment managers in
managing their funds, including the determination of asset allocation strategies and stock selection. Asset allocation policy is
the determination of asset allocation that involves the distribution of funds held in various available asset classes. Investors must
pay attention to various constraints that affect the asset allocation strategy such as how much funds owned and the portion of
the fund distribution. For the measurement of asset allocation strategies, Ibbotson and Kaplan (2000) did it with a model
consisting of return (PRit) and active return (ARit) policy. Return policy is part of the asset allocation strategy (Rit), while active
return is the remainder. Alexeev and Tapon (2012) analyzed three components of active management (asset allocation, market
timing and security selection) in the performance of United States pension funds related to the size of funds and investment
liquidity. The average fund in the sample had an annual net alpha of 89 basis points which was evenly distributed across all
S. Wahyudi et al. /Accounting 6 (2020)
3
asset allocations, market timing, and security selection components. The stock momentum fully explained positive alpha in the
security selection, while "time series momentum" became the driver of market timing. While larger pension funds had lower
investment costs, this did not result in a better performance. In contrast, the three components of active management showed
large-scale diseconomies which were directly related to liquidity. The results of the study showed that pension funds, especially
large ones, would perform better if the funds were invested with a passive approach. The better the allocation of assets as
measured by asset class factor models such as stocks, bonds and deposits that produce optimal returns as based on the principle
of “high risk, high return”, the better the performance of the portfolio. Based on the literature review, the hypothesis formulated
regarding the asset allocation relationship which has a positive effect on portfolio performance is as follows:
Hypothesis 1: The asset allocation strategy has a positive effect on the investment portfolio performance.
2.2. The Effect of Portfolio Turnover on Portfolio Performance
Hilsted (2012) conducted a study aimed at creating an investment strategy for portfolio management to actively outperform the
Danish MSCI from 1992-2011. The development of the Danish stock market index has been quite impressive because its
performance is very good compared to other national indices. This study compares two diversified portfolios internationally
with MSCI Denmark as the benchmark for a limited portfolio with maximum restrictions on asset representation of 20% while
other portfolios are unlimited.
Hypothesis 2: Portfolio turnover has a positive effect on the investment portfolio performance
2.3. The Effect of Board Size on Portfolio Performance
Agency theory views the main role of the Board in carrying out effective monitoring functions for company management to
ensure that management performs the function of serving well for the company owners (Fama and Jensen 1983). Historically,
the definition of corporate governance also considered the relationship between shareholders and companies in accordance with
agency theory, namely directors acting on behalf of shareholders in accordance with the principle of overseeing selfish
management behavior. However, the broader definition of corporate governance today attracts a greater attention (Solomon
2007). An effective corporate governance is currently understood as being involved in a number of participants. In literature,
the board size and board composition are often common corporate governance problems. A small board size is believed to be
able to improve company performance because the benefits of increased monitoring that follows a larger board are comparable
to the weak communication and decision making of larger groups (Jensen 1993). Consistent with this idea, Yermack (1996)
documented the inverse relationship between the board size and profitability, asset utilization, and Tobin's Q. Another important
characteristic of the board found in the literature is a diversity measured by sex by Carter and Lorsch (2003), nationality by
Masulis et al. (2011), the proportion of independent directors over age 69 by Core et al. (1999), the number of outsiders
appointed by directors by Ferris et al. (2003) and their political connections by (Agrawal and Knoeber 1996). In addition, Kim
and Lim (2010) had recently shown that the level of education and profession of the outside directors could also determine the
company valuations. Based on this study, it can be hypothesized that the diversity of outside directors might predict the
performance of pension funds.
Hypothesis 3: Pension fund governance measured by a small board size has a positive effect on the investment portfolio
performance.
2.4. The Effect of Institutional Ownership on Portfolio Performance
Fama and Jensen (1983) stated that agency problems are caused by the existence of a separate decision-making system between
management and the supervisor. Fuerst and Kang (2004) stated that in various studies, including researches by (Jensen and
Meckling 1976; Shleifer and Vishny 1997), showed that the separation of ownership and management of a company led to
conditions in which managers would squander the company property. This separation of functions between owners and
management has another negative impact, namely the flexibility of company management to optimize profits. This will lead to
the process of prioritizing management's own interests with the costs that must be borne by the company owner. Cheung et al.
(2009) provided new evidence on the relationship between managerial ownership, institutions and company performance. This
relationship found that the influence of information on the company's stock price and corporate governance. Elyasiani and Jia
(2008) revealed that there was a positive relationship between company performance and the stability of institutional ownership.
Wahab et al. (2008) found that institutional ownership was positive and significant related to the corporate governance. Giannetti
and Laeven (2008) stated that the reformation of pension by triggering the importance of pension funds could improve stock
market development and improve corporate governance. Cornett et al. (2007) found that there was a significant relationship
between the return rate of the company's operating cash flow, the percentage of institutional ownership and the number of
institutional shareholders.
Hypothesis 4: Governance as measured by the size of institutional ownership has a positive effect on the investment portfolio
performance.
4
2.5. The Effect of Diversification on Portfolio Performance
Modern portfolio theory, starting with (Markowitz 1952; Roy 1952), predicts that portfolio diversification in asset classes with
correlated returns increases portfolio returns for a certain risk level or even for lower risks. As stated by Asher (2008), the
allocation of pension fund assets, especially in Asian countries, is strongly influenced by strict government regulations that are
not necessarily beneficial for pension fund managers. Pension funds have been biased against excessive weighting of
government securities and other domestic assets rather than using an optimal asset allocation strategy. This can lead to an optimal
portfolio ownership with lower yields and higher risks, yet the pension benefits for members deteriorated. For example, Kumara
and Pfau (2012) stated that the addition of assets including international assets could help a lot in increasing the sustainability
of pension funds, while also increasing expected returns and reducing volatility. According to Solnik and McLeavey (2013)
international assets tend to provide diversified benefits because international assets are not influenced by shocks of a specific
country. Bodie and Merton (2002) showed that pension funds could carry out an international diversification by using asset
swaps without considering the development of local capital markets. The results of the study by Kumara and Pfau (2012) showed
that workers with risk aversion, that vary from aggressive to conservative, are better served by allowing an international
diversification. The results of Hauss (2004) also showed that risk factors that were not systematic, and thus could be diversified
for real estate investment, were generally higher and this risk component could be increased by an international diversification.
Hypothesis 5. Diversification has a positive and significant effect on portfolio performance
3. Research Methodology
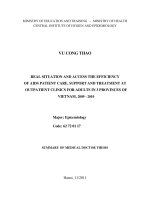
3.1. Research Framework
By referring to the hypothesis and the framework of the research model developed in this study, the specification of the path
analysis model of this study is as follows:
Fig. 1. Research Framework
3.2. Research Design
This research is a correlation research which aims to identify variables in certain situations that influence a phenomenon that is
being observed (Ghozali 2009). The basic theoretical models developed are based on investment theory, Markowitz portfolio
theory, agency theory, capital asset pricing model (CAPM) theory, efficient market hypothesis (EMH), and asymmetric
information theory.
3.3. Sampling
Based on the data from the Financial Services Authority (OJK), there were 267 Employer Pension Funds (DPPK, Employer
Pension Funds) which had been approved by the Minister of Finance. The sampling method used in this study was purposive
sampling method. The sample selection was based on the following reasons: i) The DPPK that had reported in 2016-2018; ii)
The annual report which provided data needed in this research. Based on these reasons, a sample of 64 operating DPPK was
obtained after obtaining an approval from the Minister of Finance and the Financial Services Authority with a portfolio analysis
unit on Shares, Deposits, Corporate Bonds, Government Bonds and Mutual Funds. This study used data pooling techniques
which combined time series data during 2016-2018 and cross section data as many as 64 DPPK. With the time series data
observed for 3 years and 64 DPPK as the cross-section data, 192 units of structural equations were obtained. According to
Ferdinand (2006) the sample size that must be met in the SEM modeling is a minimum of 100. According to Hair et al. (2010)
S. Wahyudi et al. /Accounting 6 (2020)
5
the number of samples needed in a research using SEM analysis is at least 5 (five) times the number of indicator variables used.
Ghozali (2011) added that the number of samples needed to estimate maximum likelihood with structural equation models
ranges from 100 to 200.
3.4. Data Collection Method
In this study, the data collection method used was a non-participant observation method, where researchers only observed the
available data, without being a part of a data system. The data needed in this study were as follows: (i) Total annual net assets
for each sample from December 2015 to December 2018; (ii) Total monthly investment income (ROI) for each sample from
December 2015 to December 2018; (iii) Total Annual Investment Opinion (ROI) for each sample in the period of 2016-2018;
(iv) Monthly BI RATE rate; (v) Monthly JCI; (vi)Monthly Indonesia Goverment Bond Index (IGBI); (vii) Monthly Indonesia
Corporate Bond Index (ICBI); (viii) Monthly Mixed Mutual Fund Index.
3.5. Operational Definition and Variable Measurement
The portfolio performance variable was measured by the Sharpe Index developed by William Sharpe which also of the called
as the reward-to-variability ratio. The Sharpe index bases its calculations on the capital market line concept as a benchmark, by
dividing the portfolio risk premium by its standard deviation. Risk premium is the difference between the average performance
produced by the portfolio and the average risk-free asset performance. By calculating the risk, it indicates that the higher Sharpe's
measurement value, the better the performance of the pension fund is as follows,
Sp
Rp R f
,
where: Sp = Sharpe Portfolio Index; Rp =total return of the asset portfolio for a certain period; Rf = the average of risk-free rate
of return for a certain period; σ = standard deviation of an asset portfolio returns for a certain period; Rp – Rf = the excess return
(premium risk) of an asset portofolio. Asset allocation is defined as the formation of asset class weights or the class weight of
passive assets, Sharpe (1991) which is the process of distributing investment capital into various asset classes and is one of the
most important decisions for investors. The ultimate goal of asset allocation is to build an optimal portfolio by paying attention
to several predetermined objectives. Asset allocation was analyzed by using 4 variables, namely: x1 = bi1f1t = asset allocation
for shares, x2 = bi2f2t asset allocation for bonds, x3 = bi3f3t, asset allocation for assets and x4 = bi4f4t and asset allocation for
deposits. The formula of asset class factor model (Sharpe et al., 1995) is as follows:
Rit = [bi1F1t + bi2F12 + bi3F3t ] + Ɛit,
where: Rit = asset return of i in period t; bi1 = proportion of asset funds of i for asset allocation, namely Shares; F1t = the return
obtained from the asset class 1 index, namely JCI in period t; bi2 = proportion of asset funds of i for asset allocation 2, namely
bonds; f2t = return obtained from the asset class index 2, namely the bond index in period t; bi3 = proportion of asset funds of i
for asset allocation 3, namely mutual funds; f3t = return obtained from asset class index 3, namely index fund in period t; bi4 =
proportion of asset funds of i for asset allocation 4, namely deposits; F4t = return obtained from asset class 4 index, namely BI
Rate in period t; Ɛit = error term (selection of securities). Board size has proven to have a material impact on the quality of
corporate governance. Some studies support the idea that large boards can be dysfunctional. Hermalin and Weisbach (2001)
believed that board size is a proxy for board activity which explains why small board sizes are better than larger ones which
might be disrupted by outsiders and monitoring problems. Institutional ownership is the ownership of share company by
financial institutions such as insurance companies, banks, pension funds and investment banking. This variable is measured by
dividing the percentage of the number of institutional ownerships from the number of shares outstanding (Beiner et al., 2004).
Dahlquist et al. (2000) claimed that the higher the level of portfolio turnover, the greater the return that might be obtained.
Grinblatt and Titman (1994) added that the effect of turnover coefficient shows a superior performance, indirectly showing that
managers who have a better performance are those who trade more to benefit from the superior information they have. The
Formula of Portfolio Turnover.
The smallest purchase
.
The asset average
Nyaga (2014) stated that portfolio diversification is the activity of spreading money among investors and among many different
investment choices. Portfolio risk is the opportunity to combine assets or units in groups of investment individuals who fail to
meet financial goals. In the theory, portfolio risk can be eliminated by successful diversification. Ahuja (2015) conducted a
research by establishing a securities portfolio with a weighted average and then gradually, many random securities were added
by entering the portfolio up to 62 data securities obtained from the daily closing price of Nairobi Stock Exchange for the past 3
years. The results showed that a portfolio of 7 securities with the same weight could avoid a significant amount of securities in
a large number of securities whose returns were mixed. By using a single index model formula, the portfolio risk (variance) is
like this following equation:
6
3.6. Data Analysis Method
Path analysis is an extension of multiple regression analysis and allows the testing by using the intervening variable (Ghozali,
2011), while LISREL (linear structural relationship) program is used to test the significance because it is the only SEM program
that can estimate various SEM problems, and is the most informative program in presenting statistical results (Imam 2005). In
this study, the effect of the variable of allocation asset (AA), portfolio turnover (PTO), board size (BS), institutional ownership
(IO) and diversification (DEVR) on portfolio performance (KP) would be analyzed by using Structural Equation Modeling
analysis techniques (path). The stages in the path analysis included the prerequisite test path analysis and the structural model
testing. Several requirements that must be fulfilled in the path analysis included requirements for normality, the absence of
outliers and the absence of multicollinearity between independent variables in the model.
4. Analysis and Results
4.1. Descriptive Statistic Analysis
Before testing the hypothesis, the distribution of the values of each variable was elaborated. Descriptive statistical analysis was
used to see the description of the data. In this study, the data description included the asset allocation strategy, PTO, board size,
institutional investor and diversification (DEVR) data and the DPPK registered in the OJK in 2016 - 2018. The results of
descriptive statistics are presented as follows:
Table 1
Descriptive Statistics
N
192
192
192
192
192
192
192
Asset Allocation (AA)
PortfolioTurnover (PTO)
Board size (BS)
Institutional Ownership (IO)
Diversification (DEVR)
Sharpe Ratio (SR)
Valid N (listwise)
Min
-.05477
.00000
2.00
.00
-.0013
-.6818
Max
.16285
.21117
7.00
29.50
.0065
1.1667
Mean
.0743177
.0030239
3.1875
13.8487
.001844
.269129
Std. Dev
.02888381
.02146668
1.16054
6.24208
.0010319
.2545368
4.2. Normality Test
Normality test in the path analysis is intended to determine the normal distribution of the research for each variable. A normality
evaluation is done by the value of skewness and kurtosis of the data on each variable. Curran et al. (1996) in Ghozali (2016) has
a rule of thumb that can help in giving a judgment about the data normality. If the data has a skewness value of <2, then the data
is declared to be normally distributed. If the skewness value is between 2–3, then it is declared to be moderately normal, and if
the data has skewness of > 3, then it is stated that the data is not normal. Furthermore, on the value of kurtosis, the data are
declared normal if they have kurtosis of <7.If the value of kurtosis is between 7-21, the data is stated to be moderately normal
distributed and if the data has kurtosis of > 21, then the data is declared to be not normally distributed. The following are the
results of the normality test on the model:
Table 2
The Result of Normality Test
Variable
AA
BS
IO
DEVR
KP
Skewness
Z-score
0.004
2.013
0.029
0.046
0.000
Kurtosis
p-value
0.996
0.044
0.977
0.965
1.000
Z-score
0.152
-1.900
-0.096
0.331
0.102
p-value
0.879
0.057
0.924
0.741
0.919
Skewness and Kurtosis
Chi-square
p-value
0.023
0.989
7.664
0.022
0.010
0.995
0.112
0.946
0.010
0.995
The results of the normality test indicate that the data on each variable has the required value of skewness and kurtosis.
Therefore, it can be concluded that all data in the research variables are normally distributed.
4.3. Multicollinearity Test
Multicollinearity test was done by looking at the correlation value between the exogenous variables. The model is declared free
from multicollinearity if the correlation value between exogenous variables is <0.9. The results of the multicollinearity test in
Table 4.3 show that there are no exogenous variables that have a correlation of > 0.9. This indicated that there is no
multicollinearity in the path model.
S. Wahyudi et al. /Accounting 6 (2020)
7
Table 3
The Result of Multicollinearity Test
KP
AA
PTO
BS
IO
DEVR
KP
1.00
0.39
0.02
-0.07
0.19
0.28
AA
PTO
BS
IO
DEVR
1.00
0.11
0.05
0.04
0.15
1.00
0.03
-0.05
0.00
1.00
-0.12
-0.06
1.00
0.09
1.00
4.4. Compatibility of Path Analysis Model
The compatibility test of the structural model in path analysis was carried out by looking at several criteria of Goodness of fit
model such as Chi Square values, probability, df, GFI, AGFI, TLI, CFI RMSEA and RMR. In this test, the path analysis model
is stated to have met the Goodness of fit model criteria if the model has fulfilled one of the assumptions contained in the table
above. Stated that if there are one or two goodness-of-fit criteria that have met, then it can be said that the model is well
developed. In Ghozali (2011), it is stated that the path analysis model that has a probability value of > 0.05 is considered to have
the same covariance matrix as the population covariance matrix, so that it can show the actual population conditions. The
following are the results of the compatibility test path analysis model:
Table 4
The Result of Goodness of Fit Model Test
Indicators of Fit Model
Chi-Squareand probability
Minimum Fit Function Chi-Square
Normal Theory Weighted Least Square Chi-Square
Goodness of Fit Index (GFI)
Adjusted Goodness of Fit Index (AGFI)
Parsimony Goodness of Fit Index (PGFI)
Root Mean Square Error of Approximation (RMSEA)
P-Value fot test of Close Fit (RMSEA)
1. Ecpected Cross Validation Index (ECVI)
2. ECVI for Saturated Model
3. ECVI for Independence Model
Akaike’s information criterion (AIC) and CAIC:
Model AIC
Independence AIC
Saturated AIC
Model CAIC
Independen CAIC
Saturated AIC
Fit Index:
Normed Fit Index (NNFI)
Comparative Fit Index (CFI)
Incremental Fit Index (IFI)
Relative Fit Index (RFI)
Value
P=0.696
P=0.696
0.999
0.981
0.0444
0.00
0.793
0.478
0.489
1.591
86.724
323.43
90
269.798
331.072
281.587
Cutt-off
P > 0.05
P > 0.05
> 0.9
> 0.9
> 0.05
< 0.014
> 0.05
ECVI
(0.478)
saturated
(0.489)model
ECVI (0.48)
Saturated AIC(90)
2. Model CAIC
(269.798)
0.997
1
1.005
0.952
≥ 0.9
≥ 0.95
≥ 0.9
≥ 0.9
Conclusion
Fit
Fit
Fit
Fit
Not Fit
Fit
Fit
Fit
Fit
Fit
Fit
Fit
Fit
Fit
Fit
Fit
Based on the figure above, the model has a probability above 0.05 (prob = 1.00). Thus, the model has been used properly to test
the hypothesis in this study.
4.5. Hypothesis Test
Testing hypothesis through a significance test aims to examine whether there is a significant effect of independent variables on
the dependent variable. The hypotheses developed in this test are as follows:
Ho: There is no significant effect of independent variables on the dependent variable
Ha: There is a significant effect of independent variables on the dependent variable
With a significant level of 0.05, Ho will be rejected if the value of t count is > 1.96, and if the significant value t-count is <1.96,
then Ho is not rejected.
8
Fig. 2. The Result of Significance Test
Hypothesis 1 states that Asset Allocation has a positive and significant effect on Sharpe ratio performance. The value of the p
value of the asset allocation variable on portfolio performance (AA → KP) is significant with a positive t count of 5.24. The t
value of the statistic is above the critical value of 1.96 which indicates that the influence between asset allocation on Sharpe
Ratio is considered positive and significant. Therefore, Ho is rejected and it is concluded that asset allocation has a positive and
significant effect on portfolio performance. The better the allocation asset, the better the performance of the company's portfolio,
and vice versa. This means that the hypothesis stating that there is a positive and significant effect between asset allocation on
the performance of Sharpe Ratio is accepted.
Hypothesis 2 states that the portfolio turnover has a positive and not significant relationship to the performance of Sharpe Ratio.
The value of the p value influencing portfolio turnover variable on portfolio performance (PTO → KP) is significant with a
negative t count of -0.10. As the value of t count is negative and it is <1.96, then Ho is not rejected and it is concluded that the
portfolio turnover does not significantly influence portfolio performance. Therefore, the second hypothesis is rejected. This
means that the hypothesis stating that there is no positive and significant effect between portfolio turnover on the portfolio
investment (Sharpe Ratio) performance.
The third hypothesis states that the Board size has a positive influence on the performance of Sharpe Ratio. The value of the p
value influencing the board size variable on portfolio performance (BS → KP) is significant with a negative t count of -0.85.
Therefore, the value of t count is negative and is <1.96. The t-value of these statistics is below the critical value of 1.96.
Therefore, Ho is not rejected and it is concluded that the board size does not significantly influence portfolio performance. This
shows that the influence between board size on the performance of portfolio investment (Sharpe Ratio), in terms of population,
has a negative and insignificant effect. This means that the hypothesis stating that there is a positive effect between the board
size on the performance of the investment portfolio (Sharpe Ratio) is rejected.
Hypothesis 4 states that institutional ownership has a positive and significant effect on Sharpe Ratio. The value of the p value
influencing the institutional variable ownership on portfolio performance (IO → KP) is significant with a positive t count of
2.29. As the value of t count is positive and is > 1.96, then the Ho is rejected. It’s also concluded that institutional ownership
has a positive and significant effect on portfolio performance. The better the institutional ownership, the better the performance
of the company's portfolio would be, and vice versa. This shows that the influence of institutional ownership on the performance
of Sharpe Ratio is considered positive and significant. This means that the hypothesis which states that there is an effect between
institutional ownership and the performance of investment portfolios (Sharpe Ratio) is accepted.
Hypothesis 5 states that diversification has a positive and significant influence on the performance of Sharpe Ratio. The value
of p value influencing the Diversification variable on portfolio performance (DEVR → KP) is significant with a positive t count
of 3.18. Therefore, the value of t count is positive and is > 1.96. This shows that the influence between diversification on Sharpe
Ratio performance is considered positive and significant. Thus, the Ho is rejected and it can be concluded that diversification
has a positive and significant effect on portfolio performance. The higher the diversification, the better the performance of the
company's portfolio would be, and vice versa. This means that the hypothesis which states that there is a positive effect between
diversification on the performance of investment portfolios (Sharpe Ratio) is accepted.
S. Wahyudi et al. /Accounting 6 (2020)
9
4.6. Path Coefficient
Path coefficient shows the influence of each research variable on portfolio performance.
Fig. 3. The Result of Estimated Path Coefficients
Based on the results of the path coefficient estimation in the figure above, the asset allocation variable (AA) path coefficient for
portfolio performance (PTO) is 0.35, then the IO variable path coefficient is 0.15 and the DEVR variable path coefficient is
equal to 0.21. This shows that out of the 3 variables that proved to have a significant effect on portfolio performance, the asset
allocation variable is the variable that has the greatest influence on portfolio performance.
4.7. Structural Equation
Structural equation is one of the results of path analysis that shows the relationship between variables shown in the equation.
Based on the results of the path analysis above, the structural equations obtained between the research variables is as follows:
KP = 0.045 + 3.22 AA - 1.61 PTO - 0.012 BS + 0.006 IO + 4959 DEVR
where: KP = Portfolio Performance; AA = Allocation Assets; PTO = Portfolio Turnover; BS = Board Size; IO = Institutional
Ownership; DEVR = Diversification
4.8. Determinant Coefficient
In the path analysis, the R square shows the amount of contribution given by all independent variables to the dependent variable.
The results of the path analysis in the picture above shows that the R square model value obtained is 0.23.This shows that the
amount of contribution given by asset allocation variables, portfolio turnover, board size, institutional ownership and
diversification of portfolio performance is 23 %, while the remaining 77% of the portfolio performance variance is influenced
by other factors beyond the asset allocation, portfolio turnover, board size, institutional ownership and diversification.
5. Discussion and Conclusion
The results of the study prove that the asset allocation strategy implemented by pension funds for the period of 2014-2016, on
average, has proven the performance of asset pension funds seen from the average return of 7.4 percent with a minimum value
of -5.5% and a maximum value of 16.29 %. Further, out of 192 data observed in this study, it turned out that there were only
few performances of asset allocation and the performance of the sharpe ratio which were underperformed. The asset allocation
strategy determined how much funds placed in the asset class that had been determined according to the risk profile of a security.
The asset allocation was very instrumental in determining the performance of investment portfolios and it was in accordance
with previous researches (Avramov & Wermers 2006; Blitz & De Groot 2014; Brinson et al. 1991; Drobetz & Köhler 2002;
10
Ibbotson & Kaplan 2000; Santacruz 2011). Furthermore, fund managers are required to be more active in using skills to manage
the risk of their portfolios as the higher the level of portfolio coverage, the greater the return that might be obtained (Grinblatt
and Titman 1994). The result of testing this hypothesis is that the active investment style (portfolio turnover) causes the
opportunity to obtain returns from buying and selling transactions of stocks, bonds and mutual funds, even though it directly
has a positive effect on improving performance but it is still low. However, this study had not found enough evidence to support
that the board size as a proxy of corporate governance was able to influence the performance of the investment portfolio. The
role of Board size in this study did not have a meaningful influence in improving the performance of investment portfolios. This
also indicated that it did not support researches (Del Guercio et al., 2003; Tufano & Sevick 1997) stating that small boards had
a more direct impact on performance because they negotiated cheaper fund management contracts. Jensen (1993) stated that
board size and board composition are often common corporate governance problems, because the benefits of increased
monitoring that follow a larger board are comparable to the weak communication and decision making of larger groups.
Institutional ownership variable has a positive and significant effect on portfolio performance. This is proven thus the hypothesis
is accepted. The results of this study indicate that institutional ownership has a positive and significant effect on portfolio
performance. This hypothesis refers to several previous studies, namely (Cheung et al., 2009; Elyasiani & Jia 2008; Giannetti
& Laeven, 2008; Cornett et al., 2007; Wahab et al., 2008). Finally, diversification is directed at achieving an increase in the
performance of the investment portfolio. These results are in accordance with the results of the study by Daza and Contzen
(2009) which concluded that portfolios were equivalent to market portfolios and could be done by mixing two risky assets and
each portfolio has β ≠ 0; this alternative portfolio has zero risk and average profit equals risk-free assets. The purpose of this
research was how to reduce risk by making diversification in the portfolio.
5.1. Conclusion
This study aimed to analyze the ability to determine the weight of securities of stocks, bonds, mutual funds, and deposits based
on asset allocation (AA) variables, portfolio turnover (PTO), board size (BS), institutional ownership (IO) and diversification
(DEVR)on portfolio performance (KP). Hypothesis testing aims to determine the effect of significance (meaningful influence)
and non-significant effects (influences that are not meaningful or have no effect). The asset allocation strategy had a positive
effect on the performance of the investment portfolio. This showed that the better the asset allocation strategy - namely asset
allocation which reflects a good return by referring to the return of past assets such as stocks, bonds, mutual funds and deposits
as based on the principle of “high risk, high return” - the better the portfolio performance would be. Institutional ownership had
a positive and significant effect on portfolio performance which was true thus making the hypothesis to be accepted. The results
of this study indicated that institutional ownership had a positive and significant effect on portfolio performance. Diversification
had a positive effect on the performance of the investment a portfolio which was also true and supported researches stating that
return-based diversification had a positive and significant effect on portfolio performance. Therefore, the hypothesis is accepted.
This gives an emphasize that diversification could reduce risk with a certain level of return. Therefore, as long as the investment
manager was aware of the risks, they could have proper control and diversification could help reducing the overall risk of the
active strategy portfolio. However, this study resulted in the portfolio turnover which did not have a positive effect on the
performance of investment portfolios. This emphasized the results of research stating that portfolio turnover had a positive and
significant effect on portfolio performance. Therefore, the hypothesis is rejected. Similarly, a hypothesis stating that the board
size had a positive effect on portfolio performance was not proven. Therefore, the hypothesis is rejected. The results of this
study indicated that the board size had no effect with a negative and not significant regression coefficient on the performance
of the investment portfolio.
5.2. Theoretical and Managerial Implication
The results of the hypothesis testing proved that the asset allocation strategy had a positive and significant effect on portfolio
performance, which meant that the better the asset allocation strategy based on the principle of “high risk, high return”, the
better the portfolio performance would be. The results of this study are consistent with the modern portfolio theory paradigm
introduced by Markowitz(1952a) mentioning that the application of optimal portfolio formation is a balance between expected
returns on the magnitude of the risk that will occur. The managerial implication of this study is that the asset allocation strategy
has a positive and significant effect on portfolio performance, indicating that the asset allocation strategy in the research period
is able to improve the performance of investment portfolios and ultimately improve the performance of the pension fund
investment portfolio. Therefore, the asset allocation can be maintained to improve the performance.
5.3. Research Limitations and Suggestions for Future Researches
This research used data in the form of cross-sectional and times series data. The limitations of this study are in obtaining
complete information from financial service authorities that do not include the name of pension funds. Therefore, the researchers
looked for other places both through the Association of pension funds and by telephone on each pension fund. This research
S. Wahyudi et al. /Accounting 6 (2020)
11
was conducted in a relatively limited time so that it did not get the complete information needed in this study. Henceforth, future
researchers are recommended to have more complete information and sufficient times to obtain the data from the Financial
Services Authority (OJK) and each pension fund provider.
References
Agrawal, A., & Knoeber, C. R. (1996). Firm performance and mechanisms to control agency problems between managers and
shareholders. Journal of Financial and Quantitative Analysis, 31(3), 377-397.
Ahuja, A. (2015). Portfolio diversification in the Karachi Stock Exchange. Pakistan Journal of Engineering, Technology &
Science, 1(1).
Alexeev, V., & Tapon, F. (2012). Equity portfolio diversification: how many stocks are enough? evidence from five developed
markets. Evidence from Five Developed Markets (November 28, 2012). FIRN Research Paper.
Asher, M. G. (2008). Social security reform imperatives in developing Asia. The Indian Economic Journal, 56(1),112-123.
Avramov, D., & R. Wermers. (2006). Investing in mutual funds when returns are predictable. Journal of Financial Economics
81(2), 339-377.
Beiner, S., Drobetz, W., Schmid, F., & Zimmermann, H. (2004). Is board size an independent corporate governance
mechanism?. Kyklos, 57(3), 327-356.
Besley, T. J., & Prat, A. (2003). Pension fund governance and the choice between defined benefit and defined contribution
plans.
Blitz, D., & De Groot, W. (2014). Strategic allocation to commodity factor premiums. The Journal of Alternative
Investments, 17(2), 103-115.
Bodie, Z., & Merton, R. C. (2002). International pension swaps. Journal of Pension Economics & Finance, 1(1), 77-83.
Brennan, M. J., Schwartz, E. S., & Lagnado, R. (1997). Strategic asset allocation. Journal of Economic Dynamics and Control
21(8-9), 1377-1403.
Brinson, G. P., Hood, L. R., & Beebower, G. L. (1986). Determinants of portfolio performance. Financial Analysts
Journal, 42(4), 39-44.
Brinson, G. P., Singer, B. D., & Beebower, G. L. (1991). Determinants of portfolio performance II: An update. Financial
Analysts Journal, 47(3), 40-48.
Carter, C. B., & Lorsch, J. W. (2003). Back to the drawing board: Designing corporate boards for a complex world. Harvard
Business Press.
Cheung, W., Fung, S., & Tsai, S. C. (2009). The impacts of managerial and institutional ownership on firm performance: The
role of stock price informativeness and corporate governance. Corporate Ownership and Control, 6(4), 115.
Claessens, S., Djankov, S., & Lang, L. H. (2000). The separation of ownership and control in East Asian corporations. Journal
of Financial Economics, 58(1-2), 81-112.
Core, J. E., Holthausen, R. W., & Larcker, D. F. (1999). Corporate governance, chief executive officer compensation, and firm
performance. Journal of Financial Economics, 51(3), 371-406.
Curran, P. J., West, S. G., & Finch, J. F. (1996). The robustness of test statistics to nonnormality and specification error in
confirmatory factor analysis. Psychological Methods, 1(1), 16.
Cornett, M. M., Marcus, A. J., Saunders, A., & Tehranian, H. (2007). The impact of institutional ownership on corporate
operating performance. Journal of Banking & Finance, 31(6), 1771-1794.
Dahlquist, M., Engström, S., & Söderlind, P. (2000). Performance and characteristics of Swedish mutual funds. Journal of
Financial and Quantitative Analysis, 35(3), 409-423.
Daza, J., & Contzen, M. (2009). A risk-free portfolio with risky assets. International Research Journal of Finance and
Economics, 32, 1450-2887.
Del Guercio, D., Dann, L. Y., & Partch, M. M. (2003). Governance and boards of directors in closed-end investment
companies. Journal of Financial Economics, 69(1), 111-152.
Drobetz, W., & Köhler, F. (2002). The contribution of asset allocation policy to portfolio performance. Financial Markets and
Portfolio Management, 16(2), 219.
Elyasiani, E., & Jia, J. J. (2008). Institutional ownership stability and BHC performance. Journal of Banking & Finance, 32(9),
1767-1781.
Faccio, M., & Lang, L. H. (2002). The ultimate ownership of Western European corporations. Journal of Financial
Economics, 65(3), 365-395.
Fama, E. F., & Jensen, M. C. (1983). Agency problems and residual claims. The journal of law and Economics, 26(2), 327-349.
Ferdinand, A. (2006). Structural Equation Modelling dalam Penelitian Manajemen: Badan Penerbit Universitas Diponegoro,
Semarang.
Ferris, S. P., Jagannathan, M., & Pritchard, A. C. (2003). Too busy to mind the business? Monitoring by directors with multiple
board appointments. The Journal of Finance, 58(3), 1087-1111.
Fuerst, O., & Kang, S. H. (2004). Corporate governance, expected operating performance, and pricing. Corporate Governance,
Expected Operating Performance, and Pricing.” Corporate Ownership and Control, 1(2), 13-30.
12
Ghozali, I. (2009). Aplikasi Multivariate Program SPSS: Universitas Diponegoro, Semarang.
Ghozali, I. (2011). Aplikasi Analisis Multivariate Dengan Program SPSS: BP Universitas Diponegoro.
Ghozali, I. (2016). Aplikasi Analisis Multivariete dengan Program IBM SPSS 23, Edisi Delapan. Penerbit Universitas
Diponogoro. Semarang.
Giannetti, M., & Laeven, L. (2008). Pension reform, ownership structure, and corporate governance: Evidence from a natural
experiment. The Review of Financial Studies, 22(10), 4091-4127.
Grinblatt, M., & Titman, S. (1994). A study of monthly mutual fund returns and performance evaluation techniques. Journal of
Financial and Quantitative Analysis, 29(3), 419-444.
Hair, J. F., W. C. Black, Babin, B. J., & Anderson, R. E. (2010). Multivariate data analysis. Global edition: Pearson Higher
Education Upper Saddle River, NJ.
Hauss, H. (2004). The role of international property investments in the global asset allocation process. Australian Property
Journal, 38(3), 198.
Hermalin, B. E., & Weisbach, M. S. (2001). Boards of directors as an endogenously determined institution: A survey of the
economic literature: National Bureau of Economic Research.
Hilsted, J. C. (2012). Active Portfolio Management and Portfolio Construction. Unpublished Master’s Thesis.
Ibbotson, R. G., & Kaplan, P. D. (2000). Does asset allocation policy explain 40, 90, or 100 percent of performance? Financial
Analysts Journal, 56(1), 26-33.
Imam, G. (2005). Aplikasi analisis multivariate dengan program SPSS. Semarang: Badan Penerbit Universitas Diponegoro.
Jensen, M. C. (1968). The performance of mutual funds in the period 1945–1964. The Journal of Finance, 23(2), 389-416.
Jensen, M. C. (1993). The modern industrial revolution, exit, and the failure of internal control systems. The Journal of Finance,
48(3), 831-880.
Jensen, M. C., & Meckling, W. H. (1976). Theory of the firm: Managerial behavior, agency costs and ownership structure.
Journal of Financial Economics, 3(4), 305-360.
Kim, H., & Lim, C. (2010). Diversity, outside directors and firm valuation: Korean evidence. Journal of Business Research, 63
(3), 284-291.
Kumara, A. S., & Pfau, W. (2012). REFORMING PENSION FUNDS IN SRI LANKA: INTERNATIONAL
DIVERSIFICATION AND THE EMPLOYEES'PROVIDENT FUND. Australian Economic Papers, 51(1), 23-37..
Markowitz, H. (1952). Portfolio selection. The Journal of Finance, 7(1), 77-91.
Masulis, R. W., Pham, P. K., & Zein, J. (2011). Family business groups around the world: Financing advantages, control
motivations, and organizational choices. The Review of Financial Studies, 24(11), 3556-3600.
Nyaga, M. M. (2014). The effects of diversification on portfolio risk at the nairobi securities exchange.
Roy, A. D. (1952). Safety first and the holding of assets. Econometrica: Journal of the Econometric Society, 20(3), 431-449.
Santacruz, L. (2011). Strategic asset allocation and portfolio performance. Journal of Management Research, 1(2).
Sharpe, W. F. (1991). The Arithmetic of Active Management. Financial Analysts Journal, 47(1), 7-9.
Sharpe, W. F., Alexander, G. J., & Bailey, J. (1995). Investments prentice hall. Englewood Cliffs, New Jersey 7632.
Shleifer, A., La Porta, R., & Lopez-De-Silanes, F. (1999). Corporate ownership around the world. Journal of Finance, 54(2),
471-517.
Shleifer, A., & Vishny, R. W. (1997). A survey of corporate governance. The Journal of Finance 52(2), 737-783.
Siallagan, H., & Machfoedz, M. U. (2006). Mekanisme corporate governance, kualitas laba dan nilai perusahaan. Simposium
Nasional Akuntansi IX. Padang, 23-26.
Solnik, B., & McLeavey, D. (2013). Global Investments. Pearson New International Edition: Pearson Higher Ed.
Solomon, J. (2007). Corporate governance and accountability. John Wiley & Sons.
Taylor, S. (2010). Financial Planning in Australia. 4th ed., Chatswood ed.
Tufano, P., & Sevick, M. (1997). Board structure and fee-setting in the US mutual fund industry. Journal of Financial
Economics, 46(3), 321-355.
Wahab, E. A. A., How, J., & Verhoeven, P. (2008). Corporate governance and institutional investors: evidence from
Malaysia. Asian Academy of Management Journal of Accounting and Finance, 4(2), 67-90.
Yermack, D. (1996). Higher market valuation of companies with a small board of directors. Journal of Financial
Economics, 40(2), 185-211.
© 2020 by the authors; licensee Growing Science, Canada. This is an open access article distributed
under the terms and conditions of the Creative Commons Attribution (CC-BY) license
( />