Impact of LOD score and recombination frequencies on the microsatellite marker based linkage map for drought tolerance in Kharif rice of Assam
Bạn đang xem bản rút gọn của tài liệu. Xem và tải ngay bản đầy đủ của tài liệu tại đây (231.52 KB, 6 trang )
Int.J.Curr.Microbiol.App.Sci (2018) 7(8): 3299-3304
International Journal of Current Microbiology and Applied Sciences
ISSN: 2319-7706 Volume 7 Number 08 (2018)
Journal homepage:
Original Research Article
/>
Impact of LOD Score and Recombination Frequencies on the Microsatellite
Marker Based Linkage Map for Drought Tolerance in Kharif Rice of Assam
Jyoti Prakash Sahoo1* and Vinay Sharma2
1
Department of Agricultural Biotechnology, OUAT, Bhubaneswar, India
2
Department of Agricultural Biotechnology, AAU, Jorhat, India
*Corresponding author
ABSTRACT
Keywords
Drought, Join Map 4.0,
LOD Score, Mapping
Population, SCL Values,
SSR
Article Info
Accepted:
20 July 2018
Available Online:
10 August 2018
Intermittent drought stress in rainfed ecosystem significantly limits the production of
Ranjit, the most predominant high yielding rice variety of North East India. In order to
understand the genetic basis of drought tolerance a mapping population comprising 85 F4
individuals between ‘Ranjit’ and a drought tolerant cultivar, ARC10372 was developed
and genotyped with 80 microsatellite markers. 7 possible linkage groups were analysed by
changing the LOD values and the recombination frequencies in the Join map 4.0 software
package. Only 3 linkage groups were considered out of the 7 linkage groups as the map
was calculated at LOD threshold 3.0 and above. It could be concluded that, higher critical
LOD values will result in more number of fragmented linkage groups, each with smaller
number of markers while small LOD values will tend to create few linkage groups with
large number of markers per group.
Introduction
Rice is one of the most widely grown cereal
crops in the world and is the staple food of
more of the world's population (Chen et al.,
2013). In 2008, a total of 661 million tons of
rice was produced from 155.7 million ha
(IRRI, 2009). Rice is cultivated in a wide
range of environments such as irrigated,
rainfed upland, rainfed lowland, flooded and
saline, and it faces multiple biotic and abiotic
challenges. According to the USDA reports, in
2008, more than 430 million metric tons of
rice was consumed worldwide and about 3.5
billion people depend on rice for more than 20
per cent of their daily calories. It is estimated
that the demand for rice will be 2,000 million
metric tons by 2030 due to population
increment (FAO, 2002) and according to
another report, production of rice must
increase by 60 per cent by the end of 2025
(Chen et al., 2013).
Drought mitigation in rice production to
ensure food security to the rising population in
Asia can be achieved through development of
drought-tolerant rice varieties with higher
yields. In Asia, drought stress is a major threat
to both rainfed lowland (46 Mha) and upland
(10 Mha) rice production, affecting the yield
stability (Pandey et al., 2007). In Assam, total
cultivated area is approx. 30 lakh hectares.
Among them 23.24 lakh hectares of land is
under paddy cultivation and usually most of
3299
Int.J.Curr.Microbiol.App.Sci (2018) 7(8): 3299-3304
them are affected by intermittent drought
(Directorate of Economics and Statistics,
Government of Assam). Ranjit is the leading
variety of Assam which is a drought
susceptible high yielding variety. ARC 10372
is a drought tolerant moderately yielding
variety which matures earlier than the Ranjit.
Linkage analysis in a mapping population
derived from cross between Ranjit and ARC
10372 will help us to identify the genes
contributing to drought tolerance in rice and
their relative contribution to the very
important trait.
Materials and Methods
Plant Materials
The mapping population comprised 85 F4 lines
derived from a cross between Ranjit ×
ARC10372. ARC10372 was used as a drought
tolerant parent and a widely cultivated HY
rice variety of North East India, Ranjit was
used as the susceptible parent. The parents
were crossed to raise F1s. True F1s were
identified using polymorphic SSR marker and
selfed to raise the F2 plants. The F2 plants were
harvested and bulked to raise F3 population.
Seeds of 85 F3 lines were developed in this
way and the population was advanced to F4
generation which has been ultimately used as
mapping population in this study.
Genotyping and construction of genetic
linkage Map
Plant genomic DNA was extracted from
young leaf tissue for each of the 85 F4 lines
along with parents, as described in Gupta et
al., 2003. The quality of DNA extracted was
checked by electrophoreting the samples using
0.8 percent agarose gel and quantified using
Nanodrop® ND-1000 Spectrophotometer.
Polymerase chain reactions for SSR analysis
were carried out under standard conditions for
all the primer pairs using 1 U of Taq
polymerase with 1X polymerase chain
reaction buffer (100 mM Tris-HCl at pH 9,
500 mM KCl, and 15 mM MgCl2),
2.5mMdNTP, 3 mM MgCl2, 20pM of each
primer, and 50 ng of DNA template with a
final reaction volume of 10μL. The PCR
reactions were denatured at 940C for 5
minutes followed by 35 cycles of 940C for 1
minute, 550C for 1 minute and 720C for 1
minute.
The final extension was 720C for 5 minutes.
The amplified products were resolved in 3.5
percent agarose gel stained with ethidium
bromide. The polymorphic SSR markers
reported by Verma et al., 2017 were used for
genotyping of 85 F4 plants in order to study
the segregation pattern of markers.
Statistical analysis
The PCR fragments were scored for presence
and absence. Spurious and missing data were
repeated for verification. Chi-square test was
conducted to compute the segregation pattern
of each SSR marker against the expected ratio
in F4 generation at 0.01 probability level.
Linkage analysis was performed by using
JoinMap 4.0 (Stam et al., 1993) software.
Markers were assigned to linkage groups
using the odds ratios and grouping was done
by considering the SCL (Strongest cross link)
values. 7 possible linkage groups were
observed (Table 1).
The linkage parameters like weak linkages
with a recombination frequency larger than
0.45 or a LOD smaller than 0.05 or strong
linkages with a recombination frequency
smaller than 0.01 or a LOD larger than 10
were set in the calculation options along with
regression mapping algorithm of the software
programme. Kosambi’s mapping function was
selected and the LOD scores were changed
from 1.00 to 8.00 to calculate the map
distance.
3300
Int.J.Curr.Microbiol.App.Sci (2018) 7(8): 3299-3304
Results and Discussion
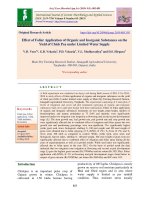
Increase in LOD threshold may decrease the
possibility of linkage group establishment. But
sufficient linkage was observed in the linkage
groups 2, 3, 4, 6 and 7 to get the map distance
at recombination frequency 0.40, 0.30 and
0.20. But Group 4, 6 and 7 were only
considered as the map was calculated at LOD
threshold 3.0 and above (Fig. 1). The markers
RM72, RM335 and RM25 were put to the
linkage group 2 of 35.6 mb length at LOD
threshold 1.0 and 2.0. As per earlier work,
RM25 was mapped on chromosome number 8
at a distance 38.1 mb (Cho et al., 1998) and
RM72 was mapped on chromosome number 8
at a distance 30.5 mb (www.gramene.org) and
our results are in agreement with these results.
However, the marker RM335 has been
mapped on chromosome number 4 at a
distance 5.4 mb (www.gramene.org), which is
in the linkage group with markers from
chromosome number 8 in the present study.
The map was calculated at LOD threshold 1.0
and 2.0, due to which RM335 came to this
group due to low stringency. This can also be
explained if there has been any chromosomal
translocation in the population under study.
This need to be verified by detailed wet-lab
experimentations. Similarly, in linkage group
3, markers RM209, RM202 and RM167 were
assigned to the map at 0, 28.7 and 51.9 mb
respectively at LOD threshold 1.0. As per
earlier work, all the markers RM209, RM167
and RM202 were mapped in chromosome 11
(Septiningsih et al., 2003; Xiao et al., 1998).
As such, the results of the present study are
more or less in agreement with earlier results.
In linkage group 4, the marker RM336 and
RM1132 were fall apart in 25.2 mb from each
other and the other marker RM182 was
assigned at 55.6 mb respectively. As per
earlier work, RM336 was mapped in
chromosome 7 at a distance 55.7, RM182 was
mapped in chromosome 7 at a distance 54.8
mb (IRGSP, 2005) and RM1132 was mapped
in chromosome 7 at a distance 23.9 mb
(Gramene Annotated Nipponbare Sequence,
2009). In group 6, the marker RM19629 and
RM253 were placed in a distance of 19.6 mb
and RM253 was mapped in chromosome 6 at
a distance 20.4 mb (Xiao et al., 1998). As
such, the results of the present study are in
agreement with earlier results.
Fig.1 Linkage groups according to LOD scores with ARC10372× Ranjit-F4 population (Left side
of bar represents position of marker in mb and right side of bar represents SSR markers)
3301
Int.J.Curr.Microbiol.App.Sci (2018) 7(8): 3299-3304
Table.1 Grouping based on LOD score showing SCL values
Nr
3
25
7
49
28
51
70
71
73
48
45
46
35
31
32
42
39
80
78
Group
1
1
1
2
2
2
3
3
3
4
4
4
5
5
5
6
6
7
7
Locus
RM24
RM273
RM5638
RM25
RM335
RM72
RM167
RM202
RM209
RM1132
RM182
RM336
RM141
RM169
RM249
RM19629
RM253
RM28519
RM519
Node
4.0/1(4)
4.0/1(4)
4.0/1(4)
4.0/2(3)
4.0/2(3)
4.0/2(3)
4.0/3(3)
4.0/3(3)
4.0/3(3)
4.0/4(3)
4.0/4(3)
4.0/4(3)
4.0/5(3)
4.0/5(3)
4.0/5(3)
4.0/6(2)
4.0/6(2)
4.0/7(2)
4.0/7(2)
SCL-Nr
4
4
4
47
39
15
72
43
4
70
24
30
72
18
34
18
19
76
53
In group 7, the markers (RM28519 and
RM519) were placed in 34.2 mb of length
from each other in the map. As per earlier
reports, both markers (RM28519 and RM519)
were mapped in chromosome 12 at a distance
19 mb and 23 mb respectively (Gramene
Annotated Nipponbare Sequence, 2009). So,
the present genetic map of rice can be used
further for introgression of various QTLs
identified under drought stress. To construct a
saturated linkage map, more number of
markers are required.
As less number of markers were found
polymorphic in the F4 mapping population,
the length of the linkage map as well as the
interval size between the markers were
reduced. Genetic maps with good genome
coverage and confidence in locus order
requires not only large numbers of DNA
markers, but also the analysis of large
numbers of individuals.
SCL-Locus
RM243
RM243
RM243
RM429
RM253
RM530
RM206
RM125
RM243
RM167
RM261
RM164
RM206
RM1256
RM574
RM1256
RM1352
RM235
RM256
SCL-Node
4.0/51(1)
4.0/51(1)
4.0/51(1)
4.0/36(1)
4.0/6(2)
4.0/14(1)
4.0/31(1)
4.0/34(1)
4.0/51(1)
4.0/3(3)
4.0/23(1)
4.0/27(1)
4.0/31(1)
4.0/17(1)
4.0/28(1)
4.0/17(1)
4.0/18(1)
4.0/13(1)
4.0/38(1)
SCL Value
2.3
1.6
3.0
1.9
1.3
1.3
2.2
2.6
1.8
1.8
1.2
1.3
2.1
3.1
3.9
2.5
2.1
3.1
2.8
Acknowledgements
The authors gratefully acknowledge the DBTAAU Centre and Dr. T. Ahmed, Chief
Scientist, RARS, Titabar for providing the
logistic support to the lab work and field
work.
References
Chen
M, Presting G, Barbazuk WB,
Goicoechea JL, Blackmon B, FangG, et
al., (2002). An integrated physical and
genetic map of the rice genome. Plant
Cell 14: 537–545.
Cho YG, Ishii T, Temmykh S, Chen X,
Lipovich L, McCouch SR, Park WD,
Ayres N, Cartinhour S (2000). Diversity
of microsatellites derived from genomic
libraries and gene bank sequences in
rice (Oryza sativa L.). Theor. Appl.
Genet. 100: 713–722.
3302
Int.J.Curr.Microbiol.App.Sci (2018) 7(8): 3299-3304
Gupta PK, Rustgi S, Sharma S, Singh R,
Kumar N, Balyan HS (2003)
Transferable EST-SSR markers for the
study of polymorphism and genetic
diversity in bread wheat. Mol Genet
Genomics 270(4): 315-323
Hackett CA, Broadfoot LB (2003) Effects of
genotyping errors, missing values and
segregation distortion in molecular
marker data on the construction of
linkage maps. Heredity 90(1):33-38
Hubert B, Rosegrant M, van Boekel MAJS,
Ortiz R (2010). The future of food:
scenarios for 2050. Crop Sci 50:S33–
S50
Irri, I (2002) Standard evaluation system for
rice. International Rice Research
Institute, Philippine
Kurata, N., Nagamura, Y., Yamamoto, K.,
Harushima, Y., Sue, N., Wu, J., and
Inoue, T. (1994). A 300 kilobase
interval genetic map of rice including
883 expressed sequences. Nature
genetics, 8(4), 365-372.
McCouch SR, Chen X, Panaud O, Temnykh
S, Xu Y, Cho Y, Huang N, Ishii T, Blair
M (1997) Microsatellite marker
development,mapping, and applications
in rice genetics and breeding. Plant Mol
Biol 35:89-99
McCouch SR, Doerge RW (1995) QTL
mapping in rice. Trends Genet 11:482487
McCouch, S.R., X. Chen, O. Panaud, S.
Temnykh, Y. Xu, Y. Cho, N. Huang, T.
Ishii and M. Blair, 1997. Microsatellite
marker development, mapping and
applications in rice genetics and
breeding. Plant MolBiol 35: 89–99.
N’Diaye, A., Haile, J. K., Fowler, D. B.,
Ammar, K., and Pozniak, C. J. (2017).
Effect of Co-segregating Markers on
High-Density Genetic Maps and
Prediction of Map Expansion Using
Machine
Learning
Algorithms.
Frontiers in Plant Science, 8, 1434.
O' Toole JC, Bland WL (1987). Genotypic
variation in crop plant root system. Adv
Agron 41: 91-145
Pandey S, Bhandari H: Drought: economic
costs and research implications. In
Drought frontiers in rice: crop
improvement for increased rainfed
production. Edited by: Serraj R, Bennett
J, Hardy B. World Scientific Publishing,
Singapore; 2009: 3-17.
Peng, S. et al., Rice yields decline with higher
night temperature from global warming.
Proc. Natl Acad. Sci. USA 101, 9971–9975 (2004).
Peng, S., Bouman, B., Visperas, R. M.,
Castañeda, A., Nie, L., and Park, H. K.
(2006). Comparison between aerobic
and flooded rice in the tropics:
agronomic performance in an eightseason experiment. Field Crops
Research, 96(2), 252-259.
Price AH, Courtois B (1999). Mapping QTLs
associated with drought resistance in
rice: progress, problems and prospects.
Plant Growth Regul, 29: 123-133.
Prince, S. J., Beena, R., Gomez, S. M.,
Senthivel, S., &Babu, R. C. (2015).
Mapping consistent rice (Oryza sativa
L.) yield QTLs under drought stress in
target rainfed environments. Rice, 8(1),
1.
Quillet MC, Madjidian N, Griveau Y, Serieys
H, Tersac M, Lorieux M, Berville A
(1995) Mapping genetic factors
controlling pollen viability in an
interspecific cross in Helianthus sect.
Helianthus.
Theor
Appl
Genet
91(8):1195-1202
Risch N (1992). Genetic linkage: Interpreting
LOD scores. Science255:803–804.
Semagn, K., Bjørnstad, Å. and Ndjiondjop,
M. N. (2006). Principles, requirements
and prospects of genetic mapping in
plants.
African
Journal
of
Biotechnology, 5(25).
3303
Int.J.Curr.Microbiol.App.Sci (2018) 7(8): 3299-3304
Septiningsih, E. M., Prasetiyono, J., Lubis, E.,
Tai, T. H., Tjubaryat, T., Moeljopawiro,
S., and McCouch, S. R. (2003).
Identification of quantitative trait loci
for yield and yield components in an
advanced backcross population derived
from the Oryza sativa variety IR64 and
the wild relative O. rufipogon.
Theoretical and applied genetics,
107(8), 1419-1432.
Servin B, Hospital F (2002) Optimal
positioning of markers to control
genetic background in marker-assisted
backcrossing. J Hered 93(3): 214-217
Stam P (1993a) Construction of integrated
genetic linkage maps by means of a new
computer package: JoinMap. Plant J 3:
739-744
Tao YZ, Henzell RG, Jordan DR, Butler DG,
Kelly AM, McIntyre CL (2000)
Identification of genomic regions
associated with stay green in sorghum
by
testing
RILs
in
multiple
environments. Theor Appl Genet 100:
1225-1232
The Arabidopsis Genome Initiative (2000).
Analysis of the genome sequence of the
flowering plant Arabidopsis thaliana.
Nature 408: 796-815.
The Rice Genome Sequencing Project (2005).
The map-based sequence of the rice
genome. Nature436: 793-800.
Van Ooijen JW, Voorrips RE (2001). Join
Map® 3.0, Software for the calculation
of genetic linkage maps. Plant Research
International,
Wageningen,
the
Netherlands.
Verma RK (2017). Mapping and dissection of
genetic effects into QTLs for grain yield
How to cite this article:
under drought in elite rice variety of
Assam. PhD Thesis, Assam Agricultural
University, Jorhat, India
Verma RK, Chetia SK, Dey PC, Baruah AR,
Modi MK (2017) Mapping of QTLs for
grain yield and its component traits
under drought stress in elite rice variety
of Assam. Int J Curr Microbiol App Sci
6: 1443-1455
Vision TJ, Brown DG, Shmoys DB, Durrett
RT, Tanksley SD (2000).Selective
mapping: a strategy for optimizing the
construction of high density linkage
maps. Genetics 155: 407–420.
Xiao, J., Li, J., Grandillo, S., Ahn, S. N.,
Yuan, L., Tanksley, S. D., and
McCouch, S. R. (1998). Identification
of trait-improving quantitative trait loci
alleles from a wild rice relative,
Oryzarufipogon. Genetics, 150(2), 899909.
Youens-Clark, K., Buckler, E., Casstevens,
T., Chen, C., DeClerck, G., Derwent, P.,
and Lu, J. (2010). Gramene database in
2010: updates and extensions. Nucleic
acids research, 39(suppl_1), D1085D1094.Sasaki, T., and Burr, B. (2000).
International Rice Genome Sequencing
Project: the effort to completely
sequence the rice genome. Current
opinion in plant biology, 3(2), 138-142.
Zivy M, Devaux P, Blaisonneau J, Jean R,
Thiellement H (1992) Segregation
distortion and linkage studies in
microspore-derived double haploid lines
of Hordeum Vulgare L. Theor Appl
Genet 83(6): 919-924
Jyoti Prakash Sahoo and Vinay Sharma. 2018. Impact of LOD Score and Recombination
Frequencies on the Microsatellite Marker Based Linkage Map for Drought Tolerance in Kharif
Rice of Assam. Int.J.Curr.Microbiol.App.Sci. 7(08): 3299-3304.
doi: />
3304