Optimization of media components for production of α-L-rhamnosidase from clavispora lusitaniae KF633446
Bạn đang xem bản rút gọn của tài liệu. Xem và tải ngay bản đầy đủ của tài liệu tại đây (625.45 KB, 13 trang )
Int.J.Curr.Microbiol.App.Sci (2018) 7(8): 2947-2959
International Journal of Current Microbiology and Applied Sciences
ISSN: 2319-7706 Volume 7 Number 08 (2018)
Journal homepage:
Original Research Article
/>
Optimization of Media Components for Production
of α-L-rhamnosidase from Clavispora lusitaniae KF633446
Pratiksha Singh1*, Param Pal Sahota2 and Rajesh Kumar Singh1
1
Agricultural College, State Key Laboratory of Subtropical Bioresources
Conservation and Utilization, Guangxi University, Nanning 530005, China
2
Punjab Agricultural University, Ludhiana-141004, India
*Corresponding author
ABSTRACT
Keywords
Rhamnosidase activity,
Clavispara lusitaniae,
Optimize, Response
surface methodology
Article Info
Accepted:
17 July 2018
Available Online:
10 August 2018
Rhamosidase producing yeast strain 84 was isolated from whey beverage and identified as
Clavispara lusitaniae KF633446. The effect of different carbon sources (rhamnose,
glycerol, lactose, fructose, glucose and sucrose), nitrogen sources (yeast extract, peptone,
ammonium chloride, ammonium sulphate, urea and casein), temperature (10-60°C) and pH
(3-8) were studied to optimize the production of rhamnosidase enzyme from Clavispara
lusitaniae 84. Further, a multivariate response surface methodology evaluated the effects
of different factors on enzyme activity and optimized enzyme production. The fit of the
model (R2= 0.409479) was found to be significant. Results indicated that yeast showing
maximum rhamnosidase activity (0.106 IU mL-1) in presence of rhamnose (0.6% w/v),
yeast extract (0.4% w/v), temperature (35±5 °C) and pH (4) in the minimal medium
supplemented with naringin (0.2% w/v).
Introduction
Many citrus juice processing has commercial
restrictions due to bitter taste by chemical
naringin. Many techniques are used to reduce
naringin such as adsorptive debittering
(Fayoux et al., 2007), enzymatic hydrolysis
(Puri and Kalra, 2005), poly-styrene divinyl
benzene styrene resin treatment and βcyclodextrin treatment (Mongkolkul et al.,
2006). These techniques have limitations in
altering nutrient composition by chemical
reactions or removal of nutrients, flavor and
color etc. In comparison, the enzymatic
debittering technology is regarded as the most
promising method with the advantages of high
specificity and efficiency and a convenient
operation for removing the bitterness in largescale commercial production (Yadav et al.,
2010).
α-L-Rhamnosidase is used for debittering the
citrus juice by hydrolyzing bitter naringin to
nonbitter prunin and rhamnose, resulting in a
taste improvement of citrus juice and derived
beverages. α-L-Rhamnosidase is produced by
many microorganisms mainly filamentous
fungi (Aspergillus, Circinella, Eurotium,
Fusarium,
Penicillium,
Rhizopus
and
Trichoderma) (Scaroni et al., 2002). In case of
yeast strains, low levels of rhamnosidase
activity have been reported (Rodriguez et al.,
2947
Int.J.Curr.Microbiol.App.Sci (2018) 7(8): 2947-2959
2004). Some yeast like Sacchromyces
cerevisiae, Hanshula anomala, Debaryomyces
polymorphus and Pichia angusta X 349
(Yanai and Sato, 2000) produce low level of
α-L-hamnosidase activity (McMahon et al.,
1999). Using rhamnosidase producing microorganism, the process of debittering is
economically viable and more cost effective
than other processes.
response
surface
design
when
the
experimental region is defined by the upper
and lower limits of each factor and not
extended beyond them (Neter et al., 1996). A
combination of factors generating a certain
optimal response can be identified. Also,
significant interactions between variables can
be identified and quantified by this approach
(Vishwanatha et al., 2010).
Media components play an important role in
enhancing
the
enzyme
production.
Rhamnosidase production mainly depends on
the inducer, carbon and nitrogen source given
to the microorganism. Reported inducers for
naringinase
production
are
rhamnose
(Thammawat et al., 2008), hesperidin
(Fukumoto and Okada, 1973), naringin (Bram
and Solomons, 1965; Puri et al., 2008) and
citrus peel powder (Puri et al., 2011).
Temperature is one of the most important
variable affecting enzyme deactivation by
weakening non-covalent interactions that
stabilize the protein structure and leading to
unfolding and subsequent changes that reduce
the catalytic activity (Klibanov, 1983), change
in the pH value can also irreversibly change
the protein structure by alteration of the
charge of the amino acid responsible for
maintenance of the secondary and tertiary
structure (Bisswanger, 1999). So, the
optimization of physical and nutritional
conditions is very essential.
Therefore, the paper aimed to optimize the
media composition to increase rhamnosidase
production
by
Clavispora
lusitaniae
KF633446.
Optimizing the affecting parameters by
statistical experimental designs can eliminate
the limitations of a single factor optimization
process collectively (Montogomery, 2000).
Response surface methodology (RSM) is a
useful
statistical
technique
for
the
investigation and optimization of complex
processes. It uses quantitative data from an
appropriate experimental design to determine
and simultaneously solve a multivariate
equation (Rastogi et al., 2010). Central
composite design (CCD) is a widely used
Materials and Methods
Microorganism and Growth Conditions
Yeast strain (84) producing rhamnosidase
enzyme was isolated from whey beverage and
identified as Clavispora lusitaniae (accession
number KF633446) on the basis of
morphological, biochemical and 18S rDNA
sequence analysis. The minimal medium (g/l:
glucose 5.0, Na2HPO4 6.0, KH2PO4 3.0 g L-1,
NH4Cl 1.0, NaCl 0.5, MgSO4 0.12, CaCl2 0.1,
naringin 2 and pH 6) was used for growth and
enzyme production. 50 mL of the resultant
medium in Erlenmeyer flask (100 ml) was
aerobically cultured at 28±2 °C for 1-4 d on a
rotary shaker at 150 rpm. After centrifugation
(12,000 × g, 4 °C, for 15 min), the supernatant
was collected to measure rhamnosidase
activity.
α-L- Rhamnosidase enzyme assay
The α-L-rhamnosidase activity (RA) was
determined
using
p-nitrophenyl-α-Lrhamnoside (p-NPR, Sigma) as the substrate
(Romero et al., 1985). The reaction mixture
consisted of 0.1 mL of 4.8 mM p-NPR
solution, plus 0.19 mL of 50 mM sodium
acetate/ acetic acid buffer, pH 5.0 and 10 µL
of enzyme or buffer (for the blank) and was
2948
Int.J.Curr.Microbiol.App.Sci (2018) 7(8): 2947-2959
incubated at 50 °C. Aliquots of 50 µL from
the reaction mixture were removed every 2
min and placed into 1.5 mL of 0.5 M NaOH.
These aliquots were kept in an ice bath until
the absorbance was measured at 400 nm
(Rajal et al., 2009). One unit (U) of enzyme
activity was defined as the amount of enzyme
required to release 1 μmol of p-nitrophenol per
minute.
Screening of media components for
optimization α-L- rhamnosidase production
The media composition was optimized
following „one-at-a-time‟ approach to increase
α-L-rhamnosidase production. Six different
carbon sources (glucose, lactose, sucrose,
glycerol, fructose and rhamnose) were added
individually at 5 gL-1 in the minimal medium
containing 0.2% naringin. Four organic
nitrogen sources (1 gL-1
peptone, yeast
extract, casein and urea) and two inorganic
nitrogen sources (1 gL-1 ammonium chloride
and ammonium sulphate) were also tested
individually one by one keeping another factor
constant. The effect of temperature in a range
between 15 to 45 °C and pH in a range of 3 to
8 on enzyme activity was examined. Further,
best carbon and nitrogen supplementation
were used at different concentrations from 0.1
to 1%. For each parameter optimization, three
sets of independent experiments were carried
out and the average value was reported (Chen
et al., 2010; Singh et al., 2012).
Experimental design
The statistical analysis of the results was
performed with the aid of “Design-Expert9.0.3” (Stat Ease, Inc., Minneapolis, USA). A
25 factorial central composite experimental
design, with four factors and five replicates at
the centre point, leading to a set of 30
experiments, was used to optimize the
production of rhamnosidase from yeast strain
84. All the variables were taken at a central
coded value considered as zero. The minimum
and maximum ranges of variables investigated
and the full experimental plan with respect to
their values in actual and coded form are listed
in Table 1. Upon completion of the
experiments,
the
average
maximum
rhamnosidase yield was taken as the
dependent variable or response (Y). A secondorder polynomial equation was then fitted to
the data by the multiple regression procedure.
This resulted in an empirical model that
related the response measured to the
independent variables of the experiment. For a
four-factor system, the model equation is:
Y = β0 + β1A + β2B + β3C + β4D + β12AB +
β13AC
Y = + β14AD + β23BC + β24BD + β34CD
Y = + β11A2 + β22B2 + β33C2 + β44D2
Where: A= rhamnose, B= yeast extract, C=
pH, D= incubation temperature (°C), Y=
predicted response, β0= intercept; β1, β2, β3
and β4= linear coefficients; β12, β13, β14, β23,
β24 and β34= interaction coefficients and β11,
β22, β33 and β44= squared coefficients.
Analysis of variance (ANOVA) was
performed. The proportion of variance
explained by the polynomial models obtained
was given by the multiple coefficient of
determination (R2). In order to confirm the
maximum rhamnosidase production predicted
by the model, three-dimensional response
surface and contour presentations were plotted
to find the concentration of each factor for
maximum rhamnosidase production. The
response surface curves were plotted for the
variation in rhamnosidase yield as a function
of the concentrations of one variable when all
the other factors were kept at their central
levels. The optimum concentration of each
nutrient was identified based on the peak in
the three dimensional plot (Singh et al., 2012).
2949
Int.J.Curr.Microbiol.App.Sci (2018) 7(8): 2947-2959
Statistical analysis
The data was analyzed by standard analysis of
variance (ANOVA) followed by Duncan‟s
Multiple Range Test (DMRT). Standard errors
were calculated for all mean values.
Differences were considered significant at the
p ≤ 0.05 level.
Results and Discussion
Screening of
optimization
production
media components for
of
α-L-rhamnosidase
Effect of carbon source
rhamnosidase production
on
α-L-
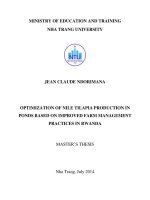
A differential response in rhamnosidase
activity was obtained due to supplementation
of various carbon sources. Among various
carbon sources, rhamnose exhibited maximum
enzyme activity i.e. 0.056 IU mL-1 and
glucose exhibited minimum rhamnosidase
activity i.e. 0.016 IU mL-1 after 48 h of
incubation (Fig. 1A). Further, optimization of
rhamnose concentration (0.1-1%-w/v), it was
found that Clavispora lusitaniae KF633446
produced maximum enzyme (0.065 IU mL-1)
when grown on medium containing 0.6%
rhamnose as compare to other concentrations
(Fig. 1E) Yeast strains Saccharomyces
cerevisiae, Cryptococcus terreus, Pichia
angusta and Pichia capsulate showed low
levels of α-L- rhamnosidase activity (IU mL-10.0137, 0.0065, 0.034 and 0.0288) in presence
of rhamnose as compare to present yeast strain
(Yanai and Sato, 2000).
Similar results was observed by Elinbaum et
al., 2002 that rhamnose could be used as an
inducer in the production of Aspergillus
terreus α-L-rhamnosidase by solid state
fermentation, however they reported that
naringin was a better inducer than rhamnose.
Puri et al., 2005 reported that naringinase
activity was repressed by glucose, sucrose and
lactose although these carbon sources
supported excellent growth. Production of αL-rhamnosidase by A. kawachii is mediated by
carbon catabolite repression (Koseki et al.,
2008). They found that α-L-rhamnosidase
production by A. kawachii was significantly
induced in presence of 0.5% L-rhamnose, but
the production was repressed in presence of
0.5% L-rhamnose supplemented with 1%
glucose and enzyme was not produced when
A. kawachii was grown on 0.5% glucose as the
sole carbon source. Puri et al., (2005)
observed rhamnose and molasses (10 g L−1)
exhibited highest naringinase activity (4.6 IU
mL−1) in salt medium with naringenin after 8
days of fermentation (Puri et al., 2005). The
present study shows that yeast strain
Clavispora lusitaniae KF633446 produces αL-rhamnosidase in short duration fermentation
(48 h) as compared to reported fungal strains.
The reduction in fermentation time is
important
because
it
decreases
the
fermentation costs and contamination with
opportunistic microorganisms in scale up
process.
Effect of nitrogen source
rhamnosidase production
on
α-L-
The effect of different nitrogen sources were
tested for rhamnosidase production in minimal
medium
containing
0.2%
naringin
supplemented with 0.6% (w/v) rhamnose.
Results indicated that minimal medium
containing yeast extract has maximum
rhamnosidase activity (0.057 IU mL-1)
followed by peptone (0.050 IU mL-1), casein
(0.047 IU mL-1), urea (0.038 IU mL-1),
ammonium sulphate (0.035 IU mL-1) and
ammonium chloride (0.024 IU mL-1) as a
nitrogen source after 48 h of incubation (Fig.
1B). Further, among various concentration of
yeast extract (0.1-1%-w/v), 0.4% (w/v) yeast
extract resulted in highest rhamnosidase
activity relative to other concentrations (Fig.
2950
Int.J.Curr.Microbiol.App.Sci (2018) 7(8): 2947-2959
1F). In similar, yeast extract (Bram and
Solomons, 1965) and peptone (Chen et al.,
2010; Puri et al., 2005) were able to increased
the production of naringinase enzyme.
Peptone was the most effective in naringinase
biosynthesis from Aspergillus niger (Puri et
al., 2005) and Aspergillus oryzae JMU316
(Chen et al., 2010). In terms of the enzyme
yield, the optimum concentration of peptone
was 5 gL-1 and higher concentrations of
peptone in the fermentation medium did not
significantly increase enzyme yield (Puri et
al., 2005). Inorganic nitrogen sources yielded
low naringinase production in shaking-flask
cultures relative to organic sources (Norouzian
et al., 2000). Inorganic nitrogen sources could
only marginally synthesize certain essential
amino acids in fermentation by fungi and
organic nitrogen sources were favorable for
metabolite production (Hwang et al., 2003;
Kim et al., 2003). The maximum naringinase
production of Aspergillus niger BCC 25166
obtained by supplement of the medium with
NaNO3 as its nitrogen source (Thammawat et
al., 2008). Urea and diammonium hydrogen
phosphate were inhibitory, presumably
because of the release of ammonium ions
(Puri et al., 2005).
temperature for Pichia angusta (Yanai and
Sato, 2000) and Aspergillus nidulans (Orejas
et al., 1999) rhamnosidases was observed at
40 °C. Yadav and Yadav (2004) found that
optimum temperature of rhamnosidases from
the different Aspergillus strains vary from 5360 °C. The temperature optimum for
naringinase activity was 50 °C for Bacillus
methylotrophicus (Mukund et al., 2014) and
Aspergillus niger MTCC1344 (Thammawat et
al., 2008).
Effect of pH on rhamnosidase activity
The effect of pH on yeast rhamnosidase
activity was tested in a range of 3 to 8 and best
pH for rhamnosidase activity was 4 (0.05 IU
mL-1) then 5, 6, 7, 8 and 3 (Fig. 1D). The
reason for decrease in enzyme activity above
and below the pH 4 may be the change in
enzymatic structure by altering charge of
amino acids responsible for secondary and
tertiary structure. The high response at low pH
level is of great importance in fruit juice
processing industry because pH of juices is
often less than 5.
Effect of temperature on rhamnosidase
activity
Additionally, low pH reduces the chances of
bacterial contamination in the fruit beverages
as optimum pH for the growth of most of the
food borne pathogens ranges from 6.5 to 7.5.
In case of temperature optimization, maximum
rhamnosidase activity (0.05 IU mL-1) was
observed at 35±5 °C after 48 h and decreased
slowly when the temperature rises (Fig. 1C).
The reason for the decrease in enzyme activity
above and below the 35 °C temperature may
be the deactivation of enzyme by weakening
of non-covalent interactions that stabilize the
protein structure, leading to unfolding and
subsequent changes and reduction in catalytic
activity of enzyme. This suggests that the
temperature for enzymatic hydrolysis of
naringin and conversion of other flavonoids
should be controlled at 35 °C. Optimum
Thus, this potential of enzyme can be utilize
for the preparation of fruit beverages without
preservative. In similar findings, optimum pH
of rhamnosidases from Aspergillus terreus and
Aspergillus niger BCC 25166 was 4 (Abbate
et al., 2012; Petri et al., 2014; Puri and
Banergee, 2000; Shamugam and Yadav,
1995). Yanai and Sato (2000) reported that
enzyme purified from Pichia angusta showed
optimum activity at pH 6 which is higher than
above reported strain. Enzyme production was
little affected by pH change in the range 4-6,
but yields were low at pH values below 4
(Puri et al., 2005).
2951
Int.J.Curr.Microbiol.App.Sci (2018) 7(8): 2947-2959
Table.1 Variables representing medium components used in response surface methodology
Design Summary
9.0.3.1
File Version
Study Type
Response Surface
Runs
30
Design Type
Central Composite
Blocks
2
Design Model
Quadratic
Build Time (ms)
78
Factor
Name
Units
Type
Subtype
Minimum
Maximum
Coded
Values
Mean
Std. Dev.
A
Rhamnose
G
Numeric
Continuous
-0.15
0.85
-1.000=0.1
1.000=0.6
0.35
0.227429413
B
Yeast extract
G
Numeric
Continuous
-0.15
0.85
-1.000=0.1
1.000=0.6
0.35
0.227429413
C
pH
-
Numeric
Continuous
2
6
-1.000=3
1.000=5
4
0.909717652
D
Temperature
°C
Numeric
Continuous
25
45
-1.000=30
1.000=40
35
4.548588261
2952
Int.J.Curr.Microbiol.App.Sci (2018) 7(8): 2947-2959
Table.2 Design of RSM experiments and respective experimental and predicted α-L
rhamnosidase activities
α-L-rhamnosidase activity (IU L-1)
Variables under study
Rhamnose
(g L-1)
0.1
0.6
0.1
0.6
0.1
0.6
0.1
0.6
0.1
0.6
0.1
0.6
0.1
0.6
0.1
0.6
0.35
0.35
0.35
0.35
-0.15
0.85
0.35
0.35
0.35
0.35
0.35
0.35
0.35
0.35
Yeast
Extract
(g L-1)
0.1
0.1
0.6
0.6
0.1
0.1
0.6
0.6
0.1
0.1
0.6
0.6
0.1
0.1
0.6
0.6
0.35
0.35
0.35
0.35
0.35
0.35
-0.15
0.85
0.35
0.35
0.35
0.35
0.35
0.35
pH
3
3
3
3
5
5
5
5
3
3
3
3
5
5
5
5
4
4
4
4
4
4
4
4
2
6
4
4
4
4
Temperature
(°C)
30
30
30
30
30
30
30
30
40
40
40
40
40
40
40
40
35
35
35
35
35
35
35
35
35
35
25
45
35
35
2953
Experimental
Value
99
103
97
98
97
106
97
100
90
109
106
106
103
95
105
110
90
106
92
90
102
110
110
96
109
96
103
109
110
91
Predicted
Value
96
102
109
93
101
104
99
106
92
91
98
102
101
103
95
99
109
103
92
95
95
106
91
94
100
94
92
91
96
93
Int.J.Curr.Microbiol.App.Sci (2018) 7(8): 2947-2959
Table.3 ANOVA for response surface quadratic model
Source
Sum of squares
df
Mean square
F Value
p-value
Prob > F
Block
Model
A-Rhamnose
B-Yeast Extract
C-pH
D-Temperature
AB
AC
AD
BC
BD
CD
A2
B2
C2
D2
Residual
123.2667
311.45
40.04167
12.04167
7.041667
40.04167
7.5625
33.0625
5.0625
60.0625
0.5625
1.5625
46.50298
13.36012
5.002976
24.64583
449.15
1
14
1
1
1
1
1
1
1
1
1
1
1
1
1
1
14
123.266
22.246
40.041
12.041
7.0416
40.041
7.562
33.062
5.062
60.062
0.562
1.562
46.502
13.360
5.002
24.645
32.082
0.693
1.248
0.375
0.219
1.248
0.235
1.030
0.157
1.872
0.017
0.048
1.449
0.416
0.155
0.768
0.748
0.282
0.549
0.646
0.282
0.634
0.327
0.697
0.192
0.896
0.828
0.248
0.529
0.698
0.395
Lack of Fit
Pure Error
Cor Total
265.9
183.25
883.8667
10
4
29
26.59
45.812
0.580
0.778
AB, AC, AD, BC, BD and CD represent the interaction effect of variables A, B, C and D; A 2, B2, C2 and D2 are the
square effects of the variables
Table.4 Model fitting values of RSM
Model terms
Values
Standard deviation
5.664
Mean
98.066
Coffecient of variation (%)
5.775
PRESS
2045.362
R2
0.409
2
-0.181
Adjusted R
Predicted R
2
-1.689
4.000
Adequate precision
2954
Int.J.Curr.Microbiol.App.Sci (2018) 7(8): 2947-2959
Fig.1 Effect of various physical and nutritional variables on the production of α-L- rhamnosidase
by Clavispora lusitaniae 84. (a) Carbon sources; (b) Nitrogen sources; (c) temperature; (d) pH;
(e) Rhamnose and (f) Yeast extract
2955
Int.J.Curr.Microbiol.App.Sci (2018) 7(8): 2947-2959
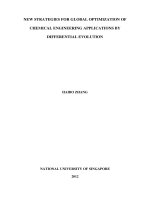
Fig.2 Three-dimensional response surface plot of α-L-rhamnosidase production by Clavispora
lusitaniae KF633446 showing the interaction between (a) yeast extract and rhamnose; (b) pH
and rhamnose; (c) temperature and rhamnose; (d) pH and yeast extract; (e) temperature and yeast
extract and (f) temperature and pH on α-L-rhamnosidase production (IU L–1)
Optimization
components
methodology
of
using
screened
response
medium
surface
Following the screening experiments, CCD with
30 experiments was used to determine the
optimal levels of the four significant factors
(rhamnose, yeast extract, pH and temperature)
that affected α-L-rhamnosidase production. The
design of experiments and respective
experimental and predicted α-L-rhamnosidase
activities are given in Table 2. The results
obtained after CCD were analyzed by standard
analysis of variance (ANOVA), which gave the
following regression equation (in terms of
coded factors) of the levels of α-Lrhamnosidase produced (Y) as a function of
rhamnose (A), yeast extract (B), pH (C) and
temperature (D):
Y = 97.28 + 1.29A + 0.708B + 0.54C - 1.29D 0.68AB - 1.4AC
Y = + 0.56AD - 1.9BC + 0.18BD + 0.31CD
(Equation 1)
Y = + 1.3A2 - 0.69B2 + 0.427C2 - 0.9479D2
The significance of the model was also
analyzed by analysis of variance (ANOVA) for
the experimental design (Table 3). Values of “p
> F” less than 0.0500 indicate model terms are
significant. In this case there are no significant
model terms. Values greater than 0.1000
2956
Int.J.Curr.Microbiol.App.Sci (2018) 7(8): 2947-2959
indicate the model terms are not significant. If
there are many insignificant model terms (not
counting those required to support hierarchy),
model reduction may improve the model. The
model F- value of 0.69 implies the model is not
significant relative to the noise. There is a
74.89% chance that a F- value this large could
occur due to noise. Significant process variables
were A, B, C, D, A2, B2, C2, D2, AB, AC, AD,
BC, BD and CD. The "lack of fit F-value" of
0.58 implies the lack of fit is not significant
relative to the pure error. There is a 77.89%
chance that a "lack of fit F-value" this large
could occur due to noise. The non-significant
lack of fit of the tested model also indicated that
the model was a good fit (Table 3).
A low value of coefficient of variation (5.77%)
indicates that experimental data were precise
and reliable. The goodness of fit of the model
was also checked by the coefficient of
determination, R2, which was calculated to be
0.4094. This implies that 40.9479% of
experimental data of the α-L-rhamnosidase
activity was compatible with the data predicted
by the model and only 59.06% of the total
variations were not explained by the model.
The R2 value is always between 0 and 1, and a
value greater than 0.75 indicates aptness of the
model. For a good statistical model, R2 value
should be close to 1.0. Adequate precision
measures the signal to noise ratio. A ratio
greater than 4 is desirable. The result 4.001
indicates an adequate signal and this model can
be used to navigate the design space. A negative
predicted R2 (-1.689) implies that the overall
mean is a better predictor of the response than
the current model. The adjusted R2 value
corrects the R2 value for the sample size and for
the number of terms in the model. The value of
the adjusted R2 was -0.18. All these
considerations indicate good adequacy of the
regression model (Table 4).
The three-dimensional response surface and
contour plots described by the regression model
are presented in Figure 2. These plots were
obtained from the pair wise combination of two
independent variables, while keeping the other
two variables at their center-point levels. From
the curve of three-dimensional plots, optimal
composition of medium components can be
identified.
The contour plots highlight the roles played by
the process variables (rhamnose, yeast extract,
pH and temperature) and their interactive
effects. From Fig. 2 it is evident that increase in
concentration of variables had a positive
influence on α-L-rhamnosidase activity until an
optimum value was reached, beyond which
variables had significant negative influence on
the α-L-rhamnosidase activity. The contour
plots show a rather broad plateau region in
which the activities change relatively little when
the nutrient concentrations were varied. This
indicates that the optimal solution can
accommodate small errors or variability in the
experimental factors.
The results presented here demonstrate that
among many methods to improve enzyme
activity and yield, optimization of medium
components and cultivation conditions remains
a facile and feasible way to enhance enzyme
activity as well as yield. RSM was found to be
very effective in optimizing the medium
components in manageable number of
experimental trials.
Acknowledgments
This research was supported by Punjab
Agricultural University (Department of
Microbiology), Ludhiana.
References
Abbatea, E., Palmeri, R., Todaroa, A., Blancoc,
R.M., and Spagnaa, G. 2012. Production
of a α-L- Rhamnosidase from Aspergillus
terreus using citrus solid waste as inducer
for application in juice industry. Chem.
Eng. Transac. 27, 253-258.
Bisswanger, H. (3rd ed) 1999. Enzymkinetik:
Theorie und methoden Weinheim: WileyVCH.
2957
Int.J.Curr.Microbiol.App.Sci (2018) 7(8): 2947-2959
Bram, B., and Solomons, G.L. 1965. Production
of the enzyme naringinase by Aspergillus
niger. Appl. Environ. Microbiol. 13, 842845.
Chen, D., Niu, T., and Cai, H. 2010. Optimizing
culture
medium
for
debittering
constitutive
enzyme
naringinase
production by Aspergillus oryzae
JMU316. Afr. J. Biotechnol. 9, 49704978.
Fayoux, S.C., Hernandez, R.J., and Holland,
R.V. 2007. The debittering of navel
orange juice using polymeric films. J.
Food. Sci. 72, 143-154.
Fukumoto, J., and Okada, S. 1973. Naringinase
production by fermentation. Japanese
Patent. 7(306), 554.
Hwang, H.J., Kim, S.W., Xu, C.P., Choi, J.W.,
and Yun, J.W. 2003 Production and
molecular characteristics of four groups
of exopolysaccharides from submerged
culture of Phellinus gilvus, J. Appl.
Microbiol. 94, 708-719.
Kim, S.W., Hwang, H.J., Xu, C.P., Sung, J.M.,
Choi, J.W., and Yun, J.W. 2003.
Optimization of submerged culture
process for the production of mycelial
biomass and exo-polysaccharide by
Cordyceps militaris C738. J. Appl.
Microbiol. 94, 120-126.
Klibanov, A.M. 1983. Stabilization of enzymes
against thermal inactivation. Adv. Appl.
Microbiol. 29, 1-28.
Koseki, T., Mese, Y., Nishibori, N., Masaki, K.,
Fujii, T., Handa, T., Yamane, Y., Shiono,
Y., Murayama, T., and Iefuji, H. 2008.
Characterization of an α-L-rhamnosidase
from Aspergillus kawachii and its gene.
Appl. Microbiol. Biotechnol. 80, 10071013.
McMahon, H., Zoecklein, B.W. Fugelsang, K.,
and Jasinski, Y. 1999. Quantification of
glycosidase activity in selected yeasts and
lactic acid bacteria. J. Ind. Microbiol.
Biotechnol. 23, 198-203.
Mongkolkul, P., Rodart, P., Pipatthitikorn, T.,
Meksut, L., and Sanguandeekul, R. 2006.
Debittering of tangerine citrus Reticulata
Blanco juice by β-Cyclodextrin polymer.
J. Incl. Phenom. Macrocycl. Chem. 56,
167-170.
Montogomery, D.C. (5th edn) 2000. Design and
Analysis of Experiments. John Wiley and
Sons, Singapore.
Mukund, P., Prasanna, D.B., and Saidutta, M.B.
2014. Production of naringinase from a
new
soil
isolate
Bacillus
methylotrophicus: isolation, optimization
and scale-up studies. Prep. Biochem.
Biotechnol. 44, 146-163.
Neter, J., Kutner, M.H., Nachtsheim, C.J., and
Wasserman, W. (4th ed) 1996. Applied
Linear Statistical Models. McGraw-Hill,
New York.
Norouzian, D., Hosseinzadeh, A., Nouri, I.D.,
and Moazami, N. 2000. Production and
partial purification of naringinase by
Penicillium decumbens PTCC 5248.
World J. Microb. Biotechnol. 16, 471473.
Orejas, M., Ibanez, E., and Ramon, D. 1999.
The filamentous fungus Aspergillus
nidulans produce an α-L-rhamnosidase of
potential oenological interest. Lett.
Applied. Microb. 28, 383-388.
Petri, A.C., Buzato, J.B., Celligoi, M.A.P.C.,
and Borsato, D. 2014 Optimization of the
Production of α-L Rhamnosidase by
Aspergillus niger in solid state
fermentation
using
agro-Industrial
residues. Br. Microbiol. Res. J. 4, 11981210.
Puri, M., and Banerjee, U.C. 2000. Production,
purification and characterization of the
debittering
enzyme
naringinase.
Biotechnol. Adv. 18, 207-217.
Puri, M., and Kalra, S. 2005. Purification and
characterization of naringinase from a
newly isolated strain of Aspergillus niger
1344 for transformation of flavoids.
World J. Microbiol. Biotechnol. 21, 753758.
Puri, M., Banerjee, A., and Banerjee, U.C.
2005. Optimization of process parameters
for the production of naringinase by
Aspergillus niger MTCC 1344. Process
Biochem. 40, 195-201.
2958
Int.J.Curr.Microbiol.App.Sci (2018) 7(8): 2947-2959
Puri, M., Kaur, A., Barrow, C.J., and Singh,
R.S. 2011. Citrus peel influences the
production of an extracellular naringinase
by Staphylococcus xylosus MAK 2. Appl.
Microbiol. Biotechnol. 89, 715-722.
Puri, M., Kaur, A., Singh, R.S., and Kanwar,
J.R. 2008. Immobilized enzymes for
debittering citrus fruit juices, In: Busto
MD, Ortega N (eds) Food Enzymes:
Application of New Technologies,
Transworld
Research
Network.
Trivandrum, India, Pp. 91-103.
Rajal, V.B., Cid, A.G. Ellenrieder, G., and
Cuevas, C.M. 2009. Production, partial
purification and characterization of α-Lrhamnosidase from Penicillium ulaiense.
World J. Microbiol. Biotechnol. 25, 10251033.
Rastogi, N.K., Nguyen, L.T., Jiang, B. and
Balasubramaniam,
V.M.
2010.
Improvement in texture of pressureassisted thermally processed carrots by
combined pretreatment using response
surface methodology. Food Bioprocess
Tech. 3, 762-771.
Rodriguez, M.E., Lopez, C.A., van Broock, M.,
Valles, S., Ramon, D., and Caballero,
A.C. 2004. Screening and typing of
patagonian wine yeasts for glycosidase
activities. J. Appl. Microbiol. 96, 84-95.
Romero, C., Manjon, A., Bastida, J., and Iborra,
J.L. 1985. A method for assaying
rhamnosidase activity of naringinase.
Anal. Biochem. 149, 566-571.
Scaroni, E., Cuevas, C., Carrrillo, L., and
Ellenrieder,
G.
2002.
Hydrolytic
properties of crude α-L-rhamnosidase
produced by several wild strains of
mesophillic fungi. Lett. Appl. Microbiol.
34, 461-465.
Shanmugam, V., and Yadav, K.D.S. 1995.
Extracellular production of alpha
rhamnosidase by Rhizopus nigricans. Ind.
J. Exp. Biol. 33, 705-707.
Singh, R.K., Kumar, D.P., Solanki, M.K.,
Singh, P., Srivastva, A.K., Kumar, S.,
Kashyap, P.L., Saxena, A.K., Singhal,
P.K., and Arora, D.K. 2012. Optimization
of media components for chitinase
production by chickpea rhizosphere
associated Lysinibacillus fusiformis BCM18. J. Basic Microbiol. 52, 1-10.
Thammawat, K., Pongtanya, P., Juntharasari,
V., and Wongvithoonyaporn, P. 2008.
Isolation,
preliminary
enzyme
characterization and optimization of
culture parameters for the production of
naringinase isolated from Aspergillus
niger BCC25166. Kaestsart J. Nat. Sci.
42, 61-72.
Vishwanatha, T., Spoorthi, N., Jain, R.V., and
Divyashree, B.C. 2010. Screening of
substrates for protease production from
Bacillus licheniformis. I. J. E. S. T. 2,
6550-6554.
Yadav, S. and Yadav, K.D.S. 2004. Secretion of
α-L-Rhamnosidase by some indigenous
fungal strains. J. Sci. Ind. Res. 63, 439443.
Yadav, V., Yadav, P. K., Yadav, S., and Yadav,
K.D.S. 2010. α-L-Rhamnosidase: a
review. Process Biochem. 45, 1226-1235.
Yanai, T., and Sato, M. 2000. Purification and
characterization of rhamnosidase from
Pichia angusta X349. Biosci. Biotechnol.
Biochem. 64, 2179-2185.
How to cite this article:
Pratiksha Singh, Param Pal Sahota and Rajesh Kumar Singh. 2018. Optimization of Media
Components for Production of α-L-rhamnosidase from Clavispora lusitaniae KF633446.
Int.J.Curr.Microbiol.App.Sci. 7(08): 2947-2959. doi: />
2959