Study on economics of peach cultivation under different fertigation level and foliar applications in tarai region of Uttarakhand, India
Bạn đang xem bản rút gọn của tài liệu. Xem và tải ngay bản đầy đủ của tài liệu tại đây (270.33 KB, 8 trang )
Int.J.Curr.Microbiol.App.Sci (2018) 7(8): 3612-3619
International Journal of Current Microbiology and Applied Sciences
ISSN: 2319-7706 Volume 7 Number 08 (2018)
Journal homepage:
Original Research Article
/>
Study on Economics of Peach Cultivation under Different Fertigation Level
and Foliar Applications in Tarai region of Uttarakhand, India
Vishal Nirgude1*, P.N. Singh1, K.K. Misra1, A.K. Singh1, P.C. Srivastava2
and Atul Kumar3
1
Department of Horticulture, 2Department of Soil Science, College of Agriculture, G.B. Pant
University of Agriculture and Technology, Pantnagar (U.S. Nagar), Uttarakhand, India.
3
Department of Plant Physiology, College of Basic Sciences and Humanities, G.B. Pant
University of Agriculture and Technology, Pantnagar (U.S. Nagar), Uttarakhand, India
*Corresponding author
ABSTRACT
Keywords
Peach, Fertilization,
Yield and
Economics
Article Info
Accepted:
20 July 2018
Available Online:
10 August 2018
The present study was carried out at Horticultural Research Centre, Patharchatta, G.B.
Pant University of Agriculture and Technology Pantnagar, Uttarakhand to find out the
most effective combination of NPK fertigation with foliar applications on economic
performance of peach during two successive years i.e., 2015 and 2016 in five and six years
old peach cv. Shan-e-Punjab. Based on recommended dose of fertilizer (420:240:300g
NPK/tree/year) for conventional method, nine treatments were formulated and studied.
The obtained results indicate that the maximum yield (10.61 t/ha) was recorded with T 8.
Similarly, the total expenditure cost (Rs. 107530.31), gross income (Rs. 530500.00) and
net income (Rs. 422969.69) per hectare were found higher under treatments T 8, whereas, it
was found to be lowest under control (T 9). Among all the treatments, the benefit: cost ratio
was found highest (3.93) under T 8, followed by 3.26 in T 4, however, it was found lowest
(1.21) in T9. Thus, from economic point of view, fertigation dose of 75% RDN + 0.5%
Ferrous sulfate + 0.2% Borax (T 8) was found to be most suitable in Tarai conditions of
Uttarakhand.
Introduction
Peach [Prunus persica (L.) Batsch] belongs to
the family Rosaceae and is one of the
important stone fruit grown in temperate part
of the world. Introduction of cultivated
peaches into India, probably, took place in
later half of 19th century. In India, the
cultivation of peach is mostly confined to
Uttarakhand, Jammu and Kashmir, Himachal
Pradesh, Punjab, Nilgiri and North-Eastern
region. Peach along with its close relative
nectarine, occupies about an area of 40762
hactare with total production of 287778
tonnes and productivity of 7.17 t/ha in India
(Anonymous, 2016). During the past few
years, cultivation of stone fruits, especially
peach has become popular in the subtropical
climate of North Indian plains. The
horticultural produce, besides their high
3612
Int.J.Curr.Microbiol.App.Sci (2018) 7(8): 3612-3619
nutritional value, help in generation of
additional profit and employment through onfarm processing and marketing of fresh
produce as well as processed products. The
demand for stone fruits and their processed
products has increased because of rise in
health concerns and nutritional awareness.
The peach crop has been considered as highly
sensitive to water and fertilizer applications.
The conventional practice of fertilization and
irrigation has given detrimental effect on the
soil health and quality of produce, besides,
poor nutrient and water use efficiency. One of
the recent techniques of fertilization is
fertigation, in which fertilizers are applied
through drip irrigation systems (Bussi et al.,
1991), which permits the fertilizer application
directly at the site of roots which results in
improved fertilizer use efficiency (Singh et
al., 2005). Fertilization using such approach
has found to improve yield attributes as well
as produce quality fruits which fetch high
profit from the market.
The economic evaluation of any experiment is
very essential, as farmers are convinced with
specific recommendation through economic
aspect of the research. In recent past, only few
studies have been conducted on economic
survey of peach orchard (Gangwar et al.,
2008 and Gupta et al., 2016), however, study
on the economics of peach cultivation under
fertigation level and foliar applications are
lacking in study area, hence, the present study
was conducted to work out the economics of
peach cv. Shan-e-Punjab under different
treatments.
Materials and Methods
The present investigation was carried out at
the
Horticultural
Research
Centre,
Patharchatta, G. B. Pant University of
Agriculture and Technology Pantnagar,
Uttarakhand to find out the most effective
combination of NPK fertigation with foliar
application on economic performance of
peach during 2015 and 2016 growing seasons.
Five and six years old low-chill peach cultivar
Shan-e-Punjab, planted at 5×5 meter, was
used for the study. Based on recommended
dose
of
fertilizer
(420:240:300g
NPK/tree/year), nine treatments viz., [T1
(100% of RDN + 0.25% Ferrous sulfate); T2
(75% of RDN + 0.25% Ferrous sulfate); T3
(50% of RDN + 0.25% Ferrous sulfate); T4
(75% of RDN + 0.25% Ferrous sulfate +
0.2% Borax); T5 (100% of RDN + 0.5%
Ferrous sulfate); T6 (75% of RDN + 0.5%
Ferrous sulfate); T7 (50% of RDN + 0.5%
Ferrous sulfate); T8 (75% of RDN + 0.5%
Ferrous sulfate + 0.2% Borax) and T9
(Control)] were formulated. In both the
experimental year, the quantity of water
soluble fertilizers [(N:P:K (20:20:20), urea,
mono potassium phosphate and murate of
potash)] were computed based on gram per
tree per split requirement. Fertigation of NPK
was done through venturi in 10 different split
applications at 15 days intervals, starting from
15th December to continue till 30th of April,
whereas, in case of control, fertilization was
done as per the recommended practice in tree
basin using urea, diammonium phosphate and
murate of potash. However, the foliar
applications of micronutrients (Fe and B)
were performed during appropriate growth
stages. The cost of fertilizers varied in
different treatment while, other operational
charges and inputs were almost same in all
other treatments except fertilization cost in
control.
The fruits were harvested from each tree
during the month of May and yield was
expressed in tonnes per hectare. The total
expenditure per hectare (Table 1a and 1b) was
worked out for all the treatments by adding all
the costs (fertilizers and intercultural
operations) for the purpose of experiment
during two years and the values were
3613
Int.J.Curr.Microbiol.App.Sci (2018) 7(8): 3612-3619
expressed in rupees. The gross income (Table
2) was worked out after selling the harvested
fruits at prevailing market price (Rs. 50 per
kg), subsequently, the net income (Table 2)
was calculated by subtracting the total
expenditure from the gross return. Finally, the
return per rupees invested i.e., benefit: cost
ratio was calculated for all the treatments and
compared with conventional method i.e.,
control. The data regarding fruit yield
attributes was subjected to statistical analysis
in order to find out the treatment showed
significant variation in different under study.
The technique of analysis of variance
(ANOVA) for randomized block design
(RBD) was adopted as per Gomez and Gomez
(1984).
Results and Discussion
The data regarding economics of the
experiment (total expenditure, yield, gross
income and net income) on the basis of one
hactare land, under different treatments have
presented in Table 1a and b and 2. The careful
scrutiny of data indicates that total
expenditure was found highest being Rs.
107530.31 in 75% of RDN + 0.5% Ferrous
sulfate + 0.2% Borax (T8) followed by Rs.
106854.13 in 100% of RDN + 0.5% Ferrous
sulfate (T4), whereas, lowest expenditure (Rs.
75478.71) was calculated in control (T9).
Similarly, the maximum yield (10.61 t/ha)
was recorded in T8 and statistically found
significantly superior than rest of the
treatments, followed by (8.91 t/ha) in T4,
however, the minimum yield (3.35 t/ha) was
recorded in under control tress. Therefore,
based on yield obtained in individual
treatments, the highest gross income (Rs.
530500.00) was recorded in T8, followed by
Rs. 445500.00 in T4, whereas, lowest gross
income (Rs. 235500.00) was calculated in T9.
Further, after deducting the total expenditure
from the gross income of corresponding
treatments, the highest net income (Rs.
422969.69) was calculated in T8, whereas it
was found lowest (Rs. 92031.28) under T9.
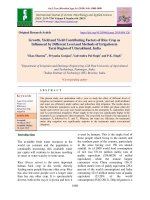
Finally, after calculating the all inputs, the
benefit: cost ratio (Figure 1) was calculated,
which was found maximum (3.93) under T8
followed by 3.26 under T4. However,
minimum benefit: cost ratio (1.21) was
observed in T9 followed by 1.40 in 50% of
RDN + 0.25% Ferrous sulfate (T3) and 1.50 in
50% of RDN + 0.5% Ferrous sulfate (T7).
Figure.1 Benefit: cost ratio analysis of peach cv. Shan-e-Punjab under different treatments
during experimental years
3614
Int.J.Curr.Microbiol.App.Sci (2018) 7(8): 3612-3619
Table.1a Expenditure cost (fertilizer and chemical) of peach cv. Shan-e-Punjab using different fertigation level and foliar applications
Treatments
100% of RDN + 0.25% Ferrous sulfate (T1)
75% of RDN + 0.25% Ferrous sulfate (T2)
50% of RDN + 0.25% Ferrous sulfate (T3)
75% of RDN + 0.25% Ferrous sulfate + 0.2% Borax (T4)
100% of RDN + 0.5% Ferrous sulfate (T5)
75% of RDN + 0.5% Ferrous sulfate (T6)
Fertilizer and chemicals
Urea (46:00:00)
NPK (20:20:20)
MPK (00:52:34)
MOP (00:00:60)
Ferrous sulfate (0.25%)
Urea (46:00:00)
NPK (20:20:20)
MPK (00:52:34)
MOP (00:00:60)
Ferrous sulfate (0.25%)
Urea (46:00:00)
NPK (20:20:20)
MPK (00:52:34)
MOP (00:00:60)
Ferrous sulfate (0.25%)
Urea (46:00:00)
NPK (20:20:20)
MPK (00:52:34)
MOP (00:00:60)
Ferrous sulfate (0.25%)
Borax (0.2%)
Urea (46:00:00)
NPK (20:20:20)
MPK (00:52:34)
MOP (00:00:60)
Ferrous sulfate (0.5%)
Urea (46:00:00)
NPK (20:20:20)
MPK (00:52:34)
MOP (00:00:60)
3615
Quantity (kg)
191.30
80.00
30.77
49.23
3.00
100.00
80.00
30.77
49.23
3.00
8.70
80.00
30.77
49.23
3.00
100.00
80.00
30.77
49.23
3.00
2.40
191.30
80.00
30.77
49.23
6.00
100.00
80.00
30.77
49.23
Unit price (Rs.)
6.0
230.0
357.0
16.0
364.0
6.0
230.0
357.0
16.0
364.0
6.0
230.0
357.0
16.0
364.0
6.0
230.0
357.0
16.0
364.0
510.0
6.0
230.0
357.0
16.0
364.0
6.0
230.0
357.0
16.0
Costs (Rs.)
1147.83
18400.00
10984.62
787.69
1092.0
600.00
18400.00
10984.62
787.69
1092.0
52.17
18400.00
10984.62
787.69
1092.0
600.00
18400.00
10984.62
787.69
1092.0
1224.0
1147.83
18400.00
10984.62
787.69
2184.0
600.00
18400.00
10984.62
787.69
Total costs (Rs.)
32412.14
31864.31
31316.48
33088.31
33504.13
32956.31
Int.J.Curr.Microbiol.App.Sci (2018) 7(8): 3612-3619
50% of RDN + 0.5% Ferrous sulfate (T7)
75% of RDN + 0.5% Ferrous sulfate + 0.2% Borax (T8)
Control (T9)
Ferrous sulfate (0.5%)
Urea (46:00:00)
NPK (20:20:20)
MPK (00:52:34)
MOP (00:00:60)
Ferrous sulfate (0.5%)
Urea (46:00:00)
NPK (20:20:20)
MPK (00:52:34)
MOP (00:00:60)
Ferrous sulfate (0.5%)
Borax (0.2%)
Urea (46:00:00)
DAP (18:46:00)
MOP (00:00:60)
6.00
8.70
80.00
30.77
49.23
6.00
100.00
80.00
30.77
49.23
6.00
2.40
283.55
208.70
200.00
364.0
6.0
230.0
357.0
16.0
364.0
6.0
230.0
357.0
16.0
364.0
510.0
6.0
25.0
16.0
2184.0
52.17
18400.00
10984.62
787.69
2184.0
600.00
18400.00
10984.62
787.69
2184.0
1224.0
1701.32
5217.39
3200.00
32408.48
34180.31
10118.71
(*The calculation is based on one hactare land)
Table.1b Expenditure cost (intercultural operation) of peach cv. Shan-e-Punjab using different fertigation level and foliar applications
Operations
Pruning
Ring preparation
Fertilization Fertigation
Control
Irrigation
Spraying
Weeding
Tractor
Harvesting
Electricity (50 hours)
Labour engaged
75
10
40
08
50
12
50
04
20
-
Rate per day (Rs.)
250.00
250.00
250.00
250.00
250.00
250.00
250.00
250.00
250.00
150.00
(*The calculation is based on one hactare land)
3616
Total costs (Rs.)
18750.00
2500.00
10000.00
2000.00
12500.00
3000.00
12500.00
1600.00
5000.00
7500.00
Total 73350.00 (Excluding control)
65350.00 (Control)
Int.J.Curr.Microbiol.App.Sci (2018) 7(8): 3612-3619
Table.2 Economics of the experiment using different variables in peach cv. Shan-e-Punjab during experimental years
Treatments
100% of RDN + 0.25% Ferrous sulfate (T1)
75% of RDN + 0.25% Ferrous sulfate (T2)
50% of RDN + 0.25% Ferrous sulfate (T3)
75% of RDN + 0.25% Ferrous sulfate + 0.2% Borax (T4)
100% of RDN + 0.5% Ferrous sulfate (T5)
75% of RDN + 0.5% Ferrous sulfate (T6)
50% of RDN + 0.5% Ferrous sulfate (T7)
75% of RDN + 0.5% Ferrous sulfate + 0.2% Borax (T8)
Control (T9)
CD at 5%
Total expenditure (Rs.)
105762.14
105214.31
104666.48
104666.48
106854.13
106306.31
105758.48
107530.31
75468.71
-
(*The calculation is based on one hactare land)
3617
Yield (tonne)
6.62
7.28
5.03
8.91
6.95
7.69
5.28
10.61
3.35
0.51
Gross income (Rs.)
331000.00
364000.00
251500.00
445500.00
347500.00
384500.00
264000.00
530500.00
167500.00
-
Net income (Rs.)
225237.86
258785.69
146833.52
340833.52
240645.87
278193.69
158241.52
422969.69
92031.28
-
Int.J.Curr.Microbiol.App.Sci (2018) 7(8): 3612-3619
In the present investigation higher economics
was reported under treatment T8 followed by
T4. The trend obtained might be due to the
fact that in treatments, T8 and T4 higher yield
and consequently, higher income was
obtained. On the other hand, lowest income
obtained under T9, which is attributable to
least performance of trees under study
because of improper fertilization management
in conventional method.
References
The similarly findings of higher benefit: cost
ratio (1.53 and 2.91) with fertigation
treatments of 75% recommended dose of
fertilizer (RDF) was reported in papaya
(Sadarunnisa et al., 2010) and guava
(Ramniwas et al., 2013) orchards. Further, in
high density orchard of citrus, higher benefit:
cost ratio (2.47) was obtained with fertigation
of 60% RDF [9]. The more or less similar
observations were also made in kiwifruit
(Chauhan and Chandel, 2008) and
pomegranate (Haneef et al., 2014) field using
different fertigation treatments.
In conclusion, the study has revealed that
investment in peach orchards is an
economically profitable, financially viable
and socially acceptable business in study area.
A positive correlation has also been observed
between the different treatments and net
income. Hence, to achieve the target of fruits
production, priority should be given to proper
fertilization
management,
including
scheduling, optimum rate and use of
fertigation with respect to conventional
methods to minimize fertilizer as well as
water losses and provide remunerative prices
to the peach growers in Tarai regions of
Uttarakhand. Therefore, to enhance peach
production, there is a need to adopt such a
smarter and efficient technology for fetching
higher returns without affecting the physical
and chemical properties of soil, from same
piece of land.
3618
Anonymous, 2016. Food and agriculture
organization of the United Nations.
FAOSTAT, statistics database, Rome,
Italy.
Bussi, C., Huguet, J.G. and Defranc, H. 1991.
Fertilization scheduling in peach
orchards under trickle irrigation.
Journal of Horticulture Science, 66:
487-493.
Chauhan, N. and Chandel, J.S. 2008. Effect
of fertigation on growth, yield, fruit
quality and fertilizer use efficiency of
kiwifruit (Actinidia deliciosa). Indian
Journal of Agricultural Sciences, 78:
389-93.
Gangwar, L.S., Singh, D. and Mandal, G.
2008. Economic Evaluation of peach
cultivation in north Indian plains.
Agricultural
Economics
Research
Review, 21: 123-129.
Gomez, K.A. and Gomez, A.A. 1984.
Statistical procedure for Agricultural
research, John Willey and sons, New
York.
Gupta, P., Bhat, D., Wali, V.K., Bakshi, P.,
Bhat, A. and Jasrotia, A. 2016. Cost and
return analysis of different treatments of
mulching and herbicide application on
peach (Prunus persica (L.) Batsch) cv.
Shan-e-Punjab.
Economic
Affairs,
61(3): 481-486.
Haneef, M., Kaushik, R.A., Sarolia, D.K.,
Mordia A. and Dhakar, M. 2014.
Irrigation scheduling and fertigation in
pomegranate cv. Bhagwa under high
density planting system. Indian Journal
of Horticulture, 71(1): 45-48.
Nirgude, V., Karuna, K., Patel, V.B., Pal,
A.K., Singh, M. and Homa, F. 2017.
Effect of NPK fertigation on leaf
nutrient status and yield of Citrus
sinensis Osbeck cv. mosambi under
high density planting. Environment and
Ecology, 35(4C): 3154-3157.
Int.J.Curr.Microbiol.App.Sci (2018) 7(8): 3612-3619
Ramniwas, Kaushik, R.A., Pareek, S.,
Sarolia, D.K. and Singh, V. 2013. Effect
of drip fertigation scheduling on
fertilizer use efficiency, leaf nutrient
status, yield and quality of ‘Shweta’
guava (Psidium guajava L.) under
meadow orcharding. National Academy
Science Letters, 36(5): 483-488.
Sadarunnisa, S., Madhumathi, C., Hari Babu,
K., Sreenivasulu, B. and Rama Krishna,
M. 2010. Effect of fertigation on growth
and yield of papaya cv. Red Lady. Acta
Horticulturae, 851: 395-399.
Singh, Y., Singh, C.S., Singh, A., Singh, A.K.
and Singh, K. 2005. Fertigation: A key
for hi-tech. agriculture. Agriculture
Water Management, 52: 128-149.
How to cite this article:
Vishal Nirgude, P.N. Singh, K.K. Misra, A.K. Singh, P.C. Srivastava and Atul Kumar. 2018.
Study on Economics of Peach Cultivation under Different Fertigation Level and Foliar
Applications in Tarai region of Uttarakhand, India. Int.J.Curr.Microbiol.App.Sci. 7(08): 36123619. doi: />
3619