Investigating and characterizing the binding activity of the immobilized calmodulin to calmodulin-dependent protein kinase I binding domain with atomic force microscopy
Bạn đang xem bản rút gọn của tài liệu. Xem và tải ngay bản đầy đủ của tài liệu tại đây (1.43 MB, 8 trang )
Zhang and Hu Chemistry Central Journal (2017) 11:128
/>
RESEARCH ARTICLE
Open Access
Investigating and characterizing the
binding activity of the immobilized calmodulin
to calmodulin‑dependent protein kinase I
binding domain with atomic force microscopy
Xiaoning Zhang1* and Hongmei Hu2
Abstract
Protein–protein interactions are responsible for many biological processes, and the study of how proteins undergo
a conformational change induced by other proteins in the immobilized state can help us to understand a protein’s
function and behavior, empower the current knowledge on molecular etiology of disease, as well as the discovery of
putative protein targets of therapeutic interest. In this study, a bottom-up approach was utilized to fabricate micro/
nanometer-scale protein patterns. One cysteine mutated calmodulin (CaM), as a model protein, was immobilized on
thiol-terminated pattern surfaces. Atomic Force Microscopy (AFM) was then employed as a tool to investigate the
interactions between CaM and CaM kinase I binding domain, and show that the immobilized CaM retains its activity
to interact with its target protein. Our work demonstrate the potential of employing AFM to the research and assay
works evolving surface-based protein–protein interactions biosensors, bioelectronics or drug screening.
Keywords: Protein–protein interactions, Calmodulin, CaM kinase I binding domain, Atomic force microscopy,
Micro/nanometer-scale
Introduction
Protein patterning techniques in micro/nanometer-scale
has demonstrated its huge potentials in bio-sensing and
bio-analysis field [1–3]. The main advantages of these
protein micro/nano-arrays technologies include high
detection sensitivity, low consumptions of reagent samples (nL level), and a few protein requirements [4]. Typically, upon binding of ligand to the immobilized protein,
there is a change in protein conformation. This ligandmediated conformation change can be devised to alter
the scientific signal of biosensor, which can be analyzed
by assessing any of its observable properties (e.g. optical
or electrochemical properties).
Calcium, like many other inorganic elements, plays
key roles in a variety of biological processes, such as
*Correspondence:
1
College of Biotechnology, Southwest University, Chongqing 400715,
China
Full list of author information is available at the end of the article
the blood-clotting process, metabolism and signal
transduction. Lots of
Ca2+ dependent proteins exist
in the cytoplasma of cells, calmodulin (CaM) is one
of them, which is ubiquitous in almost all eukaryotic
cells [5]. CaM is a small (148 amino acid residues),
acidic (PI = 4.3), and heat-stable protein, which can
be exposed to temperatures higher than 90 °C and
remains stable. Calcium-bound CaM (Ca2+/CaM) can
bind and activate a series of kinases in order to mediate the effects of Ca2+ [6–8]. The multifunctional Ca2+/
CaM-dependent protein kinase I, also known as CaM
kinase I (CaM KI) is a well-known effector of calciumand CaM-mediated functions. It is found in many
tissues, but in neurons it has especially high concentrations, and it may be up to 2% of the total protein in
some brain regions. Based on Dzhura’s work, the CaM
KI mediates phosphorylation and plays a fundamental
part in triggering Ica facilitation, which responses to
the intracellular Ca2+ concentration [9, 10]. When an
external stimulus increases intracellular C
a2+ levels, it
© The Author(s) 2017. This article is distributed under the terms of the Creative Commons Attribution 4.0 International License
( which permits unrestricted use, distribution, and reproduction in any medium,
provided you give appropriate credit to the original author(s) and the source, provide a link to the Creative Commons license,
and indicate if changes were made. The Creative Commons Public Domain Dedication waiver ( />publicdomain/zero/1.0/) applies to the data made available in this article, unless otherwise stated.
Zhang and Hu Chemistry Central Journal (2017) 11:128
increases the amount of Ca2+/CaM. Ca2+/CaM then
bind to the autoinhibitory domain of the CaM KI
α-subunit and activate CaM KI by causing the binding
domain to dissociate from the autoinhibitory domain.
The activated CaM KI migrates to the post-synaptic
density (PSD), phosphorylates α-amino-3-hydroxy-5methyl-4-isoxazolepropionic acid receptors (AMPA
receptors), which are ionotropic transmembrane receptors, and enhances their activity to decrease the Ca2+
level. Therefore, CaM activates CaM KI by displacement of its binding domain, and the capability of CaM
to bind with CaM KI binding domain is able to indicate
the activity of CaM to interact with CaM KI.
Protein–protein interactions, which are responsible for many biological processes [11, 12], have been
extensively studied through a number of alternative
ways, such as fluorescence technique [13, 14], electrophoresis [15, 16], microcalorimetry [17], et al.
However, most of those techniques characterize protein–protein interaction in bulk solution. Only a small
percentage of the published work done to reveal how
proteins undergo a conformational change induced
by protein–protein interaction in the immobilized
state, and AFM is one of techniques used. Besides,
AFM could help us to understand the architecture of
a protein and a multiprotein complex in air directly.
In addition, AFM is the only microscopic technique
which is capable of visualizing biomolecules at the
single-molecule level with sub-nanometer accuracy.
Because AFM allows studying the adhesion, elasticity,
association process, dynamics and other properties of
biological sample, it is able to help us to quantitatively
analyse protein–protein interactions to reveal the
nature and magnitude of forces and the related binding energy landscape. For example, by attaching one of
the interacting proteins to the AFM tip and the other
protein to the sample surface, the molecular binding
forces can be quantified from the positive binding/
rupture events [18].
In the present work, a protein immobilization protocol is used for the controlled and oriented immobilization of C
a2+/CaM. AFM was utilized to evaluate
this procedure and investigate the interaction between
the immobilized C a2+/CaM and the CaM KI binding domain. C a2+/CaM and CaM KI binding domain
were concerned as subjects in the case of this study
because their interactions in bulk solution have been
fully studied by circular dichroism (CD), nuclear magnetic resonance (NMR), and electron paramagnetic
resonance (EPR) [19]. The structure of CaM KI and
the substrate sequence recognition motif for CaM KI
are therefore clear.
Page 2 of 8
Experimental
Chemicals and materials
Chemicals for surface preparation
Octadecyltrichlorosilane (OTS, 97%) and (11-mercaptoundecyl)trimethoxysilane (MUTMS, 95%) were
purchased from Gelest. Toluene (HPLC grade) was purchased from Fisher Scientific. Ultraflat silicon (100)
wafers (N-type) were purchased from Sigma-Aldrich
Corporation. Sulfuric acid and hydrogen peroxide were
purchased from Sigma-Aldrich Corporation.
Materials for CaM expression, purification, and reaction
Luria–Bertani (LB) broth, used to grow the cell culture, and Tris(2-carboxyethyl) phosphine hydrochloride
(TCEP) disulfide reducing agent were purchased from
Sigma-Aldrich Corporation. Calcium chloride
(CaCl2)
was purchased from Flinn Scientific. CaM was purified
using chitin beads from New England Biolabs. 2-anilinonaphthalene-6-sulfonic acid (ANS) used for fluorescence experiment and SDS-PAGE were obtained from
Invitrogen Corporation. Calmodulin—dependent protein
kinase I (299–320) binding domain, which is a putative
CaM-binding region, was obtained from AnaSpec. All
the solution was prepared with water from a Millipore
Direct-Q UV water purification system.
Protein expression and purification
Purification and expression of genetically engineered
CaM with cysteine on N-terminus is based on instructional manual prepared by New England Biolabs [20].
In order to prevent dimer formation, TCEP was applied
in protein solution. SDS-PAGE was used to confirm the
CaM purity (see Additional file 1).
In our experiment, we used 2,6-anilinonaphthalene sulfonate (ANS) fluorescent probe to test the bio-activity of
the purified solution-state C
a2+/CaM. It is well established
that solvent-exposed hydrophobic surfaces are formed
upon Ca2+ binding to CaM, and ANS binds to the hydrophobic parts of proteins through polar interactions and
can be monitored by the increase in fluorescence emission
intensity, which demonstrates the activity of Ca2+/CaM
indirectly [21]. When EDTA is added to the solution, Ca2+
is removed from Ca2+/CaM, and the hydrophobic binding
pocket disappears. This conformational change causes the
release of bound ANS from CaM to the aqueous solutions,
leading to a decrease in fluorescence intensity. Therefore,
by monitoring the fluorescence intensity variation we can
confirm the conformational change in CaM, which is an
indication of CaM viability [22].
During the experiment, the protein was labeled with a
1:1 ratio of ANS overnight at room temperature followed
by dialysis against the same buffer. 1 µL increments
Zhang and Hu Chemistry Central Journal (2017) 11:128
0.5 mmol L−1 EDTA was added into the 400 µL CaM
solution each time. The solution was excited at 310 nm,
and emission spectra in the range from 400 to 500 nm
were obtained with a Perkin Elmer LS-55 fluorescence
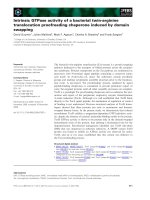
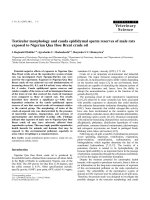
spectrometer. Figure 1 shows a sigmoidal shape of the
binding curve which was observed by adding EDTA solution into CaM solution accumulatively. As expected, the
increase of EDTA amount led to a decrease in fluorescence signal intensity due to the release of ANS caused
by EDTA-induced CaM conformational change. The
fluorescence intensity change indicates that our purified
CaM was capable of changing its conformation properly
in the solution state.
Surface fabrication
The fabrication and characterization of the chemical pattern were performed with an Agilent PicoPlus 3000 AFM
in an environmental chamber. AFM can provide atomiclevel resolution in z axis. The Si (100) wafer was cut into
1 cm × 1 cm pieces. Then, the wafer was boiled in the
Fig. 1 EDTA titrations of ANS labeled CaM monitored by ANS fluorescence emission measurement. For purpose of comparison, all the
fluorescence intensities were normalized to their respective 100%
change. Sigmoidal fitting along with coefficient of determination (R2)
were also demonstrated in Fig. 1
Page 3 of 8
piranha solution (two parts of 98% sulfuric acid and one
part of 30% hydrogen peroxide) at 170 °C for 30 min. At
high temperature, the H2O2 was decomposed; O· and
OH· were generated to remove all organic contaminants and also help to grow a thin oxide layer of silanol
(Si–OH) on the surface. After that, the wafer was dipped
into 5 mmol L−1 OTS toluene solution for a pinholefree OTS-coated wafer fabrication, which was capable of
being used for the follow-up experiment [23–26].
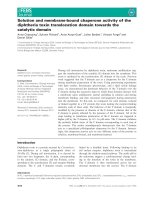
The experimental scheme was shown in Fig. 2. Chemical patterns on the OTS coated Si wafer were fabricated
using local oxidation lithography first (Fig. 2a). With the
help of the chemical patterns, we are able to modify surface with defined chemistry and create topography with
references in positions and height. A detailed description
of the OTS partially degraded pattern (OTSpd) fabrication has been demonstrated in Additional file 1, and an
OTSpd pattern fabrication set-up was demonstrated in
Additional file 1: Figure S2 [27].
From the AFM topography histogram (Additional
file 1: Figure S3b), we can know the depth of the OTSpd
pattern is 10.60 ± 0.01 Å lower than the OTS background. The depth of the OTSpd chemical pattern provides a height reference for calculating the thickness of
other parallel layer on itself. Although some studies
applied AFM cross-section profile to analyze the height
of object [28–30], it is believed that AFM topography histogram can better represent the average height change of
pattern areas in the present work due to the protein film,
which is immobilized on the chemical patterns, exhibiting an “unflat” surface. Histograms of the corresponding
heights were fitted to two Gaussian functions by using
MicroCal Origin software in order to enable a quantitative comparison. The distance between these two peaks is
the height of the disk pattern [31].
After the OTSpd patterns were fabricated, the substrate was rinsed in 10% hydrochloric acid for 10 min
and cleaned with the super-critical carbon dioxide snow
jet cleaner from Applied Surface Technologies. The possible electrostatic charges and contaminates were completely removed as a result of above procedures. Then,
Fig. 2 The Scheme for CaM patterns fabrication. a The OTSpd disk patterns were fabricated by local oxidation lithography. b MUTMS was crosslinked onto the OTSpd patterns, converting the OTSpd patterns into thiol-terminated surfaces. c Substrate was then incubated into H
gCl2 solution
to form Hg-SH coupling. d Cysteine-mutated CaM was immobilized on the chemical patterns via cysteine-Hg-SH coupling. e Structural model of
substrate corresponding to part (d)
Zhang and Hu Chemistry Central Journal (2017) 11:128
the pattern was soaked in a 10 mmol L−1 MUTMS toluene solution overnight to convert the carboxylic acidterminated OTSpd surface pattern to a thiol-terminated
surface pattern (Fig. 2b). The structure and formation of
MUTMS layer on OTSpd pattern is illustrated in Fig. 3.
MUTMS molecules react with the trace amount of water
in the solution, forming silanols in the first step. Then
the silanols cross-linked and selectively anchored on the
hydrophilic OTSpd surface. The pattern in Additional
file 1: Figure S4 is a representative MUTMS silane monolayer self-assembled on top of the OTSpd pattern. From
AFM characterization, the height of the MUTMS pattern
over the OTS background is 10.62 ± 0.02 Å.
Then, the sample with MUTMS patterns was incubated into 10 mmol L−1 HgCl2 solution for half an hour
to form SH-Hg coupling, as shown in Fig. 3c, which will
be used to immobilize cysteine-mutated CaM. 5 μg mL−1
CaM with buffer solution (25 mmol L−1 Tris–HCl,
1 mmol L−1 CaCl2, pH 8.0) was deposited onto the pattern area for one hour in refrigerator at 4 °C (Fig. 3d)
[32]. Then the sample surface was wiped with a piece of
ChemWipe paper, in a typical force of 1 N [33], to remove
the nonspecifically adsorbed protein on the OTS background, while those specifically bind to substrate surface
remained.
Surface characterization
Because AFM imaging in liquid environment provides
a less accurate measurement [34], and it is difficult to
Page 4 of 8
interpret the AFM phase image taken in liquid environment [35]; CaM patterns were imaged at 75% relative
humidity environment (at 25 °C) in air in ac mode with
MikroMasch NSC-14 tips. The imaging set point was
maintained at 99% of the tip free oscillation amplitude so
that the tip tapped the CaM immobilized surface under
a minimal force. Because the tip touched the protein
surface in the humid environment, a possible electrostatic charge from the sample was dissipated after the tip
touched the sample. Hence, the height measurement was
not affected by the protein’s electrostatic charge. All AFM
images were processed using WSxM [36].
Results and discussion
The MUTMS modified surface was used to immobilize cysteine-mutated CaM through cysteine-Hg-SH
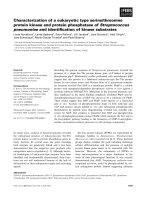
coupling. Figure 4a demonstrates a protein pattern in
which protein film was made only partially covered the
MUTMS disk intentionally. Therefore, Fig. 4a includes
the surface features of OTS, MUTMS, and protein. To
create protein molecules partially covered patterns, we
swabbed the surface with a piece of ChemWipe paper in
a force greater than 5 N. Under such condition, ChemWipe paper can remove protein molecules that are nonspecifically adsorbed on the OTS background, and also
scratch off some protein molecules which are specifically
immobilized on the chemical template. AFM topography characterizations show that after protein immobilization procedure, the height of the patterns changed to
Fig. 3 Schematic representation of the construction of a MUTMS monolayer on the OTSpd surface
Zhang and Hu Chemistry Central Journal (2017) 11:128
Page 5 of 8
Fig. 4 A partially covered CaM layer on the MUTMS pattern. a Ac mode topography image. b Corresponding phase image. c Histogram corresponding to protein fully covered area in (a). The distance between the two peaks in the histogram specifies the height of the CaM pattern over
OTS background in (a)
3.00 ± 0.01 nm above the OTS background (Fig. 4a). In
the corresponding phase image (Fig. 4b), the phase signal
of the MUTMS pattern area is 282.18 ± 68.34 mV, which
is different from the phase signal of protein pattern area
122.67 ± 88.2 mV, indicating they have different surface
identities [37]. From both AFM topography and phase
signal, we can conclude that CaM was immobilized on
the MUTMS chemical pattern.
CaM KI binding domain is an amino acids 299 to 320
fragment of the CaM KI, which can independently bind
CaM and be utilized for CaM interaction studies [38].
Ca2+/CaM can capture this fragment by wrapping tightly
around it, inducing a calmodulin conformational change.
In the experiment, the immobilized CaM was soaked for
10 min in a 1 g mL−1 CaM KI binding domain solution
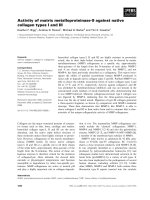
at 4 °C. Figure 5a, b show the CaM pattern, after treatment with CaM KI binding domain solution for 10 min
and then rinsed with copious amounts of buffer solution, in topography and phase channels, respectively.
The MUTMS/OTS border, protein/MUTMS border,
and protein/OTS border are recognizable in the phase
image indicating the surface was not covered by CaM KI
binding domain. The clean, protein uncovered MUTMS
surface (Fig. 5a) indicates the non-specifically adsorbed
protein molecules were removed. AFM tip was manipulated to scan on the surface of protein pattern multiple
times. The height of the protein pattern maintained the
same after the AFM tip scanning, indicating that the
interaction between CaM KI binding domain and the
immobilized CaM is specific. Otherwise, the non-specifically adsorbed CaM KI binding domain could be wiped
off by AMF tip during its scanning on surface, and the
height of the protein pattern should decrease correspondingly. The results from AFM histogram (Fig. 5c)
Fig. 5 Sample in Fig. 4 was incubated in CaM KI binding domain solution for 10 min. a AFM ac mode topography image. b Corresponding phase
image. c Histogram corresponding to protein fully covered area in (a). The distance between the two peaks in the histogram specifies the height of
the KIBD-CaM pattern over OTS background in (a)
Zhang and Hu Chemistry Central Journal (2017) 11:128
reveals that the CaM KI binding domain causes the
height of the CaM layer to increase 11.31 ± 0.10 Å, which
indicates that the immobilized CaM still remained activity to bind its target protein.
In Fig. 6, we plot the height cross-sectional profiles
corresponding to the same location of MUTMS pattern
before (black line) and after (red line) the CaM KI binding domain solution incubation. Cross-sectional profiles
(Fig. 6c) show that the height of MUTMS above OTS
background remains the same after the CaM KI binding
domain solution incubation, indicating no CaM KI binding domain bound on the MUTMS surface.
MUTMS, CaM, and CaM KI binding domain-bound
CaM (KIBD-CaM) patterns were also characterized for
different samples to obtain better statistical results. The
final results are summarized in Table 1.
Page 6 of 8
Table 1 Height of the surface patterns
Apparent height above OTS (nm)
N
MUTMS
1.08 ± 0.18
30
CaM
2.95 ± 0.06
18
KIBD-CaM
4.20 ± 0.09
15
Conclusions
Our results show that the immobilized CaM retains its
activity to interact with its target protein. Upon conformation change to KIBD-CaM, the apparent height of
the CaM molecules increased. Our results demonstrate
the feasibility of employing AFM to probe and understand the protein–protein interaction. We expect to
find wide applications of this present methodology in
Fig. 6 CaM KI binding domain can bind immobilized CaM (a) inducing a conformational change (b). The height cross-sectional profiles of the same
position on MUTMS patterned area in (a) and (b) were plotted in (c)
Zhang and Hu Chemistry Central Journal (2017) 11:128
surface-based protein–protein interactions biosensors,
bioelectronics or drug screening.
Additional file
Additional file 1. Supporting information.
Abbreviations
CaM: calmodulin; AFM: atomic force microscopy; OTS: octadecyltrichlorosilane; OTSpd: OTS partially degraded; MUTMS: (11-mercaptoundecyl)
trimethoxysilane; LB: Luria–Bertani; TCEP: Tris(2-carboxyethyl)phosphine
hydrochloride; ANS: 2-anilinonaphthalene-6-sulfonic acid; CaM KI: CaM kinase
I/CaM-dependent protein kinase I; PSD: post-synaptic density; AMPA receptors: phosphrylates á-amino-3-hydroxy-5-methyl-4-isoxazolepropionic acid
receptors; KIBD-CaM: CaM KI binding domain-bound CaM.
Authors’ contributions
All authors carried out the experiments and the writing of the manuscript.
Both authors read and approved the final manuscript.
Author details
1
College of Biotechnology, Southwest University, Chongqing 400715, China.
2
Key Laboratory of Mariculture and Enhancement of Zhejiang Province,
Marine Fishery Institute of Zhejiang Province, Zhoushan 316021, China.
Acknowledgements
Xiaoning Zhang gratefully acknowledges the financial support from
the National Science Foundation (HRD-1505197) and a Start-up Fund
of Southwest University grant (SWU117036). Hongmei Hu is grateful for
financial support from Science and Technology Project of Zhejiang Province
(2017F50021), Talent Project of Zhejiang Association for Science and Technology (2017YCGC013), Science and Technology Project of Zhoushan City
(2016C31055).
Competing interests
The authors declare that they have no competing interests.
Ethics approval and consent to participate
Not applicable.
Publisher’s Note
Springer Nature remains neutral with regard to jurisdictional claims in published maps and institutional affiliations.
Received: 23 August 2017 Accepted: 30 November 2017
References
1. Cahill DJ (2001) Protein and antibody arrays and their medical applications. J Immunol Methods 250:81–91
2. Zhu H, Snyder M (2003) Protein chip technology. Curr Opin Chem Biol
7:55–63
3. Blawas AS, Reichert WM (1998) Protein patterning. Biomaterials
19:595–609
4. Lee Y, Lee EK, Cho YW, Matsui T, Kang IC, Kim TS et al (2003) ProteoChip: a
highly sensitive protein microarray prepared by a novel method of protein, immobilization for application of protein–protein interaction studies.
Proteomics 3:2289–2304
5. Vogel HJ (2002) Calcium-binding protein protocols. Humana Press,
Totowa
6. Chin D, Means AR (2000) Calmodulin: a prototypical calcium sensor.
Trends Cell Biol 10:322–328
Page 7 of 8
7. Swindells MB, Ikura M (1996) Pre-formation of the semi-open conformation by the apo-calmodulin C-terminal domain and implications for
binding IQ-motifs. Nat Struc Biol 3:501–504
8. Osawa M, Swindells MB, Tanikawa J, Tanaka T, Mase T, Furuya T et al (1998)
Solution structure of calmodulin-W-7 complex: the basis of diversity in
molecular recognition. J Mol Biol 276:165–176
9. Zuhlke RD, Pitt GS, Deisseroth K, Tsien RW, Reuter H (1999) Calmodulin
supports both inactivation and facilitation of L-type calcium channels.
Nature 399:159–162
10. Dzhura I, Wu YJ, Colbran RJ, Balser JR, Anderson ME (2000) Calmodulin
kinase determines calcium-dependent facilitation of L-type calcium
channels. Nat Cell Biol 2:173–177
11. Pawson T, Gish GD, Nash P (2001) SH2 domains, interaction modules and
cellular wiring. Trends Cell Biol 11:504–511
12. Songyang Z, Cantley LC (1995) Recognition and specificity in protein
tyrosine kinase-mediated signalling. Trends Biochem Sci 20:470–475
13. Gijsbers A, Nishigaki T, Sánchez-Puig N (2016) Fluorescence anisotropy as a tool to study protein–protein interactions. J Vis Exp Jove
2016(116):e54640
14. Benz C, Retzbach H, Nagl S, Belder D (2013) Protein–protein interaction
analysis in single microfluidic droplets using FRET and fluorescence
lifetime detection. Lab Chip 13:2808–2814
15. Kameshita I, Ishida A, Fujisawa H (1998) Analysis of protein–protein
interaction by two-dimensional affinity electrophoresis. Anal Biochem
262:90–92
16. Xu M, Liu C, Zhou M, Li Q, Wang R, Kang J (2016) Screening of small-molecule inhibitors of protein–protein interaction with capillary electrophoresis frontal analysis. Anal Chem 88:8050–8057
17. Okhrimenko O, Jelesarov I (2008) A survey of the year 2006 literature
on applications of isothermal titration calorimetry. J Mol Recognit
21:289–311
18. Marcuello C, Miguel RD, Gómezmoreno C, Martínezjúlvez M, Lostao A
(2012) An efficient method for enzyme immobilization evidenced by
atomic force microscopy. Protein Eng Des Sel Peds 25:715–723
19. Yuan T, Gomes AV, Barnes JA, Hunter HN, Vogel HJ (2004) Spectroscopic
characterization of the calmodulin-binding and autoinhibitory domains
of calcium/calmodulin-dependent protein kinase I. Arch Biochem Biophys 421:192–206
20. Perrin FX, Nguyen TDH, Nguyen DL (2015) Formation, structure and antibacterial activities of silazane networks grafted with poly(ethylene glycol)
branches. Prog Org Coat 88:92–105
21. Means AR, Dedman JR (1980) Calmodulin—an intracellular calcium
receptor. Nature 285:73–77
22. Crivici A, Ikura M (1995) Molecular and structural basis of target recognition by calmodulin. Annu Rev Biophys Biomol Struct 24:85–116
23. Maoz R, Cohen SR, Sagiv J (1999) Nanoelectrochemical patterning of
monolayer surfaces: toward spatially defined self-assembly of nanostructures. Adv Mater 11:55–61
24. Maoz R, Frydman E, Cohen SR, Sagiv J (2000) “Constructive nanolithography”: inert monolayers as patternable templates for in situ nanofabrication of metal-semiconductor-organic surface structures: a generic
approach. Adv Mater 12:725–731
25. Hoeppener S, Maoz R, Cohen SR, Chi LF, Fuchs H, Sagiv J (2002) Metal
nanoparticles, nanowires, and contact electrodes self-assembled on
patterned monolayer templates: a bottom-up chemical approach. Adv
Mater 14:1036–1041
26. Liu ST, Maoz R, Schmid G, Sagiv J (2002) Template guided self-assembly
of (Au55) clusters on nanolithographically defined monolayer patterns.
Nano Lett 2:1055–1060
27. Cai YG, Ocko BM (2005) Electro pen nanolithography. J Am Chem Soc
127:16287–16291
28. Yun X, Tang M, Yang Z, Wilksch JJ, Xiu P, Gao H et al (2017) Interrogation of
drug effects on HeLa cells by exploiting new AFM mechanical biomarkers. Rsc Adv 7:43764–43771
29. Li N, Jang H, Yuan M, Li W, Yun X, Lee J et al (2017) Graphite-templated
amyloid nanostructures formed by a potential pentapeptide inhibitor for alzheimer’s disease: a combined study of real-time atomic force
microscopy and molecular dynamics simulations. Langmuir Acs J Surf
Coll 33:6647–6656
Zhang and Hu Chemistry Central Journal (2017) 11:128
30. Feng Z, Ping Z, Hou J, Yun X, Li W, Du Q et al (2015) Large scale anomalous patterns of muscovite mica discovered by atomic force microscopy.
Acs Appl Mater Interfaces 7:8699–8705
31. Eaton P, West P (2010) Atomic Force Microscopy. OUP, Oxford
32. Trajkovic S, Zhang XN, Dauner S, Cai YG (2011) Atomic force microscopy
study of the conformational change in immobilized calmodulin. Langmuir 27:10793–10799
33. Gao P, Cai YG (2009) A method for fabricating protein patterns on the
octadecyltrichlorosialne(OTS) surface through paper swabbing. Ultramicroscopy 109:1023–1028
34. Mikromasch “Life Science“. Accessed 17 Dec 2015
Page 8 of 8
35. Chen CH, Clegg DO, Hansma HG (1998) Structures and dynamic motion
of laminin-1 as observed by atomic force microscopy. Biochemistry
37:8262–8267
36. Horcas I, Fernandez R, Gomez-Rodriguez JM, Colchero J, Gomez-Herrero
J, Baro AM (2007) WSXM: a software for scanning probe microscopy and a
tool for nanotechnology. Rev Sci Instrum 78:013705
37. Zhang X, Cai Y (2012) Octadecyltrichlorosilane (OTS)-coated ionic liquid
drops: micro-reactors for homogenous catalytic reactions at designated
interfaces. Beil J Nanotechnol 3:33–39
38. Gomes AV, Barnes JA, Vogel HJ (2000) Spectroscopic characterization
of the interaction between calmodulin-dependent protein kinase i and
calmodulin. Arch Biochem Biophys 379:28–36