Development and validation of an HPLC–MS/MS method for the determination of arginine-vasopressin receptor blocker conivaptan in human plasma and rat liver microsomes: Application to a
Bạn đang xem bản rút gọn của tài liệu. Xem và tải ngay bản đầy đủ của tài liệu tại đây (1.25 MB, 9 trang )
Alrabiah et al. Chemistry Central Journal (2018) 12:47
/>
Open Access
RESEARCH ARTICLE
Development and validation of an
HPLC–MS/MS method for the determination
of arginine‑vasopressin receptor blocker
conivaptan in human plasma and rat liver
microsomes: application to a metabolic stability
study
Haitham Alrabiah1, Adnan A. Kadi1, Mohamed W. Attwa1 and Gamal A. E. Mostafa1,2*
Abstract
Purpose: To develop and validate a bio-analytical HPLC–MS/MS method for the determination of conivaptan (CVA)
an arginine-vasopressin receptor blocker in human plasma and in rat liver microsomes (RLMs).
Methods: Analytes were separated on a reversed phase C18 column (50 mm × 2.1 mm, 1.8 μm). The mobile phase
was a mixture of acetonitrile and 10 mM ammonium formate (40:60 v/v, pH 4.0) and was pumped isocratically for
4 min at a flow rate of 0.2 ml/min. Multiple reaction monitoring in positive ionization mode was used for the assay.
Results: The method yielded a linear calibration plot (r2= 0.9977 and 0.9998) over 5–500 ng/ml with a limit of
detection at 1.52 and 0.88 ng/ml for human plasma and RLMs, respectively. The reproducibility of detection of CVA in
human plasma and RLMs was found to be in an acceptable range.
Conclusion: The method developed in this study is applicable for accurately quantifying CVA in human plasma and
rat liver microsomal samples. The optimized procedure was applied to study of metabolic stability of CVA. Conivaptan
concentration rapidly decreased in the first 2 min of RLMs incubation and the conversion reached a plateau for the
remainder of the incubation period. The in vitro half-life (t1/2) was estimated at 11.51 min and the intrinsic clearance
(CLin) was 13.8 ± 0.48 ml/min/kg.
Keywords: Conivaptan, LC–MS/MS, Human plasma, RLMs, Metabolic stability study
Introduction
Conivaptan (YM087, CVA) is a vasopressin receptor
antagonist (non-peptide inhibitor of antidiuretic hormone). It is approved for the treatment of hyponatremia
[low blood levels of sodium caused by syndrome of inappropriate antidiuretic hormone secretion (SIADH)] [1,
2] under the brand name vaprisol. Its chemical name
*Correspondence: ;
1
Department of Pharmaceutical Chemistry, College of Pharmacy, King
Saud University, P.O. Box 2457, Riyadh 11451, Saudi Arabia
Full list of author information is available at the end of the article
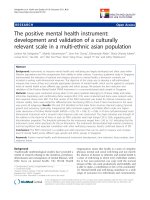
is
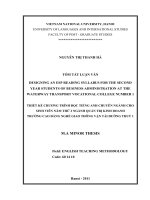
“N-(4-((4,5-dihydro-2-methylimidazo[4,5-d][1]benzazepin-6(1H)-yl)carbonyl)phenyl)-(1,1′-biphenyl)-2carboxamide” (structure shown in Fig. 1).
Vaptans such as CVA and tolvaptan represent a targeted approach to treatment of hyponatremia by inhibiting the interaction of arginine vasopressin with the
V2 receptor [2, 3]. Conivaptan inhibits two subtypes of
the vasopressin receptors (V1a and V2) and is therefore
utilized in the treatment of SIADH. It increases sodium
concentration in the blood, and regulates diuresis to prevent water retention in the body [4–7].
© The Author(s) 2018. This article is distributed under the terms of the Creative Commons Attribution 4.0 International License
( which permits unrestricted use, distribution, and reproduction in any medium,
provided you give appropriate credit to the original author(s) and the source, provide a link to the Creative Commons license,
and indicate if changes were made. The Creative Commons Public Domain Dedication waiver ( />publicdomain/zero/1.0/) applies to the data made available in this article, unless otherwise stated.
Alrabiah et al. Chemistry Central Journal (2018) 12:47
Page 2 of 9
Fig. 1 Chemical structure of conivaptan (a) and imatinib (b)
Few analytical methods using HPLC-tandem mass
spectrometry (HPLC–MS/MS) have been reported as
assays of CVA [8, 9], and this technique was previously
used for elucidating the pharmacokinetic properties of
CVA [8]. However, this method [8] was not fully validated and the separation was carried out using gradient
elution with a mobile phase at 40 °C. A second method
was reported for screening urine samples for various
doping agents using HPLC-high resolution MS. Diuretics
including CVA, lixivaptan, mozavaptan, tolvaptan, relcovaptan were screened with this assay [9].
HPLC–MS/MS is an attractive technique because it
accurately separates analytes in samples with complex
matrices such as biological fluids, containing a variety
of environmental contaminants and drugs [10, 11]. It is
widely used in bioanalysis, especially pharmacokinetic
studies of pharmaceuticals. Pharmacokinetic studies
are used to determine the fate of certain drug and how
quickly it cleared from the body or a specific organ. Mass
detection is useful in these studies because of its very
short response time, high sensitivity and selectivity compared with standard chromatographic techniques. Notably, one major advantage of mass detection is that the
detector can be tuned to select specific ions to fragment
with a very high level of accuracy.
Method validation is required to establish an analytical method that yields accurate, precise, and reproducible
results. Reproducibility is an essential requirement for
pharmacokinetic, pharmacodynamics, and toxicological
studies [8, 12, 13]. Consequently, method validation is a
critical step in bio-analytical data collection in drug studies. Hence, all validation parameters should be studied
and approved in accordance with Food and Drug Administration (FDA) guidelines on bio-analytical method validation [14].
In this study, we have developed and validated an
HPLC–MS/MS method for the detection and quantitation of CVA in human plasma and rat liver microsomes
(RLMs). The developed method is completely validated
compared with screening qualitative methods [8] and
the pharmacokinetic study method (gradient elution at
40 °C) [9]. The proposed method is based on the use of
electrospray ionization (ESI) in positive mode as a source
of ions and the use of MRM method to detect analytes.
The proposed method was utilized to assess the metabolic stability of CVA by determining its rate of conversion when incubated with RLMs and estimating the
associated in vitro half-life (t1/2) and intrinsic clearance
(CLin). Using these and other pharmacokinetic data, such
as hepatic clearance (CLH), bioavailability and in vitro
t1/2 can be estimated which are very important to aid in
defining relationships between in vitro and in vivo correlation behavior. Particularly, a common trend is low
in vivo bioavailability of compounds that exhibit rapid
rates of in vitro metabolism [15].
Experimental
Chemicals and reagents
A CVA standard was obtained in powdered form provided by Santa Cruz Biotechnology, Inc. (Heidelberg
Germany). Imatinib, used as an internal standard, was
obtained from “Sigma-Aldrich (St. Louis, MO, USA)”.
Ultra-pure water (18 μΩ) was prepared using a Milli-Q
plus purification system (Millipore, USA). HPLC-grade
solvent (acetonitrile) was supplied by Merck BDH Ltd.
(Poole, UK) product. Ammonium formate and formic
acid, analytical grade, were acquired from AVONCHEM
(Macclesfield, Cheshire, England). Human blood was
a kind donation by “King Khaled University Hospital, King Saud University, Riyadh, Saudi Arabia”. With
informed consent acquired from patients, collection of
fasted blood samples was carried out followed by separation of plasma, which was kept frozen at − 70 °C. RLMs
were prepared and supplied by “the Animal Care Center,
Faculty of Pharmacy, King Saud University”. Millex-GP
0.22 µm syringe filters were obtained from Millipore and
OMNI homogenizer was supplied by Omni International
(Kennesaw, GA, USA).
Alrabiah et al. Chemistry Central Journal (2018) 12:47
Instrumentation and conditions
An Agilent 1200 HPLC system (Agilent Technologies, Palo Alto, CA, USA) in conjunction with an Agilent 6410 triple quadrupole mass spectrometer was
used in this study. Elution in isocratic mode was performed using “Agilent Eclipse plus C18 analytical column (50 mm × 2.1 mm, 1.8 μm) maintained at 25 °C”. The
mobile phase consisted of acetonitrile and 10 mM ammonium formate (40:60 v/v), pH 4.0, used at a rate of 0.2 ml/
min during all experiments. CVA and the internal standard imatinib eluted at 2.780 and 1.293 min, respectively.
A total run time and injection volume of 4 min and 5 µl,
respectively, were sufficient and appropriate for these
experiments. The detector was operated in positive mode
with an ESI ion source. Nitrogen was used as a desolvation gas with a flow rate of 12 l/min, and the collision gas
was high purity nitrogen at a pressure of 50 psi. A temperature of 350 °C was set for the source and the capillary
voltage was set at 4 kV. Quantitation was attained with
the aid of MRM target transitions of CVA precursor ion
499.2 → 300.2 and 499.2 → 181.2, in addition to IS precursor 494 → 394.1. Collision energy was set at 25, 12 V
for CVA and 20 V for the IS, respectively the dwell time
(200 ms) for each ion. CVA was fragmented at 145 and
135 V and the IS was fragmented at 135 V. “Mass Hunter
software (Agilent Technologies, CA, USA) was used for
operating the instrument and acquiring the data.”
Preparation of standard solutions
Standard solution of CVA (1000 μg/ml) was freshly prepared in methanol. Imatinib (IS) (1000 μg/ml) stock solution was freshly made in DMSO. Two analyte working
solutions at 100 µg/ml (working solution 1) and 10 µg/
ml (working solution 2) were prepared in methanol. Two
working solution of IS were made by appropriate dilution from stock to give 100 and 2 µg/ml in DMSO. An
exact amount was subsequently prepared as dilutions in
the optimized mobile phase to make a set of calibration
and quality control solutions. All prepared solutions were
kept at 4 °C until use.
RLM sample preparation
Four Sprague–Dawley rats were provided by the Animal
Care Center as stated above. Approval of the experimental animal procedure used for preparation of RLMs was
previously granted by the Institutional Review Board,
King Saud University. Rats were sacrificed by cervical
dislocation, and peritoneal cavity incisions were made
to harvest the livers. Rat livers were weighed in a clean
beaker. A pH 7.4 phosphate buffer solution (consisting of
0.04 M KH2PO4/NaH2PO4, 0.25 M sucrose and 0.15 M
KCl) was used with rat liver tissue at 1:4 w/v and liver
tissue was homogenized using an OMNI homogenizer,
Page 3 of 9
followed by centrifugation of the homogenate at 10,000g
for 22 min at 4 °C. This was followed by centrifugation
of the supernatant at 100,000g for 70 min and removal of
the supernatant. The resultant pellets were then re-constituted in KCl/sucrose buffer and the microsomes were
subsequently stored at − 70 °C. The Lowry assay [16] was
used to determine its protein concentration. The activity
of cytochrome P450 enzymes was quantitated by measuring the bio-activation of phenytoin to p-hydroxyphenytoin by the microsomes [17].
Calibration curve
Human plasma
A suitable amount of CVA (10 μg/ml) was diluted in
human plasma to obtained eleven concentrations ranging
from 5 to 500 ng/ml, with 100 µl of 2 µg/ml IS added to
each dilution. Acetonitrile was added to achieve removal
of plasma protein. Plasma samples were centrifugation at
10,000 rpm for 20 min at 4 °C. The resulting clear solutions were filtered through 0.22 µm syringe filters then
loaded into the auto-sampler and 5 µl of each prepared
solution was analyzed by LC–MS/MS. A blank was prepared in a similar manner using human plasma without
drug and was injected into the LC–MS/MS to check for
interference.
Rat liver microsomes
A suitable amount of CVA (10 μg/ml) was diluted into
RLMs to yield of eleven samples with concentrations
ranging from 5 to 500 ng/ml, then one hundred microliters of 2 µg/ml internal standard was added to each. Acetonitrile was added, and the samples were centrifuge at
14,000 rpm for 12 min at 4 °C. The clear solutions were
removed and filtered through 0.22 µm syringe filters. The
clear filtrates were placed into the auto-sampler and a
volume of 5 µl of each solution was assayed by the LC–
MS/MS system. A blank constituting RLMs matrix without the drug was analyzed using the same protocol with
the mobile phase rather than RLMs. Blanks were injected
into the LC–MS/MS to identify interferences.
Calibration curves (at concentrations 5, 10, 15, 20, 30,
50, 100, 150, 300, 400 and 500 ng/ml) were generated
for spiked human plasma and RLMs samples by plotting
peak area ratio for CVA to IS on the y axis versus CVA
nominal concentration levels on the x axis. Each data
point was tested in six replicates. The parameters of the
calibration curve parameters, including the slope of the
line of best fit, its intercept, and correlation coefficient
(r2) values were calculated. CVA concentrations in the
spiked RLM samples were computed by substituting their
ratios into the generated linear regression equation.
Alrabiah et al. Chemistry Central Journal (2018) 12:47
Method validation
The current methods were validated in accordance with
the guidelines recommended by the US Food and Drug
Administration (FDA) and the International Conference
on Harmonisation (ICH) [18, 19] for analytical procedures and methods, as detailed below.
Specificity
Six blank plasma samples were analysed using HPLC–
MS/MS after extraction to estimate the specificity of
the investigated method. Blanks were separated using
optimized chromatographic conditions to check for any
peaks eluting at the same times as CVA or IS. Carryover
effects were tested by increasing the elution time of separation and raising post run time to check for any other
peaks which may interfere with drug detection. Moreover, MRM spectra of blanks with mass fragmentation
patterns of CVA and IS were obtained to check the specificity of the method.
Extraction and matrix effects
Different methods of extraction were tested using ethyl
acetate liquid–liquid extraction, solid phase extraction, and protein precipitation. Protein precipitation
using acetonitrile as the protein precipitating solvent
was proven to be the best method, in which show more
than 94% recovery was attained. An extract sample was
also spiked with a known concentration of CVA and its
percentage recovery was compared with analyte sample
spiked into mobile phase. The recovery percentage was
approximately 98.0%.
Linearity and sensitivity
Assessment of the linearity of the developed method was
carried out using six different calibration curves, which
were plotted based on peak area ratios of CVA to the
internal standard imatinib on the y-axis in relation to
the assayed concentrations of CVA on the x-axis. Briefly,
11 concentrations of calibration solutions (5–500 ng/
ml) were prepared fresh every day by spiking CVA into
human plasma samples. Data generated for calibration
were analysed by least-squares linear regression to establish the range of linearity. Assessment of the sensitivity
of the assay was performed following ICH recommendations [18], by estimating the limits of detection (LOD)
and quantitation (LOQ) of the technique using the slope
of the constructed calibration line and the standard deviation associated with its intercept based on the equation
below.
LOD or LOQ = k
SDb
a
Page 4 of 9
where k equals 3 and 10 for LOD and LOQ, respectively,
SDb represents the standard deviation associated with
the intercept, and a denotes the slope of the plot.
Precision and accuracy
Determinations of intra-day precision and accuracy were
carried out via analysis of spiked human plasma and
RLMs using three QC samples which were estimated
from previous calibration curves. Their values were estimated during a day and on different days. Precision was
expressed as %RSD = SD Mean × 100 , whereas
accuracy was assessed as % relative error or % recovery:
%RE = (Concmeasured − Concnominal ) Concnominal
× 100.
Stability
Stability of conivaptan in human plasma and RLM samples by analyzing QC samples in six replicates assessed
in several storage conditions relevant to routine sample
processing. Measurements of mean CVA concentrations,
accuracy and precision values were calculated based on
freshly constructed plasma calibration curves. Stability of CVA was assessed by incubating QC samples at
room temperature for 8 h, storing samples at 4 °C for 24 h
and storing samples at − 20 °C for 30 days. Freeze–thaw
stability was assessed using three cycles carried out by
freezing at − 70 °C and then thawing at 25 °C.
Sample integrity and incurred sample
A stock solution of CVA at 1.8% higher CVA concentration than highest concentration standard in the calibration range was prepared in methanol. Two diluted
concentrations (90 and 45%) were prepared in spiked
human plasma and RLMs. The concentration of CVA in
human and RLMs were determined from the previously
prepared calibration curve. Three QC samples of spiked
human plasma and RLMs were assessed a second time
after 7 days for incurred sample reassessment.
Method application
Assessing the metabolic stability of CVA
This metabolic stability study was designed to track the
disappearance of CVA incubated with RLMs by measurements of the drug based on the developed LC–MS/
MS assay. Tests were carried out in three replicates at a
final concentration of 1 µM CVA in 1 mg/mL microsomal protein, with 1 mM NADPH and 3.3 mM M
gCl2 in
phosphate buffer (pH 7.4) in 1 mL total volume. NADPH
was used to initiate the incubation reaction and 2 mL of
acetonitrile was used to terminate it at different times
ranging from 0.0 to 50.0 min. Solvent-precipitated proteins were then isolated by centrifugation at 10,000 rpm
for 17 min at 4 °C and the resultant clear solution was
filtered using 0.22 µm syringe filters and IS (100 µl) was
Alrabiah et al. Chemistry Central Journal (2018) 12:47
added to 1 mL of the filtered supernatant. Five microliters of the filtrate was assessed by LC–MS/MS. Finally, the
concentration levels of CVA in the incubations were estimated using the pre-calibration plot of CVA in RLMs.
Results and discussion
Chromatographic conditions and MS
Optimization of the chromatographic and mass spectrometric methods and experimental conditions to enhance
the resolution and sensitivity of the assay and obtain the
highest quality mass response were achieved after several re-assessments. Because the pH level of the aqueous
solution in the mobile phase will determine the degree
of ionization of dissolved compounds, produce ion suppression or enhancement effects, and modify the shape of
analyte peaks, different mobile phase compositions were
assessed.
Formic acid was tested at 0.1% with different ratios of
acetonitrile; the pH of these mobile phases was 3.1. This
mobile phase produced peak separation with slight tailing. We also used ammonium formate at pH 4.0 in combination with acetonitrile. This mobile phase offered
good quality peak separation. Drug and IS peaks were
well separated and there was no peak tailing because
at pH 4.0 the drug was present completely in one ionic
form, pKa 6.23 [20]. Therefore, we changed the mobile
phase from formic acid to ammonium formate to
increase the pH of the mobile phase. Two different concentrations of ammonium formate buffer were tested
(5 mM and 10 mM) for their effect on separation, resolution and peak symmetry. Ammonium formate at 10 mM
resulted in better chromatography than 5 mM. Therefore,
ammonium formate:acetonitrile (40:60 v/v, pH 4.0) was
used at 0.2 ml/min flow rate in isocratic mode.
Different drugs were tested for use as the internal
standards. The choice of internal standard was based
on it having similar chemical properties to those of the
target analyte to be separated and on its absence in the
endogenous sample to be analyzed. Imatinib has the
same functional groups, a similar boiling point, and a
similar pKa [21] to those of CVA. Therefore, in this investigation we used imatinib as an internal standard, which
can be separated under optimized conditions from CVA.
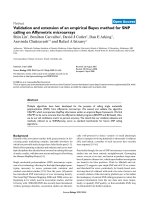
Under optimized conditions, CVA and the IS eluted
at 2.780 and 1.293 min, respectively under the recommended LC–MS/MS conditions. Complete chromatographic elution of both CVA and IS was achieved within
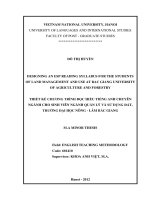
4 min (Fig. 2). The system suitability parameters of CVA
were 26.8, 2.246 and 1.9 for capacity factor, separation
factor, and resolution, respectively. The tailing factor was
about 1 for both CVA and IS. These data indicate that the
separation criteria are in accordance with FDA guidelines
Page 5 of 9
[19]. Peaks of conivaptan and IS peaks showed high resolution, with no evidence of carryover into blank samples
or CVA-free QC solutions (blanks with spiked IS). Figure 2 shows representative chromatograms of 100 ng/ml
CVA, internal standard and blank samples.
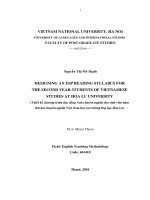
In a similar manner, mass detection parameters were
improved in order to increase the ionization efficiency of
the drug and internal standard precursor and main fragment ions. Minimization of likely interfering peaks and
improvement of the sensitivity of the system were accomplished by means of the MRM mode. To obtain the best
sensitivity, ESI was operated in positive mode for HPLC–
MS/MS analysis. Product ions of CVA (at m/z 499.2)
were mainly ions at [M+H]+ m/z 300.2 and 181.2. The
product ion of IS ion (m/z 494.1) was one significant ion
at [M + H]+ m/z 394. These transitions were selected to
be monitored in the MRM mode of analysis of CVA and
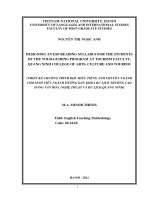
IS in order to provide optimized quantitation of the analyte with adequate sensitivity and selectivity (Fig. 3).
Method validation
Specificity
The specificity of the developed assay is indicated by the
absence of peaks at CVA and/or IS retention times in
analyzed blank solutions. Moreover, carryover was not
observed in the analyzed samples. Separation of CVA
and IS was achieved using optimum HPLC conditions
with elution times of 2.780 and 1.293, respectively. Moreover, MRM of the bank was recorded with fragmentation
targeted at the masses of the investigated drug and IS.
The intensity of the blank at these masses was approximately zero, representing noise peaks with no evidence of
positive detection of analyte.
Linearity and sensitivity
The developed method was shown to be robust and sufficiently sensitive for day-to-day analysis of CVA in
laboratory and clinical settings. RSD values estimated
based on linear regression for a range of CVA concentrations were shown to be within 4.15%. A linear response
was illustrated for a calibration range of 5–500 ng/ml,
with a regression equation y = 0.9882x + 3.8301 and
y = 1.6593x + 0.8199, and correlation coefficient r2 of
0.9977 and 0.9998, for human plasma and RLMs, respectively. The LOD and LOQ were (1.52 and 5 ng/ml) and
(0.88 and 5 ng/ml) respectively, which allows easy detection of CVA in RLMs (results shown in Table 1). To demonstrate optimal function of the investigated assay, QC
plasma samples were assessed to determine the backcalculated levels of CVA. CVA quantitation accuracy and
precision in back-calculated samples were in the range
97.54–101.65 and 0.68–4.15%, respectively.
Alrabiah et al. Chemistry Central Journal (2018) 12:47
Page 6 of 9
Fig. 2 Total ion chromatogram of MRM of a blank, b blank spiked with 200 ng/ml of IS, c blank spiked with 100 ng/ml of CVA and d blank spiked
with 200 ng/ml IS and 100 ng/ml drug
Fig. 3 MRM mass spectra of conivaptan (a) and IS (b) and the supposed fragmentation path way
Alrabiah et al. Chemistry Central Journal (2018) 12:47
Page 7 of 9
Table 1 Back calculation of conivaptan
Conc. (ng/ml)
Human plasma
Mean
RLMs
SD
RSD
R (%)
RE (%)
− 1.10
5.00
4.95
0.15
2.99
98.90
10.00
9.95
0.41
4.15
99.54
20.00
19.55
0.53
2.73
97.73
30.00
29.49
0.83
2.81
98.30
50.00
49.24
1.09
2.21
98.47
100.00
97.88
1.40
1.43
97.88
300.00
292.62
4.16
1.42
97.54
500.00
489.50
8.79
1.80
97.90
Mean
SD
RSD
R (%)
RE (%)
5.05
0.12
2.43
100.95
− 0.46
10.17
0.37
3.69
101.65
1.65
− 2.27
19.96
0.35
1.74
99.79
− 1.70
30.11
0.67
2.23
100.38
− 0.21
− 1.53
50.28
0.56
1.12
100.56
0.56
− 2.12
99.97
1.28
1.28
99.97
− 2.46
298.84
1.67
0.56
99.61
− 0.03
499.89
3.39
0.68
99.98
− 2.10
0.95
0.38
− 0.39
− 0.02
Table 2 Intra- and inter-day precision and accuracy of quality control sample
Parameter
Human plasma
LQC (15 ng)
RLMs
MQC (150 ng)
HQC (400 ng)
LQC (15 ng)
MQC (150 ng)
HQC (400 ng)
Intra-day
Mean
14.75
147.11
392.75
15.01
149.65
399.54
SD
0.47
2.34
6.22
0.43
1.91
5.16
RSD (%)
3.18
1.59
1.58
2.90
1.28
1.29
− 1.64
− 1.93
− 1.81
0.05
− 0.23
− 0.12
RE (%)
Inter-day
Mean
14.74
146.99
392.28
14.98
149.40
398.72
SD
0.44
2.82
7.36
0.37
2.20
5.90
RSD (%)
3.01
1.92
1.88
2.49
1.47
1.48
− 1.74
− 2.01
− 1.93
99.86
99.60
99.68
− 0.14
− 0.40
− 0.32
RE (%)
Accuracy
98.26
97.99
98.07
Precision and accuracy
Stability
The level of reproducibility of the developed assay was
examined by measuring intra- and inter-day precision
and accuracy of CVA quantification using QC samples.
The levels of accuracy were reported as % relative error
and determined by the formula described in the Experimental section. Precision was reported as intra- and
inter-day % RSD measured as described above. Table 2
shows a summary of accuracy and precision testing data,
which demonstrate that shows that these parameters
are within acceptable standards in accordance with ICH
guidelines [18, 19].
Stability assessment was carried out based on CVA QC
samples under several storage conditions. Assayed QC
samples returned measurements which differed from
mean response of fresh samples by ≤ 4.5%. There was no
significant degradation observed as a result of storage or
handling conditions under study. Results of stability testing (Fig. 4) suggest that no loss of CVA may occur when
handling human plasma or RLMs samples under normal laboratory conditions. Incurred QC samples were
re-assessed after 7 days. Results of stability tests are presented in Table 3.
Alrabiah et al. Chemistry Central Journal (2018) 12:47
Page 8 of 9
Ln of % remaning CAV
5
4.5
4
3.5
3
2.5
2
1.5
1
0.5
0
0
2.5
5
7.5 10 12.5 15 17.5 20 22.5 25 27.5 30 32.5 35 37.5 40
Time (min)
Fig. 5 The metabolic stability profile of conivaptan after incubation
with RLMs. Metabolic reaction was stopped at different time points
(mean ± SD)
drug in vitro half-life ( t1/2) at 11.51 min [23] and intrinsic
clearance (CLin) [24] at 13.8 ± 0.48 ml/min/kg.
Conclusions
A bio-analytical LC–MS/MS method for the quantification of CVA in human plasma and RLMs was developed,
optimized and validated. Linearity was demonstrated for
the proposed method over the range of 5–500 ng/ml.
Accuracy and prevision of CVA analysis was confirmed
in both intra- and inter-day settings, with high levels of
recovery from human plasma and RLMs. Conivaptan
was shown to be stable in different samples and under
several tested laboratory processing and storage conditions. The optimized method was successfully applied to
estimate CVA metabolic stability in RLMs. In conclusion,
the developed LC–MS/MS method can be instrumental
in assessing CVA pharmacokinetics in routine clinical
drug monitoring even at low plasma concentrations. The
method can likewise be utilized to examine the metabolic
profile of CVA in different biological samples.
Fig. 4 Conivaptan stability data in human plasma (a) and in RLMs
(b) under different conditions, x-axis is the tested concentrations and
y-axis is found concentrations (mean ± SD)
Metabolic stability study
Drug metabolic stability tests are conducted to determine
the rate of decrease in drug levels within a certain testing system. This approach is justified as a reproducible,
simple and cheap in vitro metabolic stability study that
can help predict in vivo hepatic clearance resulting from
metabolism [22]. Figure 5 shows the microsomal stability
of CVA by quantifying its presence after different incubation periods. The metabolic stability was reported as
Table 3 Dilution integrity and incurred samples
Dilution integrity
Mean
SD
RSD (%)
Incurred samples
Human plasma
RLMS
Human plasma
RMLs
Conc. (ng/ml)
Conc. (ng/ml)
Conc. (ng/ml)
Conc. (ng/ml)
450
225
450
225
15
431.1
221.35
438
221.5
16.24
3.74
2.50
3.76
1.68
10.9
R (%)
95.8
98.37
97.3
RE (%)
− 4.2
1.63
− 2.6
n = 6
14.6
150
400
15
150
400
146.6
391.1
14.77
147.2
393.1
1.85
0.39
2.82
7.17
0.45
1.89
4.105
2.65
1.92
1.83
3.02
1.28
1.21
98.44
98.17
98.28
1.57
− 3.73
− 3.28
98.4
1.52
99.3
− 6.5
101.8
1.82
100.7
0.75
4.77
Alrabiah et al. Chemistry Central Journal (2018) 12:47
Authors’ contributions
HA coordinated the study and reviewed the results of the manuscript, AAK
coordinated the study and reviewed the manuscript, MWA coordinated the
study and conducted the method development, GAEM proposed the study.
All authors read the manuscript participated in discussing the results. All
authors read and approved the final manuscript.
Author details
1
Department of Pharmaceutical Chemistry, College of Pharmacy, King Saud
University, P.O. Box 2457, Riyadh 11451, Saudi Arabia. 2 Micro‑analytical Lab,
Applied Organic Chemistry Department, National Research Center, Dokki,
Cairo, Egypt.
Acknowledgements
The authors express their appreciation to the Deanship of Scientific Research
at King Saud University for funding this work through the research group
Project No. RGP-1436-024.
Competing interests
The authors declare that they have no competing interests.
Consent for publication
All authors greed and approved the manuscript for publication.
Ethics approval and consent to participate
Not applicable.
Funding
Deanship of Scientific Research at King Saud University (RGP-1436-024).
Publisher’s Note
Springer Nature remains neutral with regard to jurisdictional claims in published maps and institutional affiliations.
Received: 17 July 2017 Accepted: 19 April 2018
References
1. Upadhyay A, Jaber BL, Madias NE (2006) Incidence and prevalence of
hyponatremia. Am J Med 119:S30–S35
2. Sedlacek M, Schoolwerth AC, Remillard BD (2006) Critical care issues
for the nephrologist: electrolyte disturbances in the intensive care unit.
Semin Dial 19:496–501
3. Palmer BF, Rock AD, Woodward EJ (2016) Dose comparison of conivaptan
( Vaprisol®) in patients with euvolemic or hypervolemic hyponatremia–
efficacy, safety, and pharmacokinetics. Drug Des Dev Ther 10:339–351
4. Koren MJ, Hamad A, Klasen S, Abeyratne A, McNutt BE, Kalra S (2011)
Efficacy and safety of 30-minute infusions of conivaptan in euvolemic
and hypervolemic hyponatremia. Am J Health Syst Pharm 68:818–827
5. Verbalis JG, Zeltser D, Smith N, Barve A, Andoh M (2008) Assessment of
the efficacy and safety of intravenous conivaptan in patients with euvolaemic hyponatraemia: subgroup analysis of a randomized, controlled
study. Clin Endocrinol 69:159–168
6. Verbalis JG, Goldsmith SR, Greenberg A, Schrier RW, Sterns RH (2007)
Hyponatremia treatment guidelines 2007: expert panel recommendations. Am J Med 120:S1–S21
7. Velez JCQ, Dopson SJ, Sanders DS, Delay TA, Arthur JM (2010) Intravenous conivaptan for the treatment of hyponatraemia caused by
the syndrome of inappropriate secretion of antidiuretic hormone in
hospitalized patients: a single-centre experience. Nephrol Dial Transplant
25:1524–1531
8. Mao ZL, Stalker D, Keirns J (2009) Pharmacokinetics of conivaptan
hydrochloride, a vasopressin V1A/V2-receptor antagonist, in patients with
euvolemic or hypervolemic hyponatremia and with or without congestive heart failure from a prospective, 4-day open-label study. Clin Ther
31:1542–1550
Page 9 of 9
9. Görgens C, Guddat S, Thomas A, Wachsmuth P, Orlovius AK, Sigmund
G, Thevis M, Schänzer W (2016) Simplifying and expanding analytical
capabilities for various classes of doping agents by means of direct urine
injection high performance liquid chromatography high resolution/high
accuracy mass spectrometry. J Pharm Biomed Anal 131:482–496
10. Pitt J (2008) Principles and applications of liquid chromatography-mass
spectrometry in clinical biochemistry. Clini Biochem Rev 30:19–34
11. Dass C (2006) Hyphenated separation techniques. Fundamentals of
contemporary mass spectrometry. Wiley Online Library, Hoboken, pp
151–194
12. Hubert P, Nguyen-Huu JJ, Boulanger B, Chapuzet E, Chiap P, Cohen N,
Compagnon PA, Dewé W, Feinberg M, Lallier M (2007) Harmonization of
strategies for the validation of quantitative analytical procedures: a SFSTP
proposal–part II. J Pharm Biomed Anal 45:70–81
13. Sennbro CJ, Knutsson M, Timmerman P, van Amsterdam P (2001) Anticoagulant counter ion impact on bioanalytical LC–MS/MS assay performance: additional validation required? Bioanalysis 3:2389–2391
14. González O, Blanco ME, Iriarte G, Bartolomé L, Maguregui MI, Alonso RM
(2014) Bioanalytical chromatographic method validation according to
current regulations, with a special focus on the non-well defined parameters limit of quantification, robustness and matrix effect. J Chromatogr A
1353:10–27
15. Baranczewski P, Stanczak A, Sundberg K, Svensson R, Wallin A, Jansson
J, Garberg P, Postlind H (2006) Introduction to in vitro estimation of
metabolic stability and drug interactions of new chemical entities in drug
discovery and development. Pharmacol Rep 58:453–472
16. Lowry OH, Rosebrough NJ, Farr AL, Randall RJ (1951) Protein measurement with the Folin phenol reagent. J Biol Chem 193:265–275
17. Billings RE (1983) Sex differences in rats in the metabolism of phenytoin
to 5-(3,4-dihydroxyphenyl)-5-phenylhydantoin. J Pharmacol Exp Ther
225:630–636
18. Guideline IHT (2005) Validation of analytical procedures: text and methodology Q2 (R1). In: International Conference on Harmonization. Geneva,
Switzerland, pp 11–12
19. ICH (1996) Guidance for industry Q2B validation of analytical procedures:
methodology. Geneva. www.geinstruments.com/sites/default/files/
pdf_test/reg_ICH_2QB_validation_of_analytical_procedures_methodology.pdf. Accessed 26 Apr 2018
20. Ali F, Raufi MA, Washington B, Ghali JK (2007) Conivaptan: a dual receptor
vasopressin v1a/v2 antagonist. Cardiovasc Drug Rev 25:61–279
21. Accessed June 2016
22. Fonsi M, Orsale MV, Monteagudo E (2008) High-throughput microsomal
stability assay for screening new chemical entities in drug discovery. J
Biomol Screen 13(9):862–869
23. Caldwell GW, Yan Z (2014) Optimization in drug discovery. Springer
Education, New York
24. Obach RS, Baxter JG, Liston TE, Silber BM, Jones BC, Macintyre F, Rance DJ,
Wastall P (1997) The prediction of human pharmacokinetic parameters
from preclinical and in vitro metabolism data. J Pharmacol Exp Ther
283:46–58