a novel method for the synthesis of titania nanotubes using
Bạn đang xem bản rút gọn của tài liệu. Xem và tải ngay bản đầy đủ của tài liệu tại đây (1.38 MB, 8 trang )
Journal of Catalysis 246 (2007) 362–369
www.elsevier.com/locate/jcat
A novel method for the synthesis of titania nanotubes using
sonoelectrochemical method and its application for photoelectrochemical
splitting of water
S.K. Mohapatra, M. Misra
∗
, V.K. Mahajan, K.S. Raja
Materials Science and Metallurgical Engineering, MS 388, University of Nevada, Reno, NV 89557, USA
Received 2 October 2006; revised 18 December 2006; accepted 27 December 2006
Available online 25 January 2007
Abstract
This new method describes the application of sonoelectrochemistry to quickly synthesize well-ordered and robust titanium dioxide (TiO
2
)
nanotubular arrays. Self-ordered arrays of TiO
2
nanotubes of 30–100 m in diameter and 300–1000 nm in length can be rapidly synthesized under
an applied potential of 5–20 V. The rate of formation of the TiO
2
nanotubes by the sonoelectrochemical method is found to be almost twice as fast
as the magnetic stirring method. It also demonstrates that high-quality nanotubes can be prepared using high viscous solvents like ethylene glycol
under ultrasonic treatment. The TiO
2
nanotubes prepared in the organic electrolytes (ethylene glycol) are then annealed under H
2
atmosphere to
give TiO
2−x
C
x
types material having a band gap of around 2.0 eV. This process is found to be highly efficient for incorporating carbon into TiO
2
nanotubes. Various characterization techniques (viz., FESEM, GXRD, XPS, and DRUV–vis) are used to study the morphology, phase, band gap,
and doping of the nanotubes. The photoelectrocatalytic activity of these materials to generate H
2
by water splitting is found to be promising at
0.2 V vs Ag/AgCl.
© 2007 Elsevier Inc. All rights reserved.
Keywords: TiO
2
nanotubes; Sonoelectrochemistry; Photoelectrocatalysis; Water splitting
1. Introduction
Titania (TiO
2
) is well known as a semiconductor with photo-
catalytic activities and has great potential in many areas, includ-
ing environmental purification, gas sensors, photovoltaics, im-
mobilization of biomolecules, and generation of hydrogen gas
[1–12]. Over the past several years, preparation of TiO
2
nan-
otubes by the anodization process has caught the attention of the
scientific community due to its one-dimensional nature, ease
of handling, and simple preparation. Over the years, several
electrolytic combinations have been used for the anodization
of titanium [13–18]. The anodization of titanium using phos-
phoric acid and sodium fluoride or hydrofluoric acid has also
recently been reported [19]. However, the reported titania nan-
otubes are not well ordered, and it takes several hours to make
*
Corresponding author.
E-mail address: (M. Misra).
micron-length nanotubes in a high-pH electrolyte. This pa-
per presents a novel sonoelectrochemical technique to anodize
titania—anodization under irradiation of ultrasonic waves—
which quickly leads to the synthesis of well-ordered titania nan-
otubes. The anodization approach builds self-organized titania
nanotubular arrays of controllable tube diameter, good unifor-
mity, and conformability over large areas.
Sonochemistry is widely used for catalysis, electrochem-
istry, food technology, synthesis of nanomaterials, and water
purification, and other applications [20]. Sonochemistry works
through generation and subsequent destruction of cavitation
bubbles. Collapse of a cavitation bubble on or near to a solid
surface generates a powerful liquid jet targeted at the surface.
This effect increases mass flow through the nanotubular surface
and thus increases the rate of formation of the nanotubes. On the
other hand, the formation of the nanotubes using conventional
magnetic stirring is retarded by the formation of a double layer
and diffusion-limited transport of the species. A better quality
0021-9517/$ – see front matter © 2007 Elsevier Inc. All rights reserved.
doi:10.1016/j.jcat.2006.12.020
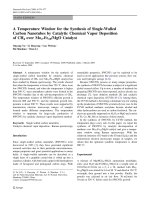
S.K. Mohapatra et al. / Journal of Catalysis 246 (2007) 362–369 363
Fig. 1. Experimental setup for anodization of titanium using ultrasonic treat-
ment.
of nanotubes could be obtained through the sonoelectrochemi-
cal method, because the mass transfer throughout the process is
uniform. The nanotubes synthesized through the sonoelectro-
chemical route are tested for photoelectrocatalytic generation
of H
2
using water splitting and were found to have better ac-
tivity than the materials prepared by the magnetic stirring tech-
nique.
2. Experimental
2.1. Chemicals
Phosphoric acid (H
3
PO
4
, Sigma–Aldrich, 85% in water),
sodium fluoride (NaF, Fischer, 99.5%), potassium fluoride (KF,
Aldrich, 98%), ammonium fluoride (NH
4
F, Fischer, 100%),
ethylene glycol (EG, Fischer), and potassium hydroxide (KOH)
were used.
2.2. Preparation of TiO
2
nanotubular arrays
Anodization of titanium was carried out by modifying an
earlier reported procedure [19]. 16 mm discs are punched out
from a stock of Ti foil (0.2 mm thick, 99.9% purity, ESPI-
metals, USA), washed in acetone, and secured in a polytetraflu-
oroethylene (PTFE) holder exposing only a 0.7 cm
2
area to
the electrolyte. Nanotubular TiO
2
arrays were formed by an-
odization of the Ti foils in 300 ml of electrolytic solution using
ultrasonic waves (100 W, 42 kHZ, Branson 2510R-MT). Vari-
ous electrolytic combinations were used for this purpose in both
aqueous and nonaqueous media.
A two-electrode configuration was used for anodization
(Fig. 1). A flag shaped platinum (Pt) electrode (thickness:
1 mm, area: 3.75 cm
2
) served as a cathode. The distance be-
tween the two electrodes was kept at 4.5 cm in all experiments.
Anodization was carried out by varying the applied potential
from 5 to 20 V using a rectifier (Agilent, E3640A). During an-
odization, instead of a magnetic stirrer, ultrasonic waves were
irradiated onto the solution to enhance the mobility of the
ions inside the solution. The anodization current was moni-
tored continuously using a digital multimeter (METEX, MXD
4660A). After an initial increase-decrease transient, the cur-
rent reached a steady-state value. The anodized samples were
properly washed with distilled water to remove the occluded
ions from the anodized solutions, dried in an air oven, and
processed for characterization. The ultrasonic-mediated, mag-
netically stirred, anodized titanium samples are designated in
the main text as UAT and SAT, respectively.
2.3. Annealing of the materials
The anodized titania nanotubular arrays were annealed in a
nitrogen and oxygen atmosphere at 500
◦
Cfor6hinaCVDfur-
nace at a heating rate of 1
◦
C/min. The UAT samples annealed
under these conditions are designated N
2
-UAT and O
2
-UAT.
The TiO
2
nanotubes prepared by magnetic stirring and annealed
under N
2
are designated N
2
-SAT. The TiO
2
nanotubes prepared
using ethylene glycol were annealed using 20% hydrogen under
an argon atmosphere at 625
◦
C for 60 min.
2.4. Characterization
A field emission scanning electron microscope (FESEM; Hi-
tachi, S-4700) was used to analyze the nanotube formation and
morphology. Energy-dispersive spectroscopy (EDS) (at 20 V)
was used for elemental analysis. Diffuse reflectance ultraviolet
and visible (DRUV–vis) spectra of TiO
2
samples were mea-
sured from the optical absorption spectra using a UV–vis spec-
trophotometer (UV-2401 PC, Shimadzu). Fine BaSO
4
powder
was used as a standard for baseline and the spectra are recorded
in a range 200–800 nm. Further characterization of the TiO
2
nanotubes was carried out by high-resolution X-ray photoelec-
tron spectroscopy (XPS, Surface Science Instruments) using a
focused monochromatic AlKα X-ray source and a hemispher-
ical sector analyzer operated in fixed analyzer transmission
mode. Surveys were run with a pass energy of 25 eV and the
take-off angle is 35
◦
. Glancing angle X-ray diffraction (GXRD)
was done using a Philips-12045 B/3 diffractometer. The target
used in the diffractometer was copper (λ = 1.54 Å), and the
scan rate was 1.2 deg/min.
2.5. Photoelectrochemical generation of hydrogen from water
Experiments on H
2
generation by photoelectrolysis of water
were carried out in a glass cell with photoanode (nanotubu-
lar TiO
2
specimen) and cathode (Platinum foil) compartments.
The compartments were connected by a fine porous glass frit.
The reference electrode (Ag/AgCl) was placed closer to the
anode using a salt bridge (saturated KCl)-Luggin probe cap-
illary. The cell was provided with a 60-mm diameter quartz
window for light incidence. The electrolyte used was 1 M
KOH. A computer-controlled potentiostat (SI 1286, England)
was used to control the potential and record the photocurrent
generated. A 300-W solar simulator (69911, Newport-Oriel In-
struments, USA) was used as a light source. The samples were
anodically polarized at a scan rate of 5 mV/s under illumina-
tion, and the photocurrent was recorded.
364 S.K. Mohapatra et al. / Journal of Catalysis 246 (2007) 362–369
3. Results and discussion
3.1. Anodization using aqueous acidic solution
The first set of experiments was done to monitor the growth
of nanotubes with increasing anodization time. The anodizing
solution used for the experiments consisted of 0.5 M H
3
PO
4
and 0.14 M NaF. The experiments were carried out at room
temperature (22–25
◦
C), with an anodization voltage of 20 V.
The growth of the TiO
2
nanotubes was monitored by taking
FESEM (Fig. 2) images at various time intervals.
Fig. 2 shows that after 120 s of anodization, small pits
started to form on the surface of titanium. These pits increased
in size after 600 s, although still retaining the interpore ar-
eas. A 300-nm-thick nanotubular layer film was obtained after
900 s, and after 1200 s the surface was completely filled with
well-ordered nanotubes. The average diameter of these nan-
otubes was around 100 nm, tube length was 600–650 nm, and
tube wall thickness was 15–20 nm. The barrier layer (junction
between the nanotubes and the metal surface) appeared in the
form of domes connected with one another (Fig. 2). No fur-
ther changes in nanotubular morphology were seen when the
anodization was carried out for up to 3 h, due to the formation
of a barrier layer after 1200 s.
Carrying out the above experiments under magnetic stirring
produced a disordered pore surface after 1500 s, with ordered
nanotubes finally formed only after 2700 s [19]. The length of
the nanotubes was around 400–500 nm.
Fig. 2. FESEM images showing different stages of nanotubular TiO
2
film for-
mation during anodization at 20 V in 0.5 M H
3
PO
4
+ 0.14 M NaF solution with
ultrasonic waves irradiation (a–d) and (e) cross-sectional view of (c) showing
the compact nanotubes and the barrier layer.
The above experiments show that using ultrasonic waves for
anodization can reduce the synthesis time by up to 50% and
increase the length of the nanotubes to 600–650 nm. Fig. 2
shows that that TiO
2
nanotubes prepared by the ultrasonic
method have a narrow pore size distribution (maximum num-
ber of nanotubes in the same pore diameter range), are more
compact (nanotubes are well attached to each other), and are
one-dimensionally oriented (straight) than the nanotubes pre-
pared by magnetic stirring [19].
The formation mechanism of the TiO
2
nanotubes can be ex-
plained as follows [17]. In aqueous acidic medium, titanium
oxidizes to form TiO
2
,
(1)Ti + 2H
2
O → TiO
2
+ 4H
+
.
The pit initiation on the oxide surface is a complex process.
Although TiO
2
is stable thermodynamically at a pH range 2–
12, a complexing ligand (F
−
) leads to substantial dissolution.
The pH of the electrolyte is a deciding factor. The mechanism
of pit formation due to F
−
ions is given by
(2)TiO
2
+ 6F
−
+ 4H
+
→[TiF
6
]
2−
+ 2H
2
O.
This complex formation leads to breakage in the passive ox-
ide layer, with pit formation continuing until repassivation oc-
curs [17,19]. Nanotube formation goes through the diffusion
of F
−
ions and simultaneous effusion of the [TiF
6
]
2−
ions.
The faster rate of formation of TiO
2
nanotubes using ultra-
sonic waves can be explained by the faster mobility of the F
−
ions into the nanotubular reaction channel and effusion of the
[TiF
6
]
2−
ions from the channel.
It is well known that the cavitation effect of ultrasonication
results in implosion of bubbles near the solid surface [20].Col-
lapse of transient bubbles causes a jet of liquid to impinge on
the surface [20]. At a microscopic scale, impingement of a liq-
uid jet on the surface could increase the dissolution reaction
rate. Ultrasonication helps break the double layer and thus has-
tens the diffusion of F
−
ions into the nanotubes and effusion
of [TiF
6
]
2−
ions from the nanotubes. The higher rate is further
confirmed from current versus time plots in Fig. 3. It can be
Fig. 3. Current vs time graph during anodization of Ti in 0.5 M H
3
PO
4
and
0.14 M NaF solution using (a) magnetic stirring and (b) ultrasonic.
S.K. Mohapatra et al. / Journal of Catalysis 246 (2007) 362–369 365
Fig. 4. FESEM images of nanotubular TiO
2
prepared by sonoelectrochemical
method using 0.5 M H
3
PO
4
and 0.14 M fluoride salt solution: (a) NH
4
Fand
(b) KF.
seen that the current observed in the case of anodization us-
ing ultrasonication is almost double that of anodization using
magnetic stirring. Also note that the current saturates within
500–600 s when using ultrasonication, compared with 1000–
1200 s when using magnetic stirring. The saturation of current
with time indicates the development of repassivation, the satu-
ration of nanotube formation. These results are in line with the
findings of our FESEM studies (Fig. 2). Anodization of tita-
nium using other fluoride sources, such as ammonium fluoride
and potassium fluoride, were also carried out using ultrasonic
waves. The FESEM images in Fig. 4 show that the TiO
2
nan-
otube length and pore diameter for NH
4
F and KF are almost
similar to those for NaF under the same anodization conditions.
In the next set of experiments, the applied potential was
varied from 5 to 20 V by keeping the electrolytic solution
(0.5MH
3
PO
4
+ 0.14 M NaF) and time (1200 s) constant. All
of the experiments were performed under ultrasonic waves. As
Fig. 5 shows, TiO
2
nanotubes can be prepared by applying 10–
15 V under these experimental conditions. Anodization of Ti
at 5 V for 1200 s did not give TiO
2
nanotubes; however, an-
odization for 2800 s did form TiO
2
nanotubes (Fig. 5). The pore
diameter of the titania nanotubes decreased with a decrease in
Fig. 5. FESEM images of TiO
2
tubes prepared by sonoelectrochemical method
using 0.5 M H
3
PO
4
and 0.14 M NaF solution at: (a) 15, (b) 10, and (c) 5 V.
applied potential (Fig. 6). The above observations demonstrate
that the pore openings of the TiO
2
nanotubes can be tuned as
required by changing the synthesis parameters. A similar ob-
servation was reported by Bauer et al. in a detailed study on
anodization of titanium with phosphoric acid and hydrofluoric
acid [21].
3.2. Anodization using ethylene glycol medium
The next set of experiments was carried out using eth-
ylene glycol and 0.5 wt% of ammonium fluoride solution.
Fig. 7 shows that the sonoelectrochemical synthesis of titania
nanotubes using ethylene glycol as solvent yielded very-high-
quality ordered (hexagonal) nanotubes with very small (40–
Fig. 6. Effect of applied potential on the pore diameter of the TiO
2
nanotubular structure prepared by sonoelectrochemical method using 0.5 M H
3
PO
4
and 0.14 M
NaF solution.
366 S.K. Mohapatra et al. / Journal of Catalysis 246 (2007) 362–369
Fig. 7. FESEM images of TiO
2
nanotubular arrays prepared by sonoelectro-
chemical method using ethylene glycol and 0.5 wt% NH
4
F solution: (a) ultra-
sonic, (b) magnetic stirring, and (c) cross-sectional view of (a).
50 nm) pore openings. The nanotubular length was 1 µm when
the anodization was carried out at 20 V for 3600 s. For compar-
ison, one experiment was also carried out using ethylene glycol
under the magnetic stirring conditions. Fig. 8 compares the cur-
rent profile of the ultrasonic and magnetic stirring (same area
is exposed to the electrolytic surface) and reveals a higher cur-
rent density for the sonoelectrochemical method compared with
anodization using magnetic stirring. This indicates that the so-
noelectrochemical method provides more rapid titania nanotube
formation. This is further confirmed by the FESEM images of
the nanotubes, with 600-nm tubes obtained after 3600 s of an-
odization.
Fig. 8. Current vs time graph during anodization of Ti in ethylene glycol and
0.5 wt% NH
4
F solution: (a) magnetic stirring and (b) ultrasonic.
3.3. Characterization
The as-prepared TiO
2
nanotubular materials were found to
be amorphous in nature (GXRD); similar results have been
reported by Grimes et al. [22] and Schmuki et al. [23].The
materials were annealed in various temperatures and gaseous
atmospheres to transfer the amorphous TiO
2
nanotubes to crys-
talline materials. A representative XRD pattern of TiO
2
nan-
otubes annealed under N
2
atmosphere at 500
◦
CgiveninFig. 9
shows predominantly anatase TiO
2
[9,22,23].
DRUV–vis spectra of the as-anodized and annealed titania
nanotubes are shown in Fig. 10. It can be seen that the titania
nanotubes annealed under N
2
atmosphere give better absorption
in a visible region (band gap, 2.8–2.9 eV) compared with the
samples annealed under O
2
(band gap, 3.1–3.2 eV). This may
Fig. 9. GXRD pattern of TiO
2
nanotubular arrays prepared by sonoelectrochemical method using 0.5 M H
3
PO
4
and 0.14 M NaF solution at 20 V for 1200 s and
annealed under H
2
at 500
◦
C.
S.K. Mohapatra et al. / Journal of Catalysis 246 (2007) 362–369 367
Fig. 10. DRUV–vis spectra of (a) O
2
annealed UAT, (b) N
2
annealed UAT,
(c) as-prepared UAT, and (d) H
2
annealed TiO
2
nanotubes prepared using eth-
ylene glycol and ultrasonic treatment.
be due to partial incorporation of nitrogen into the TiO
2
matrix
and formation of Ti–N type species, which are responsible for
a red shift in the absorption band [24].
A DRUV–vis spectra of samples prepared using ethylene
glycol and annealed under H
2
gave maximum absorption in
the visible region (Fig. 10). A large red-shift also occurred
for the Ti–O charge transfer transition after incorporation of
carbon into the TiO
2
nanotubes (band gap, 1.9–2.1 eV). This
phenomenon, well documented in the literature, is known as
band gap engineering [25,26]. To verify the incorporation of
carbon into the TiO
2
nanotubes, it was further characterized
using XPS. Fig. 11 shows a typical C1s XPS spectrum of a
TiO
2
nanotubular sample prepared by the sonoelectrochemical
method using ethylene glycol and annealed under H
2
. The spec-
trum shows a broad asymmetric peak in the range 283–290 eV.
The peak can be deconvoluted into two peaks at around 285
and 287.1 eV, corresponding to graphitized carbon and doped
carbonate type species, respectively [27–29]. This confirms the
incorporation of carbon into the titania nanotubes and produc-
tion of TiO
2−x
C
x
types of material. It is also noteworthy that
the extent of carbon doping by this method (62%) exceeds that
in an earlier report on carbon incorporation through acetylene
cracking (13%) [9].
3.4. Photoelectrochemical generation of hydrogen by water
splitting
Fig. 12 summarizes the results of electrochemical hydrogen
generated in terms of the photocurrent of the as-anodized and
annealed TiO
2
samples using simulated 1 sunlight intensity.
Fig. 11. C1s XPS analysis of carbon doped TiO
2
nanotubes prepared by sonoelectrochemical method using ethylene glycol and 0.5 wt% of NH
4
F and annealed
under H
2
.
368 S.K. Mohapatra et al. / Journal of Catalysis 246 (2007) 362–369
Fig. 12. Photocurrent observed by various catalysts prepared by sonoelectrochemical method and magnetic stirring of various treated TiO
2
nanotubular arrays for
water splitting.
Fig. 13. Photo current generated by TiO
2
nanotubes prepared using ethylene glycol and 0.5 wt% NH
4
F solution.
Under anodically polarized conditions, the dark current den-
sity (without illumination) was always <0.001 mA/cm
2
for all
samples. In as-anodized conditions, the nanotubes of TiO
2
are
considered amorphous, and hence the photoelectroactivity was
very low (∼0.15 mA/cm
2
) at 0.2 V vs the Ag/AgCl electrode.
Similar results were also reported by Mor et al. for amorphous
titania nanotubes [30]. However, the annealed titania nanotubes
are crystalline (mostly anatase) and show varied activity de-
pending on the material preparation and annealing atmosphere
(Fig. 12).
Titania nanotubes prepared by the sonoelectrochemical
method and annealed under N
2
atmosphere (N
2
-UAT) gave
better photocurrent (1.35 mA/cm
2
at 0.2 V vs Ag/AgCl) com-
pared with those annealed under O
2
atmosphere (O
2
-UAT,
0.6 mA/cm
2
). This may be due to the lower band gap of the
former. On the other hand, TiO
2
nanotubes prepared using eth-
ylene glycol and annealed under H
2
gave excellent activity
(3.3 mA/cm
2
; Fig. 13). This is due to the lower band gap of
carbon-doped titania nanotubes compared with N
2
- and O
2
-
annealed nanotubes. The lower the band gap of the titania
S.K. Mohapatra et al. / Journal of Catalysis 246 (2007) 362–369 369
nanotubes, the better the activity for water-splitting. Compar-
ing the activity of the titania nanotubes prepared using the
sonoelectrochemical method with that of nanotubes prepared
using magnetic stirring (Figs. 12 and 13) show better activity
in the former. This better activity is due either to the higher
percentage of anatase (GXRD; Fig. 9) in the material, which
aids absorption of the illuminated light, or to better heteroatom
doping (DRUV–vis and XPS; Figs. 10 and 11) into the TiO
2
nanotubes.
4. Conclusion
From the foregoing discussion, it can be concluded that the
sonoelectrochemical method is a highly efficient technique for
quickly synthesizing highly ordered titania nanotubes. The pore
diameter and nanotube length also can be tuned by changing
the applied potential and anodization time. The present study
also has demonstrated that the sonoelectrochemical method us-
ing ethylene glycol as a solvent can be used to synthesize
highly ordered TiO
2
nanotube arrays and incorporate carbon
into titania nanotubes. Carbon incorporation by this method
was found to be more efficient than carbon incorporation from
gases, such as acetylene. Furthermore, these TiO
2
nanotubular
catalysts were found to be highly efficient for water-splitting
using photoelectrochemical methods under the illumination of
sunlight. N
2
-annealed TiO
2
nanotubes were found to be more
efficient for water-splitting compared with nanotubes annealed
under O
2
. However, carbon-incorporated titania nanotubes pre-
pared by the sonoelectrochemical method using ethylene glycol
were found to be highly promising for water-splitting compared
with others. These methods for the synthesis of highly ordered
nanotubes can be extended to other metal systems as well.
Acknowledgments
This work was sponsored by the U.S. Department of Energy
through grant DE-FC36-06GO86066. The authors thank Gau-
tam Priyadharshan and Dr. Mo Ahmadian for their help with in
the experimental work.
References
[1] S. Liu, A. Chen, Langmuir 21 (2005) 8409–8413.
[2] D.V. Bavykin, E.V. Milsom, F. Marken, D.H. Kim, D.H. Marsh, D.J. Ri-
ley, F.C. Walsh, K.H. El-Abiary, A.A. Lapkin, Electrochem. Commun. 7
(2005) 1050–1058.
[3] D.V. Bavykin, A.A. Lapkin, P.K. Plucinski, J.M. Friedrich, F.C. Walsh,
J. Catal. 235 (2005) 10–17.
[4] G.K. Mor, K. Shankar, M. Paulose, O.K. Varghese, C.A. Grimes, Nano
Lett. 5 (2005) 191–195.
[5] J.H. Park, S. Kim, A.J. Bard, Nano Lett. 6 (2006) 24–28.
[6] K.S. Raja, V.K. Mahajan, M. Misra, J. Power Sources 159 (2006) 1258–
1265.
[7] P. Pillai, K.S. Raja, M. Misra, J. Power Sources 161 (2006) 524–530.
[8] T. Gandhi, K.S. Raja, M. Misra, Electrochim. Acta 51 (2006) 5932–5942.
[9] K.S. Raja, M. Misra, V.K. Mahajan, T. Gandhi, P. Pillai, S.K. Mohapatra,
J. Power Sources 161 (2006) 1450–1457.
[10] J.M. Macak, H. Tsuchiya, A. Ghicov, P. Schmuki, Electrochem. Commun.
7 (2005) 1133–1137.
[11] A. Fujishima, K. Honda, Nature 238 (1972) 37–38.
[12] A.J. Bard, Science 207 (1980) 139–144.
[13] J. Zhao, X. Wang, R. Chen, L. Li, Solid State Commun. 134 (2005) 705–
710.
[14] C. Ruan, M. Paulose, O.K. Varghese, G.K. Mor, C.A. Grimes, J. Phys.
Chem. B 109 (2005) 15,754–15,759.
[15] J.M. Macak, K. Sirotna, P. Schmuki, Electrochim. Acta 50 (2005) 3679–
3684.
[16] H. Tsuchiya, J.M. Macak, L. Taveira, E. Balaur, A. Ghicov, K. Sirotna,
P. Schmuki, Electrochem. Commun. 7 (2005) 576–580.
[17] J.M. Macak, H. Tsuchiya, P. Schmuki, Angew. Chem. Int. Ed. 44 (2005)
2100–2102.
[18] Q. Cai, M. Paulose, O.K. Varghese, C.A. Grimes, J. Mater. Res. 20 (2005)
230–236.
[19] K.S. Raja, M. Misra, K. Paramguru, Electrochim. Acta 51 (2005) 154–
165.
[20] T.J. Mason, J.P. Lorimer, Sonochemistry: Theory, Applications and Uses
of Ultrasound in Chemistry, Ellis Horwood, Chichester, 1988, p. 74.
[21] S. Bauer, S. Kleber, P. Schmuki, Electrochem. Commun. 8 (2006) 1321–
1325.
[22] O.K. Varghese, D. Gong, M. Paulose, C.A. Grimes, E.C. Dickey, J. Mater.
Res. 18 (2003) 156–165.
[23] R. Beranek, H. Tsuchiya, T. Sugishima, J.M. Macak, L. Taveira, S. Fuji-
moto, H. Kisch, P. Schmuki, Appl. Phys. Lett. 87 (2005) 243114.1–
243114.3.
[24] R. Asahi, T. Morikawa, T. Ohwaki, K. Aoki, Y. Taga, Science 293 (2001)
269–271.
[25] S.U.M. Khan, M. Al-Shahry, W.B. Ingel Jr., Science 297 (2002) 2243–
2245.
[26] E. Barborini, A.M. Conti, I. Kholmanov, P. Piseri, A. Podesta, P. Milani,
C. Cepek, O. Sakho, R. Macovez, M. Sancrotti, Adv. Mater. 17 (2005)
1842–1846.
[27] C.D. Wagner, W.M. Riggs, L.E. Davis, J.F. Moulder, in: G.E. Muilenberg
(Ed.), Handbook of X-ray Photoelectron Spectroscopy, Perkin–Elmer,
Norwalk, CT, 1979.
[28] S. Sakthivel, H. Kisch, Angew. Chem. Int. Ed. 42 (2003) 4908–4911.
[29] Y. Li, D S. Hwang, N.H. Lee, S J. Kim, Chem. Phys. Lett. 404 (2005)
25–29.
[30] M. Paulose, G.K. Mor, O.K. Varghese, K. Shankar, C.A. Grimes, J. Pho-
tochem. Photobiol. A Chem. 178 (2006) 8–15.