Ethyl carbamate in Swedish and American smokeless tobacco products and some factors affecting its concentration
Bạn đang xem bản rút gọn của tài liệu. Xem và tải ngay bản đầy đủ của tài liệu tại đây (1.2 MB, 17 trang )
McAdam et al. Chemistry Central Journal (2018) 12:86
/>
RESEARCH ARTICLE
Open Access
Ethyl carbamate in Swedish and American
smokeless tobacco products and some factors
affecting its concentration
K. McAdam1*, C. Vas1, H. Kimpton1, A. Faizi1, C. Liu1, A. Porter2, T. Synnerdahl3, P. Karlsson3 and B. Rodu4
Abstract
Background: We are interested in comparing the levels of harmful or potentially harmful constituents in Swedish
and American smokeless tobacco products (STPs). We report here the concentrations of the IARC Group 2 A (probable
human) carcinogen ethyl carbamate (EC) in seventy commercial STPs from the US and Sweden, representing 80–90%
of the market share of the major STP categories in these countries. We also examine the effects of various additives,
processing and storage conditions on EC concentrations in experimental snus samples.
Results: EC was determined from aqueous extracts of the STPs using ultra performance liquid chromatography
tandem mass spectrometry (UPLC/MS/MS). EC was undetectable (< 20 ng/g wet weight basis WWB) in 60% of the
commercial STPs, including all the chewing tobacco (CT), dry snuff (DS), hard pellet (HP), soft pellet (SP), and plug
products. Measurable levels of EC were found in 11/16 (69%) of the moist snuff (MS) samples (average 154 ng/g in
those samples containing EC) and 19/32 (59%) of the Swedish snus samples (average 35 ng/g). For the experimental
snus samples, EC was only observed in ethanol treated samples. EC concentrations increased significantly with ethanol concentrations (0–4%) and with storage time (up to 24 weeks) and temperature (8 °C vs 20 °C). EC concentrations
were lower at lower pHs but were unaffected by adding nitrogenous precursors identified from food studies (citrulline and urea), increasing water content or by pasteurisation. Added EC was stable in the STP matrix, but evaporative
losses were significant when samples were stored for several weeks in open containers at 8 °C.
Conclusions: EC was found in measurable amounts only in some moist STPs i.e. pasteurised Swedish snus and
unpasteurised US MS; it is not a ubiquitous contaminant of STPs. The presence of ethanol contributed significantly to
the presence of EC in experimental snus samples, more significantly at higher pH levels. Sample age also was a key
determinant of EC content. In contrast, pasteurisation and fermentation do not appear to directly influence EC levels.
Using published consumption rates and mouth level exposures, on average STP consumers are exposed to lower EC
levels from STP use than from food consumption.
Keywords: Ethyl carbamate, Urethane, Smokeless tobacco products, Snus, Snuff
Introduction
Although the International Agency for Research on Cancer (IARC) has categorised STPs collectively as Group
1 (known human) carcinogens [1], there is growing evidence from epidemiologic studies that different types of
STPs have different health risks [2]. In the US, the low
*Correspondence:
1
Group Research & Development, British American Tobacco, Regents Park
Road, Southampton SO15 8TL, UK
Full list of author information is available at the end of the article
moisture tobacco powder known as dry snuff (DS), the
higher water-content product known as moist snuff (MS)
and the various forms of predominately high sugar, low
water-content chewing tobacco (CT) are the styles of
STP that have been used historically, while products such
as American snus and various pellet products have been
introduced more recently. In Sweden snus, a high-water
content pasteurised tobacco product is the dominant
STP. In reviews of the comparative health effects of different styles of STP, users of Swedish snus and American
© The Author(s) 2018. This article is distributed under the terms of the Creative Commons Attribution 4.0 International License
(http://creativecommons.org/licenses/by/4.0/), which permits unrestricted use, distribution, and reproduction in any medium,
provided you give appropriate credit to the original author(s) and the source, provide a link to the Creative Commons license,
and indicate if changes were made. The Creative Commons Public Domain Dedication waiver (http://creativecommons.org/
publicdomain/zero/1.0/) applies to the data made available in this article, unless otherwise stated.
McAdam et al. Chemistry Central Journal (2018) 12:86
MS and CT products appear to have lower risks of oral
cavity cancer than users of American DS products [2, 3].
Knowledge of hazardous or potentially hazardous constituents in STPs is therefore of great scientific and public health interest. For this reason, we have undertaken
the analysis of a wide variety of toxicants in STPs used in
Scandinavia and North America as previously published
[4–7].
In a 2007 monograph, IARC listed 27 carcinogenic or
potentially carcinogenic toxicants that had been identified in STPs [1, p. 58–59]. The list included not only
the relatively well-studied tobacco specific nitrosamines
and polycyclic aromatic hydrocarbons (PAH) but also
several toxicants for which there is very limited information, including ethyl carbamate (EC). In 2012 the US
Food and Drug Administration (FDA) included EC in
its Established List of 93 harmful or potentially harmful constituents (HPHC) of tobacco products, some of
which are required to be reported to the FDA [8]. This
list covers both tobacco and tobacco smoke components
and includes 79 that are designated as carcinogenic, and
others that are respiratory toxicants, cardiovascular toxicants, reproductive toxicants or addictive.
EC, or urethane, is the ethyl ester of carbamic acid with
the formula NH2COOC2H5. It is a colourless solid with a
melting point of 48–50 °C, a boiling point of 182–184 °C
[9] and a measurable vapour pressure at room temperature. It is soluble in water and in a wide range of organic
solvents. EC has low mutagenicity in bacterial cells and
gives positive responses in some mammalian cell assays
for chromosomal aberrations, sister chromatid exchange
and micronucleus induction [9]. Although there are
no relevant epidemiologic studies of human exposure,
oral administration of EC to rodents has been shown to
induce tumours in various organs, probably via the formation of the metabolite vinyl carbamate and its epoxide
[9]. Based on animal studies and mechanistic considerations the IARC has classified EC as a Group 2A (probable
human) carcinogen [9].
EC is produced as a naturally occurring by-product
of fermentation. It can be found in low concentrations
in fermented food products such as bread, soy sauce,
yogurt and alcoholic beverages. IARC [9] and the European Food Safety Authority [10] have summarised typical
levels of EC in various foodstuffs and alcoholic beverages. For example, the median level in untoasted bread
is 2.8 ng/g, which rises to 4.3 and 15.7 ng/g when lightly
and darkly toasted. Cheeses contain up to 5 ng/g, while
lower levels (< 1 ng/g) are found in yogurts. Soy sauces
contain up to 129 ng/g, with higher concentrations found
in Japanese-style products. Median (and maximum)
concentrations found in alcoholic beverages originating
from Europe were 0–5 (33) ng/g for beer (depending on
Page 2 of 17
whether undetectable levels were assigned a value of zero
or LOD), 5 (180) ng/g for wine, 21 (6000) ng/g for spirits
and 260 (22,000) ng/g for stone fruit brandy. Sake samples contained a mean of 98 ng/g of EC with a maximum
of 202 ng/g.
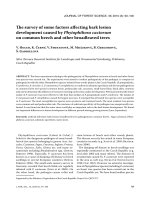
EC is generally thought to be formed in these products by the reaction of various precursors with ethanol
(Fig. 1). For alcoholic beverages such as grape wine, rice
wine and sake, the major precursor is urea derived from
arginine during yeast fermentation [11]. For stone fruit
brandies, in particular, an additional precursor is cyanide,
derived from cyanogenic glycosides such as amygdalin.
Citrulline, derived from the catabolism of arginine by lactic acid bacteria, is also a precursor for EC in wines [12]
as well as in soy sauce, in which ethanol present in the
fermented soy reacts with citrulline during the pasteurisation process to form EC [13].
In 1986, Canada was the first country to introduce limits on the concentrations of EC in alcoholic beverages
[10]. Upper limits for EC were 30 ng/g for wine, 100 ng/g
for fortified wine, 150 ng/g for distilled spirits, 200 ng/g
for sake and 400 ng/g for fruit brandy. Since then the US
and some European Union member states have introduced maximum levels, but there are currently no harmonised maximum EC levels in the European Union.
EC was first reported in two samples of burley tobacco
by Schmeltz et al. in 1978 [14]. One, which had been
treated with maleic hydrazide, contained 310 ng/g
while the other sample, which was untreated, contained
375 ng/g, with both concentrations on a wet weight basis
(WWB). These results were subsequently, and erroneously, reported as being obtained from CT [15] or from
fermented Burley tobacco [1, p. 60]. Since then there
have been several published and unpublished studies of
EC in tobacco samples. Clapp [16] and Clapp et al. [17]
reported that EC concentrations in the tobacco blends of
two US brands of cigarettes were below 10 ng/g (WWB),
which was the limit of quantification (LOQ). In an
unpublished report, Schroth [18] measured concentrations of EC in 13 German cigarette tobacco blends, ten
of which had concentrations below the limit of detection
(LOD, 0.7 ng/g WWB) and the other three with concentrations of between 1.4 and 2.9 ng/g WWB. Teillet et al.
[19] found no EC in 23 commercial cigarette blends and
in seven commercial fine-cut smoking tobacco blends,
and Lachenmeier et al. [20] could not detect EC in a
tobacco liqueur derived from tobacco leaves. Oldham
et al. [21] failed to detect EC in 15 brands of US MS,
using a method with an LOD of 90 ng/g (WWB). In
another recent study, Stepan et al. [22] measured EC concentrations in a number of tobacco samples using ultra
performance liquid chromatography tandem mass spectrometry (HPLC-APCI-MS/MS). The samples consisted
McAdam et al. Chemistry Central Journal (2018) 12:86
Page 3 of 17
Fig. 1 Some pathways to ethyl carbamate in alcoholic beverages after Jiao et al. [48] and [12]
of four reference STPs (CRP1—a Swedish style portion
snus, CRP2—a US MS, CRP3—a US DS and CRP4—a
US CT), 30 commercial STPs and two reference cigarette tobaccos. The LOQ and LOD varied between samples according to moisture content, but when expressed
on a dry weight basis (DWB) were found to be reasonably consistent at 200 and 60 ng/g, respectively. Of the
reference STPs, only CRP2 (MS) had a detectable concentration of EC (38 ng/g WWB); neither of the reference cigarette tobaccos showed measurable levels of EC.
Of the 30 commercial STPs, 17 had no detectable EC, 12
contained EC below the LOQ, and 1 STP had an EC content of 162 ng/g WWB.
Given the lack of understanding of EC in tobacco, a
two-part study of EC in STPs was undertaken. The first
part was a survey of EC concentrations in 70 STPs from
Sweden and the US. These products included loose (L)
and portion (P) snus products from Sweden, and CT, DS,
MS, hard pellet (HP), soft pellet (SP) and plug products
from the US. Based on the results and tentative conclusions of this survey we designed and conducted a series
of tests on experimental snus samples to determine the
effects of processing variables, additives and storage conditions on EC concentrations.
Experimental
Brands of STP included in the survey
STP samples for the survey were obtained in 2009. Products were chosen to reflect a significant proportion of the
market segment for each STP category (Additional file 1,
Tables S1a and S1b). US market share data were obtained
from a commercially available report [23], and Swedish
product market shares were acquired using market monitoring by British American Tobacco (BAT) staff. In total,
the survey comprised 32 Swedish products (10 L snus
and 22 P snus) and 38 US products (13 CT, 5 DS, 2 HP,
1 SP, 16 MS, and 1 plug product). The Swedish products
were sourced from Swedish retail websites, transported
under ambient conditions, imported into the United
Kingdom, and frozen at − 20 °C until analysis. The US
products were sourced from shops in the United States,
transported under ambient conditions, imported, and
McAdam et al. Chemistry Central Journal (2018) 12:86
Page 4 of 17
frozen at − 20 °C until analysis. Product age at time of
sampling is unknown. Clearly, a one-point-in-time sampling regime of this kind does not provide insight into the
long-term chemistry of any individual STP. However, by
sampling the major products for each category we were
able to discuss the EC contents of the product category
as a group at the time of sampling. Products sampled represented approximately 88% of the Swedish snus market,
94% of the American CT market, 96% of the American
MS market and 51% of the American DS market. The single plug product analysed has a 33% market share. Market shares of the pellet products were not available.
The concentrations of a number of other STP constituents were also measured for the market survey samples
in an attempt to understand product parameters that
influence EC content. These parameters were water content by Karl Fisher, water activity, nicotine, total nicotine
alkaloids, total sugars, propylene glycol, glycerol, nitrate,
sodium and chloride ions; methodology used to measure
these parameters is also described below. Finally, concentrations of reducing sugars, ammonia nitrogen and
pH reported previously from the same market survey
[6] were also used to identify factors potentially related
to EC formation; methods for these parameters were
described earlier [6].
Snus samples used in controlled laboratory experiments
Ethyl carbamate
Four different snus variants (A, B, C and D) were manufactured by Fiedler and Lundgren, Sweden, with different
compositions and/or processing conditions in order to
examine the following experimental variables.
1. Storage time post-manufacture: up to 24 weeks.
2.Storage temperature post-manufacture: 8
± 1 and
20 ± 2 °C.
3. Ethanol addition: 0–4%.
4. Urea addition: 0 and 1%.
5. Citrulline addition: 0 and 1%.
6.pH: 8.5 (normal) and 5.5 (treated with citric acid);
with and without sodium carbonate.
7. Evaporation during storage: closed vs open container.
Snus A consisted of unpasteurised tobacco, with no
sodium carbonate and with approximately 33% water.
Snus B contained pasteurised tobacco, with no sodium
carbonate and with approximately 44% water. Snus samples C and D were derived from the same pasteurised
snus sample containing sodium carbonate. The only difference between C and D was that C contained about
55% water, while snus D was dried to about 15% water.
Subsamples were treated after manufacture with ethanol, EC, urea, citrulline or citric acid (or combinations of
these). Urea, citric acid and EC were added in aqueous
solution. Citrulline, which is insoluble in water at neutral
pH, was added as a powder. Each sample in these studies
was analysed for EC in triplicate, with each replicate consisting of 50 g of the snus.
Methods
We describe below analytical methodology used to generate the data in this study. EC was the main focus of
the study, and the method described below was used in
both market survey and controlled laboratory studies.
Eurofins Sweden Ltd. extracted and analysed the STPs
using ultra performance liquid chromatography tandem mass spectrometry (UPLC/MS/MS). The aqueous
extracts were prepared by placing 4 g samples of the STP
in 50 ml polypropylene tubes to which 100 µl of internal
standard (EC-D5, 10 µg/ml) and 20 ml of MilliQ filtered
water were added. The mixture was shaken for 30 min
and then centrifuged at 4000 rpm for 5 min. The supernatant was filtered through a 0.20 µm syringe filter and
transferred to autosampler vials. Samples were quantified
using calibration standards prepared with MilliQ filtered
water. The analysis was performed with a Waters UPLC
coupled to a Sciex API5500 MS, operated under the following conditions:
Ion source: electrospray positive
Column: UPLC HSS T3 2.1 × 100 mm,
1.8 µm
Injection volume: 10 µl
Flow rate: 0.45 ml/min
Mobile phases: A: 0.1% aqueous formic acid, B: acetonitrile
Gradient: 0–4 min (100% A), 4–4.3 min (80% A), 4.3–5.5 min (0% A),
5.5–8 min (100% A)
The transitions used for quantification were 90/62 and
for confirmation 90/44. The transition for the internal
standard was 95/63.
The “as received” WWB LOD was 20 ng/g. Concentrations of EC between the LOD and LOQ (60 ng/g) were
estimated by Eurofins, using peak areas taken from the
chromatogram but the uncertainty in these measurements was much greater than for concentrations > LOQ.
This is due to the diverse matrix interference effects
found across the range of market survey STPs. The same
EC method was used for the experimental part of the
investigation, but the LOD (10 ng/g) and LOQ (30 ng/g)
were lower due to the use of the same basic, relatively
simple product recipe used for all the test samples.
McAdam et al. Chemistry Central Journal (2018) 12:86
Karl Fischer water
STP samples were analysed for their water content using
Karl Fischer Coulometric analysis with a KEM MKC500 analyser (Kyoto Electronics, Tokyo, Japan). Approximately 2 g of STP was accurately weighed into a 25 ml
snap-top vial. 20.0 ml of methanol was added, and the
sample sonicated for 15 min before being allowed to
steep and settle for at least 2 h. A 100 μl aliquot of the
methanol solution was injected into the Karl Fischer
analysis cell. Water blanks were subtracted, and analyses
conducted in triplicate.
Nicotine, propylene glycol and glycerol
These compounds were determined by extracting 1.0 g
of pre-moistened tobacco with 50 ml methanol (HPLC
grade) containing heptadecane internal standard; the
sample is shaken in a stoppered container for 3 h at
150 rpm. The extract is filtered through a 0.45 μm PVDF
filter, and 1 μl of the filtered extract injected using a splitless injector. Separation occurred using helium carrier
gas and a Phenomenex ZB-Waxplus (30 m × 0.53 mm
i.d. × 1.00 μm) capillary column. The initial oven temperature was 120 °C, which was held for 4 min before
temperature ramping at 20 °C/min to 230 °C with a 4 min
final hold time; detection was by FID. Elution times were
7.01 min for n-heptadecane, 8.55 min for nicotine, and
11.01 min for glycerol.
Nitrate nitrogen
Nitrate nitrogen was determined by aqueous extraction
of 0.25 g tobacco in 25 ml deionised water with shaking at
180 rpm for 30 min. The extract is filtered through Whatman No. 40 filter paper prior to analysis using continuous flow analysis. Nitrate content of the STPs is analysed
using reduction of the nitrate to nitrite with hydrazinium
sulphate in the presence of copper (sulphate) catalyst, followed by reaction with sulphanilamide to form the diazo
compound which is coupled with N-1-naphthylethylenediamine dihydrochloride to form a coloured complex, for
which the absorbance is determined at 520 nm.
Total nicotine alkaloids and total sugars
Total nicotine alkaloids and total sugars were analysed
at BAT Southampton using continuous flow analysis.
An aqueous extract of the ground STP (0.25 g in 25 ml
deionised water) was prepared. The total sugars were
calculated as the sum of reducing and non-reducing
sugars, whereby reducing sugars were determined using
methods described previously [6]. Non-reducing sugars
were hydrolysed by the action of the enzyme invertase
within the flow system, and the total non-reducing sugars then present were determined in a similar way. The
Page 5 of 17
total nicotine alkaloids were determined by reaction
with sulphanilic acid and cyanogen chloride. The developed colour was measured at 460–480 nm.
Water activity
2 g of each tobacco sample was placed into a disposable sample cup, which was inserted into a Labcell Ltd.
Aqualab 3TE water activity meter. The measuring vessel is closed and readings taken. The Aqualab analyser
was calibrated using saturated salt solutions (6 M NaCl
and 0.5 M KCl).
Sodium and chloride ions
Each STP sample was analysed for sodium and chloride in triplicate. One (± 0.1) g of STP was accurately
weighed into a 50 ml labelled centrifuge tube. Forty
(± 1) ml of fresh (equilibrated at room temperature)
deionised water (18.2 MΩ) water was dispensed into
each STP-containing centrifuge tube. The tubes were
shaken for 1 h at 200 rpm on an orbital shaker and
then centrifuged for 5 min at 4600 rpm. Each sample
was diluted 100-fold by transferring 0.1 ml of centrifuged extract using a 100 μl Gilson pipette into a 40 ml
plastic sterilin tube containing 9.9 ml of water and mixing thoroughly. The sample was transferred to a plastic
1.5 ml autosampler vial and capped. A sodium chloride stock solution was prepared by accurately weighing out between 33 and 36 mg of pure sodium chloride
(> 99.9%, Fisher Certified Analytical Reagent, Fisher
Chemicals, P/N: S/3160/53) directly into a 40 ml plastic sterilin pot. Deionised water (18.2 MΩ) was added
using P10 and P5 ml air displacement Gilson pipettes,
to give a 25 mM (1.461 mg/ml) solution. A 2.5 mM
intermediate standard solution was prepared by diluting the stock solution by a factor of 10. The instrument
was calibrated using working standard solutions of
sodium chloride (with concentrations of 10, 25, 50, 100,
250 and 500 µM), prepared from the sodium chloride
stock or intermediate working standards by appropriate
dilution. The diluted extracts and calibration solutions
were analysed with a Dionex ICS-3000 Ion Chromatography System. The reporting limit equates to 0.92 mg/g
WWB for sodium ions and 1.42 mg/g WWB for chloride ions.
Results
Product survey
Results for EC concentrations in the STP samples are
shown, product-by-product, in Additional file 1: Tables
McAdam et al. Chemistry Central Journal (2018) 12:86
Page 6 of 17
S1a and S1b, together with the other analytes measured
in this study.
EC concentrations in commercial STPs
The concentrations of EC were below the LOD (20 ng/g
WWB) for all the CT, DS, HP, SP, and plug products. In
contrast, EC was detected in four of the ten L snus, 15 of
the 22 P snus, and in 11 of the 16 MS products. Averages
by category of STP product (on a WWB) were calculated
by assigning values of LOD/2 (i.e. 10 ng/g) to samples
that had levels of EC less than LOD [24]. EC averages and
ranges of concentrations (in ng/g WWB) were as follows:
P snus 28.1 (range < LOD–84); L snus 20.4 (range < LOD–
37); MS 109 (range < LOD–688). When expressed on
a DWB, concentrations in snus and MS approximately
doubled in line with the moisture content of the STP.
The results of the survey demonstrate that although EC
was present in certain categories of STPs, the majority of samples in our study did not contain measurable
concentrations.
Comparison with literature values
Literature reports of EC concentrations in tobacco, as
outlined in the Introduction, are compared to those
measured in the current study in Table 1. Our results,
and those of Stepan et al. [22], both of which found no
measurable EC in the majority of the analysed samples,
demonstrate that EC is not ubiquitous in tobacco. The
average WWB concentrations for EC in the MS samples
we investigated are consistent with the concentrations
found by Stepan et al. [22], and considerably lower
(109 ng/g) than the 315 and 375 ng/g concentrations
reported by Schmeltz et al. [14] for two Burley tobacco
samples. However, it should be noted that there was
a wide range of concentrations in our results for MS:
from undetectable (< 20 ng/g) up to 688 ng/g. Thus,
the tobacco samples for which EC has been reported in
the literature are within the range found in our current
study.
Variation within STP type and between manufacturers
Although EC was found in snus and MS products and
not in the other styles of STP, differences between EC
concentration were only significant (at 95% CI) between
MS and CT. Further analysis showed that for snus there
was no consistent significant difference (at 95% CI)
in EC concentrations between manufacturers, which
means that it is unlikely that a unique manufacturing
step may be responsible for generating EC. For the MS
samples, only the single PM brand, Marlboro Original,
was significantly different from the other brands, and
hence, for this sample, there may be a unique factor
responsible for the high EC level measured.
Correlations between EC and other tobacco components
We measured a number of other components and properties of the STPs in this study: water content, water
Table 1 Comparison of literature values for ethyl carbamate in tobacco to values measured in the current study
Tobacco type
Previous studies
The current study
Samples measured
[EC]
(ng/g WWB)
References
17 Lsnus
< 60 (DWB)
Stepan et al. [22]
12 Psnus
< 60–284 (DWB)
15 MS
< 90
CRP2
38
Dry snuff
–
Chewing tobacco
CRP 4
Hard pellet
Swedish snus
Samples measured
[EC]
(ng/g WWB)
10 Lsnus
< 20–37
22 Psnus
< 20–84
Oldham et al. [21]
16 MS
< 20–688
–
–
5 DS
< 20
< 60 (DWB)
Stepan et al. [22]
13 CT
< 20
–
–
–
2
< 20
Soft pellet
–
–
–
1
< 20
US snus
1
< 90
Oldham et al. [21]
–
–
Burley tobacco
2 Experimental samples
310, 375
Schmeltz et al. [14]
–
–
Cigarette blends
10 German blends
< 0.7
Schroth [18]
–
–
3 German blends
1.4–2.9
–
–
2 US blends
< 10
Clapp et al. [17]
–
–
23 US blends
< LODa
Teillet et al. [19]
–
–
7 FCSA blends
< LODa
–
–
US moist snuff
Fine cut smoking
tobacco (FCSA)
a
Unspecified
McAdam et al. Chemistry Central Journal (2018) 12:86
Page 7 of 17
Table 2 Correlations between ethyl carbamate and STP
constituents
Pearson correlation coefficient, R, and p
value
All values included
Values < LOD excluded
All brands
Karl Fisher water
0.285 (0.013)
0.223 (0.236)
All brands except US snus
Karl Fisher water
0.274 (0.022)
0.223 (0.236)
Water activity
0.167 (0.167)
− 0.058 (0.762)
pH
0.125 (0.301)
Total nicotine alkaloids
0.087 (0.475)
Nicotine
0.131 (0.278)
0.219 (0.245)
− 0.167 (0.167)
− 0.188 (0.319)
Reducing sugars
Total sugars
Nitrate
− 0.222 (0.237)
0.270 (0.149)
− 0.176 (0.146)
− 0.189 (0.317)
− 0.169 (0.182)
− 0.621 (0.001)
0.029 (0.821)
Propylene glycol
Glycerol
0.641 (0.000)
− 0.341 (0.006)
− 0.329 (0.101)
Chloride ion
0.368 (0.002)
0.348 (0.060)
Sodium ion
0.365 (0.002)
0.423 (0.020)
Ammonia nitrogen
0.455 (0.000)
0.701 (0.000)
Correlations were calculated from wet weight basis concentrations
In the first column R was calculated by assigning a value of 10 ng/g to ethyl
carbamate for values < LOD. In the second column R was calculated by excluding
all values < LOD for ethyl carbamate
LOD limit of detection
activity, nicotine, nicotine alkaloids, total sugars, propylene glycol, glycerol, and nitrate, sodium and chloride
ions. These are shown in Additional file 1: Tables S1a and
S1b. Concentrations of reducing sugars, ammonia nitrogen and pH have already been published for these STPs
[6]. To identify factors that may be related to EC formation, the Pearson correlation coefficients (R) were calculated between the EC concentrations (WWB) and these
parameters, all expressed on a WWB. These and the p
values are shown in Table 2. The results in the first column were obtained by assigning a value of LOD/2 (i.e.
10 ng/g) to EC concentrations < LOD. Results in the second column included only brands for which EC > LOD.
Across all the samples, there was a significant correlation (R = 0.285, p = 0.013) between Karl Fisher water
content and EC concentration for all the brands in the
study (Table 2). However, when only the values > LOD
were tested the correlation failed to reach significance.
This can be explained by examination of a plot of Karl
Fisher water vs EC concentration (Fig. 2) which shows
that almost all the STPs with measurable EC have water
contents above 40%, but EC does not increase with
increasing water content above this level. A similar pattern is observed for water activity (Aw), in which EC is
only detected for brands with Aw > 0.8 (Fig. 3).
There were significant correlations between EC and
glycerol (R
= −
0.341), ammonia nitrogen (R
= 0.455),
chloride (R = 0.368) and sodium ions (R = 0.365) when
700
Ethyl carbamate ng/g WWB
600
500
400
300
200
100
20
0
0
10
20
30
40
Karl Fisher Moisture (%)
Fig. 2 Ethyl carbamate (ng/g WWB) vs Karl Fisher water (%). The LOD is denoted by the reference line at 20 ng/g
50
McAdam et al. Chemistry Central Journal (2018) 12:86
Page 8 of 17
700
Ethyl carbamate (ng/g WWB)
600
500
400
300
200
100
20
0
0.4
0.5
0.6
0.7
0.8
0.9
1.0
Water Activity
Fig. 3 Ethyl carbamate (ng/g WWB) vs water activity. The LOD is denoted by the reference line at 20 ng/g
EC concentrations < LOD were included. When samples
with EC concentrations
<
LOD were excluded, water,
glycerol, and chloride were not significantly correlated
(p > 0.05) with EC. However, nitrate (R = 0.641), propylene glycol (R = − 0.621), ammonia nitrogen (R = 0.701)
and sodium ions (R = 0.423) were significantly correlated.
EC contents of experimental snus samples
Four specially manufactured snus products (snus A, B, C
and D, as described in “Experimental” section) were used
to test, in a controlled manner, the effects of a number
of process and content parameters on EC concentrations.
The aim of these experiments was to understand the relevance of processing, storage and chemical composition
on EC concentrations in snus. Given that different STPs
are processed in different ways and differ in their chemical compositions, findings of the snus study should not
be extrapolated to other STP categories.
Processing and storage
The effect of processing conditions: pasteurisation, processing pH and moisture content Baseline concentrations of
EC were determined post-manufacture on tobacco samples A, B and C, which contained no added ethanol, urea
or citrulline and were unaged (Additional file 1: Table S2).
The samples ranged in moisture content from 33 to 55%,
included both pasteurised and unpasteurised samples,
and both with and without sodium carbonate. All samples
had EC concentrations < LOD (i.e. < 10 ng/g).
Storage time After storage for 4 and 12 weeks at 8 °C,
all EC concentrations were also < LOD. The EC concentration of snus C was also < LOD after storage for
4 weeks at 20 °C (Additional file 1: Table S2). There was
no difference between samples processed with moisture
contents of 44 and 55%, no difference between samples
processed with and without pasteurisation, and no influence of sodium carbonate. These results demonstrate no
intrinsic EC formation by the standard snus product—
consistent with the survey data on the F&L product.
Stability of EC in snus To understand the stability of
EC in snus, 200 ng/g of EC was added to samples of snus
C and stored at 8 °C for 4 and 12 weeks, either in an
open or in sealed glass containers. The snus EC concentrations after storage in the closed container (200.3 ng/g
at 4 weeks and 193.3 ng/g at 12 weeks) were not significantly different (at 95%) to the level (200.0 ng/g) before
storage, which suggests that EC is stable in the snus
matrix. However, after storage of the snus in open containers there were significant reductions in the EC concentrations: 16% after 4 weeks and 71% after 12 weeks.
These reductions were probably due to evaporative
losses (Additional file 1: Table S3).
McAdam et al. Chemistry Central Journal (2018) 12:86
Page 9 of 17
Impact of ingredients/constituents on EC concentrations
in snus
Ethanol One of the commonly cited pre-cursors of EC,
ethanol, is generated in tobacco during curing, possibly by
the actions of yeasts, and is also naturally present in cured
tobacco leaf [25]. Although levels have not been quantified, naturally occurring ethanol could potentially react
with other nitrogenous tobacco pre-cursors to form EC
(Fig. 1).
Investigation of the role of ethanol in snus EC generation was conducted in two phases. In the first phase ethanol was added to portions of snus C in concentrations of
0.5, 1, 1.5, 2 and 4% and then stored for 4 weeks at 8 and
20 °C and 12 weeks at 8 °C. (Additional file 1: Table S4).
Significant and linear increases in EC concentration
were observed as ethanol concentrations increased. The
increases were greater in the samples stored at 20 °C than
in those stored at 8 °C. EC levels after 12 weeks at 8 °C
were approximately double those found after 4-weeks
storage.
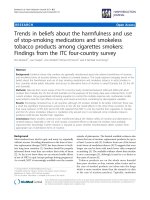
Given the influence of ethanol on EC levels in these
snus samples, a second phase experiment was conducted
to better define the kinetics of EC generation. In the second phase experiment, snus samples with added ethanol
were stored for up to 24 weeks at 8 °C or 20 °C (Additional file 1: Table S5). This longer-term study showed
that EC continued to be formed over the 24-week storage
period. EC concentrations after 24 weeks were linearly
correlated with ethanol concentrations at both storage
temperatures (for both, R2 = 0.99), as shown in Fig. 4.
There were also linear correlations between storage times
and EC concentrations. Figure 5 shows plots of EC concentration vs storage time for the samples containing 2%
ethanol. Linear correlation coefficients were 0.99 and
0.98 for storage at 8 and 20 °C respectively. EC contents
in samples stored at 20 °C were 3 ± 0.4 times higher than
those stored at 8 °C.
Effects of urea and/or citrulline on EC concentrations The
two most commonly cited nitrogenous pre-cursors of EC
in food-stuffs, urea and citrulline were also added at 1% to
portions of snus C containing either 0 or 1% ethanol, and
stored for 4 weeks at either 8 or 20 °C, and for 12 weeks
at 8 °C before analysis for EC (Additional file 1: Table S6).
The samples containing urea or citrulline without ethanol
had EC concentrations < LOD, i.e. there was no effect on
EC content. With 1% ethanol, the urea treated samples
had mean EC concentrations not significantly different (at
95%) from those obtained by 1% ethanol treatment alone.
Similarly, the citrulline treated samples with 1% ethanol had mean EC concentrations not significantly different to those obtained by treatment with 1% ethanol
alone (Additional file 1: Table S6). However, the mean
EC concentration after storage at 20 °C (32.7 ng/g) was
18% lower than obtained by treatment with only ethanol (39.7 ng/g). This difference was significant at 95%.
The EC concentration in the sample with 1% ethanol and
1% citrulline stored for 12 weeks at 8 °C (17.7 ng/g) was
500
Storage
Temperature
(°C)
8±1
20 ± 2
Ethyl Carbamate (ng/g)
400
y = 112.24x + 24.57
R² = 0.99
300
200
100
y = 36.42x + 11.98
R² = 0.99
0
0
1
2
3
4
Ethanol (%)
Fig. 4 The effects of storage temperature and ethanol concentration on mean ethyl carbamate concentrations in an experimental STP after
24 weeks storage
McAdam et al. Chemistry Central Journal (2018) 12:86
Page 10 of 17
300
Storage
Temperature
(°C)
8±1
20 ± 2
Ethyl carbamate (ng/g)
250
200
y = 3.337x + 7.38
R² = 0.99
150
100
50
y = 12.89x - 3.17
R² = 0.99
0
0
5
10
15
20
25
Time point (weeks)
Fig. 5 The effects of storage temperature and storage time on mean ethyl carbamate concentrations in an experimental STP containing 2%
ethanol
significantly lower (at 95%) than that in the 1% ethanol
sample with no added citrulline (20.3 ng/g).
Urea and citrulline were also added together at 1% to
samples of snus C containing 4% ethanol (Additional
file 1: Table S7). One of the snus samples had a moisture
of 55%, while the other had been dried to 15% prior addition of these compounds. The EC concentrations were
measured after 4 weeks at 20 °C and compared with EC
concentrations in a sample with only 4% ethanol and
no urea or citrulline. The EC concentrations in the 55%
moisture content samples treated with urea and citrulline were significantly (at 95%) lower than the 4% ethanol
comparator. EC levels in the 15% samples were not significantly different.
These results show no positive contribution of citrulline or urea to EC formation in STPs and suggest a possible countering effect with citrulline.
Snus water content For snus containing 4% ethanol
(but no other additives) and stored for 4 weeks at 20 °C
there was no significant difference in EC concentrations
in the product containing 55% moisture compared with
the same product dried to 15% before storage (Additional
file 1: Table S7). Similarly, for snus containing 4% ethanol and 1% urea and 1% citrulline there was no significant
difference (at 95%) in EC concentrations after storage at
20 °C between the product at 55% moisture and that at
15% moisture.
Snus pH Snus D treated with citric acid to obtain a pH of
5.5 but with no ethanol, urea or citrulline had an EC concentration < LOD, as did the pH 8.5 comparator. When
treated with 4% ethanol, snus D at pH 5.5 had an EC concentration of 28 ng/g, which was significantly lower than
in a comparable sample of snus D at pH 8.5 (114 ng/g—
Additional file 1: Table S8).
Discussion
Mechanisms for EC formation in tobacco
The observed variation in levels of EC, both between and
within different styles of STP is intriguing. In this section
we discuss possible mechanisms for EC formation in light
of both the product survey results and those of the controlled snus experiments.
STP processing
Fermentation Fermentation is an established environment in which EC can be generated in food and alcoholic
beverages. The role proposed by Schmeltz et al. [14] for
fermentation in the generation of EC in tobacco and
smoke echoes the mechanisms used to explain formation
of EC in foodstuffs. Two of the STP styles investigated in
the current work, DS and MS, undergo fermentation steps
as part of their manufacture (Table 3). During tobacco fermentation, the tobacco is moistened and microbes and/
or enzymatic activity modifies its chemical composition.
McAdam et al. Chemistry Central Journal (2018) 12:86
Page 11 of 17
However, the results of this work and that of Stepan
et al. [22] do not support fermentation as an important
source of EC in STPs. EC was not detected in any sample
from one fermented product style (DS) in either study,
whereas it was detected in some samples of MS in both
studies. If fermentation was a critical mechanism, it could
be expected that EC would be seen in all fermented samples, unless there are significant differences in fermentation steps between these product categories or processes
used by manufacturers. Additional file 1: Table S9 shows
the blend composition of the STP CRPs, but offers little
obvious alternative explanation for the substantial differences in EC contents between DS and MS. Furthermore,
our study demonstrated measurable EC levels in a significant number of Swedish snus products—which do not
undergo fermentation during their production. We therefore conclude that fermentation is not a critical step for
EC formation in STPs.
Pasteurisation Temperature is also a factor leading to
the presence of EC in food. Studies of EC formation in
bread and puddings [12], in wine [26, 27] and in soy sauce
[13] have shown that concentrations increase rapidly with
temperature. It is therefore plausible that the pasteurisation process conducted during snus manufacture, which
involves holding tobacco at high temperatures, contrib-
utes to EC formation from pre-established precursors
within the tobacco. However, the experiments on experimental snus samples conducted in this work showed no
impact of pasteurisation on EC levels. Moreover, while
there were measurable concentrations in some of the
commercial Swedish snus samples, other Swedish snus
samples showed no EC content. Clearly, were pasteurisation an important parameter it would be expected that
EC would be seen in most if not all snus samples. Finally,
EC was also seen in MS samples where high temperature
pasteurisation does not take place. We therefore conclude
from these observations that the elevated temperature
conditions used in manufacture of some STPs is not in
itself a critical step in EC formation.
Snus processing moisture and pH Our measurements
with experimental snus samples showed no sensitivity to
tobacco pH or moisture content during processing. However, these observations are limited to snus, and cannot be
extrapolated to other STPs.
EC stability in storage Finally, our experiments have
shown that EC, although chemically stable in snus, is sufficiently volatile that significant amounts can evaporate
from open containers over a period of several weeks.
Table 3 Characteristics of different types of STP
Primary
tobacco types
used
Fermented Pasteurised Sodium
chloride*
Sodium
or potassium
carbonate (%)
Pack water*
(%)
Humectant*
Sugar*
pH*
MS
Dark fire-cured
and air cured
burley
Yes
No
Yes
< 1%
ca 50
0–4.36%
No
6.4–8.4
DS
Dark fire cured
and air cured
burley
Yes
No
Small amount
ca 2%
< 10
0–0.24%
No
8.1–9.5
Swedish snus Air-cured
burley and
sun-cured
Oriental
No
Yes
Yes
ca 2%
ca 50
PG (L and P:
No
2–3.5%), glycerol (L only:
1–3%)
7.5–9.4
CT
Air cured cigar
tobacco,
burley and/
or dark fire
cured
No
No
Small amount
No
ca 20
Glycerol (ca 3%) 23–40% 5.6–6.5
Plug
Air-cured burley No
and/or dark
fire cured
No
N/D
No
18
Glycerol (1.7%)
15%
5.3
HP
N/D
No
No
No
N/D
2
No
5%
8
SP
N/D
No
No
No
N/D
13
No
5%
5.3
Levels are reported on a wet weight basis
N/D not determined or unknown, MS moist snuff, DS dry snuff, CT chewing tobacco, HP hard pellet, SP soft pellet, L snus loose snus, P snus portion snus, PG propylene
glycol
* Data are from this study. If not maked information taken from Klus et al. [49] and Wahlberg and Ringberger [50].
McAdam et al. Chemistry Central Journal (2018) 12:86
Chemical composition of STPs
Ethanol
As discussed above, ethanol, is generated during curing,
and is present in cured tobacco leaf [25]. It is therefore a
plausible precursor for EC as shown in Fig. 1.
In the experimental study on snus, the only samples in
which there were detectable concentrations of EC were
those that contained added ethanol. The effect of added
ethanol on EC concentrations was striking. Even with the
lowest concentration of ethanol (0.5%) used in the study
a significant concentration of EC (27 ng/g) was generated
in the snus after 24 weeks at 8 °C. However, the molar
conversion of ethanol to EC observed in these experiments was low, at 1
0−3–10−4 %. There were also clear,
linear, temperature- and time-dependent increases in EC
concentrations as ethanol concentrations increased from
0.5 to 4%. For example, for the 24-week period, raising
the storage temperature from 8 to 20 °C increased EC
concentrations in all ethanol-containing snus samples
threefold. This implies an activation energy of the order
of 63 kJ/mol.
As discussed above, the findings from the snus experimental study cannot be extrapolated to other STP
categories, due to differences in their processing and
composition. However, to understand the possible relevance of the findings from our laboratory snus studies to
the wider range of commercial STPs, we examined available composition data on STP manufacturers’ websites.
Our search confirmed that ethanol is added to some STPs
as an ingredient, or as a processing aid. For example, the
ingredient data sheets provided by the US Tobacco (UST)
arm of Altria [28] shows that for UST products ethanol
is an ingredient in MS, but not in DS manufactured by
UST. Swedish Match provides percentage compositions of their Swedish snus products [29]. Ethanol is not
amongst the quantified ingredients, but it is disclosed as
a processing aid in their STPs. EC was quantified in 11 of
the 14 Swedish Match P snus products, but in only two of
the six L snus products analysed in this study. Finally, the
Fiedler and Lundgren products measured in this study
were ethanol-free [30], and EC was not detected in these
products.
Therefore, this limited inspection of commercial STP
composition suggests that ethanol addition may be an
important factor leading to EC generation in those STPs
it is found in. The concept that the addition of a known
EC-precursor to an STP during manufacture would result
in increased levels of EC in STPs is logical in principle
and would point to the predominant formation-stage of
EC as post-manufacture, during the product shelf-life. If,
as seems likely, there is significant EC production in STPs
post-manufacture, then the age of the sample at the time
of analysis will be a contributing factor to the levels of EC
Page 12 of 17
measured in these samples, as found previously with the
acrylamide contents of STPs [5]. As the age of the STP
at the time of analysis is an uncontrollable variable in the
type of product survey conducted in this study, it would
be manifest as unexplained variation in the measurement
data—consistent with the observations of this study.
We also assessed potential errors in our product survey measurements arising from EC generation in storage post-sampling and pre-analysis. Use of the activation
energy estimate of 63 kJ/mol, and an EC production rate
of 3.5 ng/g/week for a 2% addition of ethanol predicts
a low level of EC 0.2 ng/g/week at the − 20 °C storage
temperatures used. Over the approximately 3-month
period between sampling and analysis, we would expect
2–3 ng/g EC to develop, which is small in comparison to
the values measured for STPs containing EC.
Nitrogenous species
Some of the nitrogenous precursors involved in the formation of EC in foods and alcoholic beverages are also
present in cured tobacco. During curing, tobacco proteins break down to amino acids and other soluble
nitrogen compounds. In particular, relatively high concentrations of the acid amide, arginine, are formed during air curing of tobacco, [31] probably by the action of
tobacco enzymes on glutamine or proline. As curing progresses and the leaf structure is compromised, microbes
enter the leaf structure and arginine is hydrolysed with
the loss of ammonia to form citrulline. Urea, which can
be formed by the catabolism of arginine, has also been
reported in Burley tobacco [32].
Citrulline and urea Addition of two different nitrogenous precursors, urea and/or citrulline, failed to generate
detectable levels of EC in snus even after storage under
the same conditions. The addition of urea and/or citrulline to the ethanol containing snus did not increase levels
of EC. In fact, there were some indications that addition
of citrulline may decrease EC concentrations. Clearly,
there are sufficient levels of nitrogenous precursors in the
tobacco that the ethanol concentration is the rate-limiting factor in the formation of EC. The identity of these
nitrogenous precursors is unclear, however the product
survey provided some insights as to the relative importance of various nitrogenous constituents of tobacco. The
lack of impact from urea or citrulline addition suggests
that either there are considerably more reactive precursors present in tobacco, or substantially greater quantities
than the 1% levels of urea/citrulline added in this study; of
these two possibilities the first appears more likely.
Other nitrogenous components of tobacco One of the
major nitrogenous compounds in tobacco is nicotine.
McAdam et al. Chemistry Central Journal (2018) 12:86
However, the product survey showed no correlation of EC
concentrations with nicotine, or total nicotine alkaloids.
In contrast, the survey showed significant correlations
between EC and ammonia nitrogen (R = 0.455) across
all STPs (the correlation increases (R = 0.701) when only
brands with measurable levels of EC are considered), and
nitrate when products < LOD were excluded from the
analysis. The first correlation is consistent with the generation of ammonia during the enzymatic and microbial
changes to tobacco during curing and possibly fermentation, particularly formation of arginine. This may point to
an important role of tobacco processing on the generation of EC nitrogenous precursors, rather than EC itself.
An alternative nitrogenous precursor was proposed by
Schmeltz et al. [14], who originally hypothesized that EC
in tobacco leaf and smoke may be formed from maleic
hydrazide used as a plant growth regulator on tobacco.
However, tobacco treated with maleic hydrazide did not
contain more EC than untreated tobacco. The authors
therefore concluded that EC formation in tobacco was
unrelated to maleic hydrazide.
Storage water content
A notable observation within this study was that the
styles of STP with measurable EC (P snus, L snus and
MS) had, on average, higher moistures (42–49%) than
those that did not (HP—2%, DS—9%, SP—13%, Plug—17
and CT—22%). EC was therefore only observed in this
study in products with a water content > 22%. Our data
also showed a similar effect with water activity, where
those products with measurable EC levels all had water
activities > 0.8 (Fig. 3). However, it should be noted that
some products with Aw > 0.8, and water content > 22%
had no detectable levels of EC. These observations led to
a significant but weak correlation (R = 0.285, p = 0.013)
between EC and moisture content across all survey STPs
(Table 2). However, EC content was not correlated with
water content or Aw amongst only those STPs containing
EC.
As reactions between ethanol and nitrogenous EC
precursors are aqueous reactions, the level of free water
within the tobacco/STP matrix could dictate the hydrolytic solvation properties within the STP, and therefore
potentially the rate of solution-phase reactions. Above
threshold levels, where sufficient free water is available
to allow solvated reactions to occur, changes in water
level would be unimportant. This hypothesis supports
some but not all of the observed trends in EC content
between STPs of differing water content, and also differences in EC content between DS (and Swedish snus) and
MS. However, inconsistent with the solvation mechanism
hypothesis, in the experiments with experimental snus
samples reducing moisture from 55 to 15% had no effect
Page 13 of 17
on generation of EC during storage of snus containing
4% ethanol over a period of 4 weeks. Critically, the 15%
water content experimental snus samples containing EC
were drier than those commercial samples, that did not
contain EC.
pH
Although there was no significant correlation between
pH and EC concentrations from the survey results, pH
differed between those categories of commercial STP
that showed no detectable EC levels (CT and DS—which
are the most acidic at pH 6.1), and those that did (snus
and MS—which have a more alkaline pH, averaging 8.5
and 7.8 respectively). Within STP category there was no
trend between STP pH and EC content. The experimental snus samples showed a dramatic effect of tobacco pH;
lowering the pH from 8.5 to 5.5 reduced EC concentrations fourfold in ethanol-containing snus. This suggests
that pH is a critical parameter in EC generation when
ethanol is present, based upon the experimental snus
samples. As an understanding of this observation, it is
plausible that more acidic pH’s may retard EC formation by protonating and ‘protecting’ the amine groups of
nitrogenous tobacco precursor(s). Protonation of amines
occurs at tobacco pHs with nicotine being a well-studied
example [33].
Other STP components
Another major difference between styles with and without EC is the salt level. As shown in Table 3, Swedish
snus and MS have higher salt loadings than other styles
of STP. This is reflected in significant (p < 0.05) correlations between EC and sodium (R = 0.365) and chloride
(R = 0.368) ions. High salt levels are also present in soy
sauce, which is notable for the presence of significant
concentrations of EC [9]. However, it is not clear if, and
how, sodium and chloride ions may be involved in EC
formation, other than indirectly as a marker for higher
moisture. Glycerol is significantly and negatively correlated (R = − 0.341) with EC across all samples of STPs.
It is not used in P snus, DS or MS (except for 2 brands).
However, it is added to L snus brands (Table 3) and many
of these have measurable amounts of EC. Glycerol, being
hygroscopic can act to lower Aw, alternatively, these
observations may be simple association between the
presence of EC in some STPs and common ingredients,
rather than mechanistically relevant factors.
Conclusions as to the mechanism for EC generation in STPs
Interpretation of our survey findings has suggested a
mechanism for the presence of EC in STPs is base-mediated conversion of ethanol via nitrogenous compounds
in tobacco. EC content of experimental snus samples
McAdam et al. Chemistry Central Journal (2018) 12:86
increased with time after application of ethanol and was
noticeably temperature dependent. The nitrogenous precursors in tobacco have not been identified, but oftencited food precursors to EC, urea and citrulline, were not
important reactants in our study. Previously proposed
processing factors, including fermentation and high
temperature tobacco processing such as pasteurisation,
showed no impact on EC levels, although they may possibly influence the generation of nitrogenous precursors
in tobacco. This mechanism is consistent with the observations of the current, and previous studies. However,
while the observations by Schmeltz et al. [14] of EC in
Burley tobacco, and by Oldham et al. [21] in a reference
MS product, may reflect this mechanism, for example via
ethanol content arising during leaf processing, they may
also point to additional relevant factors not identified in
the present study.
Exposure to EC from STP use
Like foods and beverages, exposure of consumers to EC
from STP use will depend on its concentration in the STP
and the level of STP consumption by the consumer. However, for STPs there are two other factors to consider that
are not usually relevant for foods and beverages. Firstly,
since the STP is not itself ingested, we have to determine
the amount of EC extracted from the STP during use.
Secondly, with specific reference to snuffs and chewing
tobaccos, the amount of expectoration that occurs with
use must also be assessed. These factors are considered in
the following paragraphs in order to estimate exposure of
STP users to EC.
Daily consumption
Several studies have reported Swedish snus consumption
amongst a population of STP users. Andersson et al. [34]
found the average daily consumption of Swedish portion
snus was 14.4 g snus/day among 23 users of portion snus,
and 20.8 g snus/day among 22 users of loose snus. In a
much larger study [35], 2914 snus users reported average
daily consumptions of 11–12 g/day for portion snus and
29–32 g/day for loose snus.
Maxwell [36] estimated average MS consumption
amongst US users in 1980 as 7.3 g/day (one and one-half
34 g tins per week). The Surgeon General’s 1986 report
on smokeless tobacco assumed a rate for MS of 10 g/day
[37]. In 1988, Hatsukami et al. [38] reported an average
consumption of 12.4 g/day amongst male adult consumers of US MS. Hecht et al. [39, 40] reported an average
consumption of 20.4 g/day (4.2 tins per week) of MS
(mainly Copenhagen, Skoal and Kodiak brands). Hecht
et al. [41] also reported a considerably lower consumption of 5.3 g/day (1.1 ± 0.8 tins/week). The average of
these daily consumption values is 11.1 g/day.
Page 14 of 17
Extraction
The amount of an STP constituent extracted during use
is termed mouth level exposure or MLE, which is often
reported as the percentage of the constituent extracted
during use. MLEs have not been reported in the literature for EC. However, a range of values for other watersoluble constituents has been published. Digard et al. [42]
determined MLEs for a range of Swedish snus constituents. The most water-soluble such as nicotine, propylene
glycol and TSNAs, chloride, sodium, ammonium and
nitrate ions, had mean extractabilities ranging from 24
to 38% after 1 h of use. Caraway and Chen [43] obtained
similar results for users of a US snus. They found average
levels of nicotine extraction of 39%, and average TSNA
extraction levels in the range 9.5–30% depending on the
particular TSNA. With extraction of soluble constituents from snus not exceeding 40%, we would expect EC,
which is also water-soluble, to have similar extractability.
Unfortunately, no data are available for the extraction of
constituents from other STPs during use.
Expectoration
Snus in Sweden is routinely placed in the upper lip and
consumers do not expectorate, but users of snuff and
chewing tobacco in the US generally expectorate during
use, which would tend to reduce exposure to extracted
STP contaminants such as EC. To our knowledge, the
only study of toxicant losses due to expectoration was a
study of NNK exposure in 15 MS users [41]. The NNK
in the expectorated saliva as a proportion of the initial
amount in the MS portion ranged from 0 to 48.7% with
an average of 14.2%.
Exposure
We have estimated average exposures to EC from use of
Swedish snus using the concentrations found in the present study, together with the average consumption from
Digard et al. [35], and an estimated extraction efficiency
for EC of 40% based on published data for other watersoluble STP components. These are tabulated in Table 4.
Estimated exposures to EC amongst Swedish portion
snus consumers are, on average, 0.13 µg/day, whereas
Swedish loose snus consumers would be exposed to an
average of 0.25 µg/day. For MS, exposure was estimated
using the average of reported consumption rates (11.1 g/
day) and using a value of 14% for losses through expectoration [41]. This gives an average estimate for exposure to
EC from MS as 0.41 µg/day. Users of CT, DS and pellet
products will be exposed to levels lower than these estimates for Swedish snus and US MS.
These amounts would be in addition to the amounts of
EC obtained from dietary sources, which are discussed in
the next section.
McAdam et al. Chemistry Central Journal (2018) 12:86
Page 15 of 17
Table 4 Estimated exposures (µg/person/day) to EC from Swedish snus and American MS
STP
Mean EC by STP style
(ng/g)
Consumption (g/day)
Estimated average
extraction of EC (%)
Estimated expectoration
losses (%)
Estimated
EC
Exposure
(µg/day)
Swedish P snus
28.1
11.5
40
0
0.13
Swedish L snus
20.4
30.7
40
0
0.25
US MS
109
11.1
40
14
0.41
Comparison to exposure from other sources
As mentioned in the Introduction the main contributors to dietary EC (excluding alcoholic beverages) are
fermented products such as soy sauce, bread (especially
when toasted), yogurts and cheeses. The Joint FAO/
WHO Expert Committee on Food Additives (JECFA) has
estimated that food products in general (excluding alcoholic beverages), contribute on average less than 1 µg EC
per person per day [10]. Therefore, on average, consumers of STPs appear to be exposed to EC levels (≤ 0.41 µg/
day) lower than reported average dietary exposure (1 µg/
day). In addition the European Food Safety Authority
(EFSA) has estimated the contribution of alcoholic beverages to EC exposure, which can be substantially higher
than from STP use. Based on survey data from various European countries and based on median EC levels
found in European beverages, drinkers at the 95th percentile level of consumption who drank exclusively beer
(1000 ml/person/day), wine (417 ml/person/day) or spirits (125 ml/person/day) increased EC exposure by 0–5,
2.1 and 2.6 μg/person/day, respectively. For consumers
of stone fruit brandy at the 95th percentile level (125 ml/
person/day), EC exposure increased by 32.5 μg/person/
day.
Risk characterisation
In 2005 a conference of the European Food Safety
Authority (EFSA) evaluated several approaches for estimating health risks from contaminants that are both
genotoxic and carcinogenic [44, 45]. The margin of
exposure (MOE) was the preferred approach but it was
emphasized that it could be used to prioritise risk management actions but could not be used to evaluate health
risk itself. The MOE is a ratio between a benchmark dose
(a reference point derived from either experimental or
epidemiological dose–response data, usually selected as
a 10% response) and the specific human exposure. With
higher values of MOE representing lower risk, MOEs
greater than or equal to 10,000 are generally considered
a low priority for risk management actions [44, 46, 47].
EFSA has specifically used the MOE approach, with
a benchmark dose (BDML) of 0.3 mg/kg BW/day, to
determine the level of concern that should be accorded
to the presence of EC in foods and alcoholic beverages
[10]. Use of EFSA MOE figures allows for the calculation that exposures to EC totalling less than 1.8 µg per
person per day would correspond to an MOE of 10,000
or more, and hence would not be a high priority for risk
management. It was estimated that a maximum dietary
exposure excluding alcoholic beverages was 1 μg EC/person per day (equivalent to an MOE of 18,000) which is
therefore well below the threshold for concern. Assessing the impact of average exposure to EC amongst STP
users from Swedish snus or US MS, in addition to food
exposure, shows that total daily exposure remains substantially below the threshold exposure level of 1.8 µg per
person per day. Similarly, exposure to EC through use of
the other STPs examined in this study will not substantially increase exposure to EC beyond food-based exposure. According to the standard approach with MOE
calculations, EC content of STP should therefore be
regarded as a low priority for risk management actions
[44, 46, 47].
Conclusions
Our survey of Swedish and US STPs found that the
majority (60%) examined, including all the CT, DS, plug
and pellet products, did not have detectable EC levels
(i.e. < 20 ng/g WWB). Only three of the seven categories
of STP (MS, L snus and P snus) contained detectable levels of EC. Within these three categories, a significant percentage of products had EC concentrations < LOD (41%
of the snus products and 31% of the MS products). Using
estimated EC concentrations (LOD/2) for products with
EC < LOD gave mean concentrations for these three categories of 109, 20 and 28 ng/g WWB for MS, L snus and P
snus respectively. However, the difference in average EC
concentrations between the snus and MS styles of STP
was not statistically significant. Levels of EC across all the
STPs examined in this study were significantly and positively correlated with levels of moisture, ammonia nitrogen, sodium and chloride and negatively correlated with
glycerol. The presence of EC was limited to STPs with
moistures greater than 40% and Aw greater than 0.8, and
to styles of STP with higher pH.
McAdam et al. Chemistry Central Journal (2018) 12:86
Controlled laboratory experiments using experimental
snus samples provided valuable insights into factors leading to EC formation. The experiments showed unequivocally that, within the experimental parameters, none of
the ethanol-free snus samples had detectable levels of EC
and that addition of ethanol was necessary for the formation of EC. We also found that addition of nitrogenous
precursors that have been associated with EC formation in other products did not increase EC concentrations in snus. The effect of ethanol on EC formation was
enhanced by increases in storage time and temperature,
was faster at higher pH conditions, but was not affected
by moisture content. The role of fermentation and high
temperature processing such as pasteurisation did not
appear to be important in the production of EC. Nitrogenous pre-cursors to EC appear to be naturally present in
tobacco, but their identity remains unclear.
Using published consumption rates for STPs and
mouth level exposures to STP components we estimate
that consumers of MS, DS, CT, pellet products and Swedish snus with average levels of EC would be exposed to
levels lower than those present in the normal diet. MOE
calculations suggest that these levels would not be considered a health concern to the consumer. Even without
factoring in the proportion extracted during use, Rodu
and Jansson [2] showed that exposures to lead, cadmium,
polonium, formaldehyde and benzo(a)pyrene from use
of STPs were consistent with normal dietary exposure,
and concluded that these contaminants were not a health
concern to STP users. We can now add EC to this list.
Additional file
Additional file 1. Additional Tables.
Abbreviations
CT: chewing tobacco; DWB: dry weight basis; DS: US dry snuff; EC: ethyl
carbamate; FDA: US Food and Drug Administration; HP: hard pellet; LOQ: limit
of quantification; LOD: limit of detection; L snus: Swedish loose snus; MOE:
margin of exposure; MS: US moist snuff; P snus: Swedish portion snus; SP: soft
pellet; STP: smokeless tobacco product; UPLC/MS/MS: ultra performance liquid
chromatography tandem mass spectrometry; WWB: wet weight basis.
Authors’ contributions
KM co-directed the study and co-wrote the manuscript. HK and AF project
managed the product survey. CV, CL, TS and PK project managed the study
on experimental snus samples. AP co-wrote the manuscript. BR co-directed
the study and contributed to writing the manuscript. All authors read and
approved the final manuscript.
Author details
1
Group Research & Development, British American Tobacco, Regents Park
Road, Southampton SO15 8TL, UK. 2 3810 St. Antoine W, Montreal, QC H4C
1B4, Canada. 3 Eurofins Food & Feed Testing Sweden AB, Sjöhagsgatan 3,
531 40 Lidköping, Sweden. 4 Department of Medicine, School of Medicine,
University of Louisville, Room 208, 505 South Hancock Street, Louisville, KY
40202, USA.
Page 16 of 17
Competing interests
The study was funded by British American Tobacco (BAT). At the time of the
study KM, CV, CL, HK, and AF were employees of BAT. AP is a paid consultant
to BAT. BR’s research is funded in-part by unrestricted grants from Tobacco
Manufacturers (including BAT) to the University of Louisville. TS and PK are
employees of Eurofins.
Publisher’s Note
Springer Nature remains neutral with regard to jurisdictional claims in published maps and institutional affiliations.
Received: 2 May 2018 Accepted: 16 July 2018
References
1. IARC (2007) Smokeless tobacco and some tobacco-specific N-nitrosamines. In: IARC monographs on the evaluation of carcinogenic risks to
humans, Vol 89. IARC Press, Lyon
2. Rodu B, Jansson C (2004) Smokeless tobacco and oral cancer: a review of
the risks and determinants. Crit Rev Oral Biol Med 15:252–263
3. Royal College of Physicians (2007). Harm reduction in nicotine addiction:
helping people who can’t quit. A report by the Tobacco Advisory Group
of the Royal College of Physicians. RCP, London
4. McAdam K, Faizi A, Kimpton H, Porter A, Rodu B (2013) Polycyclic
aromatic hydrocarbons in US and Swedish smokeless tobacco products.
Chem Cent J 7:151
5. McAdam K, Kimpton H, Essen S, Davis P, Vas C, Wright C, Porter A, Rodu
B (2015) Analysis of hydrazine in smokeless tobacco products by gas
chromatography–mass spectrometry. Chem Cent J 9:13
6. McAdam K, Kimpton H, Vas C, Rushforth D, Porter A, Rodu B (2015) The
acrylamide content of smokeless tobacco products. Chem Cent J 9:56
7. McAdam K, Kimpton H, Porter A, Liu C, Faizi A, Mola M, McAughey J,
Rodu B (2017) Comprehensive survey of radionuclides in contemporary
smokeless tobacco products. Chem Cent J 11:131
8. FDA (2012) Harmful and potentially harmful constituents in tobacco
products and tobacco smoke: established List. />coProducts/GuidanceComplianceRegulatoryInformation/ucm297786.
htm Accessed 6 Dec 2016
9. IARC (2010) Alcohol consumption and ethyl carbamate. In: IARC monographs on the evaluation of carcinogenic risks to humans, Vol 96. IARC
Press, Lyon
10. European Food Safety Authority (EFSA) (2007) Ethyl carbamate and
hydrocyanic acid in food and beverages. Scientific opinion of the panel
on contaminants. EFSA J 551:1–44
11. Ough CS, Crowell EA, Mooney LA (1988) Formation of ethyl carbamate
precursors during grape juice (Chardonnay) fer- mentation. I. Addition of
amino acids, urea, and ammonia: effects of fortification on intracellular
and extracellular precursors. Am J Enol Viticult 39:243–249
12. Hamlet CG (2009) Ethyl carbamate (urethane). In: Stadler RH, Lineback DR
(eds) Process-induced food toxicants; occurrence, formation, mitigation
and health risks. Wiley, Hoboken, pp 285–320
13. Matsudo T, Aoki T, Abe K, Fukuta N, Higuchi T, Sasaki M, Uchida K (1993)
Determination of ethyl carbamate in soy sauce and its possible precursor.
J Agric Food Chem 41:352–356
14. Schmeltz I, Chiong KG, Hoffmann D (1978) Formation and determination of ethyl carbamate in tobacco and tobacco smoke. J Anal Toxicol
2:265–268
15. Brunnemann, K.D. & Hoffmann, D. (1992) Chemical composition of
smokeless tobacco products. In: Smokeless Tobacco or Health. An International Perspective (Smoking and Tobacco Control Monograph No. 2;
NIH Publ. No. 93-3461), Bethesda, MD, National Cancer Institute
16. Clapp WL (1996) Determination of ethyl carbamate in commercial
cigarettes. Legacy tobacco documents 517201448-517201453. https://
www.industrydocumentslibrary.ucsf.edu/tobacco/results/#q=51720
1448-517201453&h=%7B%22hideDuplicates%22%3Atrue%2C%22hid
eFolders%22%3Atrue%7D&subsite=tobacco&cache=true&count=1
Accessed 6 Dec 2016
McAdam et al. Chemistry Central Journal (2018) 12:86
17. Clapp WL, Gordon BM, Wendelboe FN (1996) Determination of ethyl
carbamate in tobacco products. Presentation, 50th tobacco chemists
research conference
18. Schroth, A (1992) Development and application of an analytical method
for detection and screening of ethyl carbamate (urethane) in tobacco.
Legacy tobacco documents 2074570640-2074570654. https://www.
industrydocumentslibrary.ucsf.edu/tobacco/docs/#id=yldy0082.
Accessed 6 Dec 2016
19. Teillet B, Verron T, Cahours X, Colard S, Purkis S (2014) Challenges of HPHC
analyses: the limit of quantification. Presentation, Coresta conference,
Quebec. erialtobaccoscience.com/files/pdf/smokeanaly
sis/Challenges_of_HPHC_analyses_the_limit_of_quantification.pdf.
Accessed 6 December 2016
20. Lachenmeier DW, Breaux TA, Kuballa T, Schlee C, Monakhova YB (2014)
Composition of distilled Perique tobacco liqueur: a connoisseur’s spirit or
a health risk due to nicotine? Food Chem 159:230–235
21. Oldham MJ, DeSoi DJ, Rimmer LT, Wagner KA, Morton MJ (2014) Insights
from analysis for harmful and potentially harmful constituents (HPHCs)
in tobacco products. Regul Toxicol Pharmacol. https://doi.org/10.1016/j.
yrtph.2014.06.017
22. Stepan H, Pani J, Pummer S, Weber M-T, Hofbauer L, Pour G, MayerHelm B, Werneth M (2015) Sensitive determination of ethyl carbamate
in smokeless tobacco products and cigarette smoke using SPE and
HPLC-APCI-MS/MS. Chromatographia 78:675–681
23. Maxwell JC (2010). The Maxwell report: the smokeless tobacco industry in
2009. Richmond, VA
24. Verbovšek T (2011) A comparison of parameters below the limit of
detection in geochemical analyses by substitution methods. RMZ Mater
Geoenviron 58(4):393–404
25. Stedman RL (1968) The chemical composition of tobacco and tobacco
smoke. Chem Rev 68:153–207
26. Stevens DF, Ough CS (1993) Ethyl carbamate formation: reaction of urea
and citrulline with ethanol in wine under low to normal temperature
conditions. Am J Enol Viticult 44:309–331
27. Liu SQ, Pritchard GG, Hardman MJ (1994) Citrulline production and ethyl
carbamate (urethane) precursor formation from arginine degradation by
wine lactic acid bacteria Leuconostoc oenos and Lactobacillus buchneri.
Am J Enol Viticult 45:235–242
28. Altria (2015) Our products and ingredients. ria.com/ourcompanies/ussmokeless/our-products-ingredients/Pages/default.aspx
Accessed 6 Dec 2016
29. Swedish Match (2016) Ingredients in snus. dishmat
ch.com/Our-business/Snus-and-moist-snuff/Ingredients-in-snus/?tab=1
Accessed 6 Dec 2016
30. British American Tobacco (2016) Ingredients. -ingredient
s.com/servlet/PageMerge?i_btn1=%3E%3E&TMP=2&i_show=Y&altur
l=%2Fgroupms%2Fsites%2FBAT_6X3ENK.nsf%2FvwPagesWebLiv
e%2FD23047A62F4081DB8025725E0067DFAF%3Fopendocument&i_
CTRY=Sweden+Domestic&mainurl=%2Fgroupms%2Fsites%2FBAT
_6X3ENK.nsf%2FvwPagesWebLive%2FEEB7C53A3AC263148025728
B005D9C0D%3Fopendocument&i_INGURL=/groupms/gbl_ing_v3.nsf/
vwMarketDetailsProductsTrans/LIVESNUSSweden+Domestic2014ENG
LISH/$file/TICALL.html?openelement&usealt=i_btn4%2Ci_show
Accessed 6 Dec 2016
31. Johnstone RAW, Plimmer JR (1959) The chemical constituents of tobacco
and tobacco smoke. Chem Rev 59:885–936
32. Carugno N, Neri M, Lionetti G (1974) Quantitative determination of
free and protein-bound amino acids of tobacco. Beitrage Zur Tabak Int
7:222–227
Page 17 of 17
33. Clayton PM, Vas CA, Bui TT, Drake AF, McAdam K (2013) Chirality
35(5):288–293
34. Andersson G, Björnberg G, Curvall M (1994) Oral mucosal changes and
nicotine disposition in users of Swedish smokeless tobacco products: a
comparative study. J Oral Pathol Med 23:161–167
35. Digard H, Errington G, Richter A, McAdam K (2009) Patterns and behaviors of snus consumption in Sweden. Nicotine Tob Res 11:1175–1181
36. Maxwell JC (1980) Chewing, snuff is growth segment. Tobacco Rep
107:32–35
37. Surgeon General (1986) Report of the Surgeon General’s Advisory
Committee on the health consequences of using smokeless tobacco.
US Department of Health and Human Services. Public Health Service,
Bethesda, Maryland 20992. NIH Publication No. 86-2874
38. Hatsukami DK, Keenan RM, Anton DJ (1988) Topographical features of
smokeless tobacco use. Psychopharmacology 96:428–429
39. Hecht SS, Carmella SG, Murphy SE, Riley WT, Le C, Luo X, Mooney M,
Hatsukami DK (2007) Similar exposure to a tobacco-specific carcinogen
in smokeless tobacco users and cigarette smokers. Cancer Epidemiol
Biomarkers Prev 16:1567–1572
40. Hecht SS, Carmella SG, Edmonds A, Murphy SE, Stepanov I, Luo X,
Hatsukami DK (2008) Exposure to nicotine and a tobacco-specific carcinogen increase with duration of use of smokeless tobacco. Tob Control
17:128–131
41. Hecht SS, Carmella SG, Stepanov I, Jensen J, Anderson A, Hatsukami DK (2008) Metabolism of the tobacco-specific carcinogen
4-(methylnitrosamino)-1-(3-pyridyl)-1-butanone to its biomarker total
NNAL in smokeless tobacco users. Cancer Epidemiol Biomarkers Prev
17:732–735
42. Digard H, Gale N, Errington G, Peters N, McAdam K (2013) Multi-analyte
approach for determining the extraction of tobacco constituents from
pouched snus by consumers during use. Chem Cent J 7:55
43. Caraway JW, Chen PX (2013) Assessment of mouth-level exposure to
tobacco constituents in US snus consumers. Nicotine Tob Res 15:670–677
44. European Food Safety Authority (EFSA) (2005) Meeting summary report
EFSA/WHO international conference with support of ILSI Europe on risk
assessment of compounds that are both genotoxic and carcinogenic,
Brussels. pp 16–18
45. Barlow S, Renwick AG et al (2006) Risk assessment of substances that are
both genotoxic and carcinogenic. Food Chem Toxicol 44:1636–1650
46. Lachenmeier DW, Kanteres F, Rehm J (2011) Epidemiology-based risk
assessment using the benchmark dose/margin of exposure approach:
the example of ethanol and liver cirrhosis. Int J Epidemiol 40:210–218
47. Lachenmeier DW, Przybylski MC, Rehm J (2012) Comparative risk
assessment of carcinogens in alcoholic beverages using the margin of
exposure approach. Int J Cancer 131:E995–E1003
48. Zhihua Jiao, Yachen Dong, Qihe Chen, (2014) Ethyl Carbamate in
Fermented Beverages: Presence, Analytical Chemistry, Formation
Mechanism, and Mitigation Proposals. Compr Rev Food Sci Food Saf
13(4):611–626
49. Klus H, Kunze M, König S, Pöschl E (2009) Smokeless tobacco – an overview. Beiträge zur Tabak Int 23:248–278
50. Wahlberg I, Ringberger T (1999) Smokeless tobacco. In: Davis DL, Nielsen
MT (eds) Tobacco production, chemistry and technology. Chapter 14.
Coresta Monograph, Blackwell Science, pp 452–460