Determination of heavy metals in the soils of tea plantations and in fresh and processed tea leaves: An evaluation of six digestion methods
Bạn đang xem bản rút gọn của tài liệu. Xem và tải ngay bản đầy đủ của tài liệu tại đây (4.36 MB, 13 trang )
Rashid et al. Chemistry Central Journal (2016) 10:7
DOI 10.1186/s13065-016-0154-3
RESEARCH ARTICLE
Open Access
Determination of heavy metals
in the soils of tea plantations and in fresh
and processed tea leaves: an evaluation of six
digestion methods
Md. Harunur Rashid1, Zeenath Fardous2, M. Alamgir Zaman Chowdhury1*, Md. Khorshed Alam1,
Md. Latiful Bari2, Mohammed Moniruzzaman3 and Siew Hua Gan4
Abstract
Background: The aim of this study was to determine the levels of cadmium (Cd), chromium (Cr), lead (Pb), arsenic
(As) and selenium (Se) in (1) fresh tea leaves, (2) processed (black) tea leaves and (3) soils from tea plantations originating from Bangladesh.
Methods: Graphite furnace atomic absorption spectrometry (GF-AAS) was used to evaluate six digestion methods,
(1) nitric acid, (2) nitric acid overnight, (3) nitric acid–hydrogen peroxide, (4) nitric–perchloric acid, (5) sulfuric acid,
and (6) dry ashing, to determine the most suitable digestion method for the determination of heavy metals in the
samples.
Results: The concentration ranges of Cd, Pb, As and Se in fresh tea leaves were from 0.03–0.13, 0.19–2.06 and
0.47–1.31 µg/g, respectively while processed tea contained heavy metals at different concentrations: Cd (0.04–
0.16 µg/g), Cr (0.45–10.73 µg/g), Pb (0.07–1.03 µg/g), As (0.89–1.90 µg/g) and Se (0.21–10.79 µg/g). Moreover, the soil
samples of tea plantations also showed a wide range of concentrations: Cd (0.11–0.45 µg/g), Pb (2.80–66.54 µg/g), As
(0.78–4.49 µg/g), and Se content (0.03–0.99 µg/g). Method no. 2 provided sufficient time to digest the tea matrix and
was the most efficient method for recovering Cd, Cr, Pb, As and Se. Methods 1 and 3 were also acceptable and can be
relatively inexpensive, easy and fast. The heavy metal transfer factors in the investigated soil/tea samples decreased as
follows: Cd > As > Se > Pb.
Conclusion: Overall, the present study gives current insights into the heavy metal levels both in soils and teas commonly consumed in Bangladesh.
Keywords: Fresh tea, Black tea, Heavy metals, Nitric acid, Hydrogen peroxide, Perchloric acid, Dry ashing, GF-AAS
Background
Tea (Camellia sinensis L.) is one of the most popular
nonalcoholic beverages, consumed by over two-thirds
of the world’s population for its medicinal, refreshment
and mild stimulant effects [1]. Tea leaves contain polyphenols such as epigallocatechin 3‐gallate, which has
*Correspondence:
1
Agrochemical and Environmental Research Division, Institute
of Food and Radiation Biology, Bangladesh Atomic Energy Research
Establishment, Savar, Dhaka 1349, Bangladesh
Full list of author information is available at the end of the article
many medicinal properties, including antioxidant [2],
cholesterol-lowering [3], hepatoprotective [4] and anticancer activities [5]. Moreover, its detoxifying properties
are essential in the elimination of alcohol and toxins [5].
However, considering that an estimated 18 billion cups of
tea are consumed daily worldwide [6], its economic and
social importance is unprecedented. In fact, tea has been
reported to be valuable in the treatment and prevention
of many diseases [6].
Ideally, tea should be free from contaminants such as
heavy metals, which are toxic and harmful to the human
© 2016 Rashid et al. This article is distributed under the terms of the Creative Commons Attribution 4.0 International License
( which permits unrestricted use, distribution, and reproduction in any medium,
provided you give appropriate credit to the original author(s) and the source, provide a link to the Creative Commons license,
and indicate if changes were made. The Creative Commons Public Domain Dedication waiver ( />publicdomain/zero/1.0/) applies to the data made available in this article, unless otherwise stated.
Rashid et al. Chemistry Central Journal (2016) 10:7
body because of their non-biodegradable nature, long
biological half-lives and persistent accumulation in different body parts [7]. Tea is consumed in all of Bangladesh
throughout the year, and Bangladesh is one of the leading
tea producing and exporting countries in the world [8].
In 2006, Bangladesh exported approximately 5 million kg
of tea leaves, and this figure continues to increase even
while the total local tea consumption in the country is
reported to be 39 million kg [8].
Tea processing and packaging in Bangladesh is dependent on the type of tea, with a wide variety available in the
country that is produced by different processing steps.
However, the common steps involve the (1) hand plucking of tea leaves by the local farmers, (2) the weighing
of tea leaves and (3) transportation to factories. Freshly
plucked tea leaves are fragile, and as the first step in processing, the leaves are laid out to dry for several hours
to allow them to “wither” as their moisture content
decreases. The leaves are then rolled and oxidized, which
alters their flavor and gives the processed tea its final
appearance and color. The above steps are also known
as Crush-Tear-Curl (CTC). The next step involves firing
(final drying process), a process that is initiated once the
tea leaves have dried. This is followed by visually sorting into various batches of similar sizes and color before
being packaged and commercialized both nationally and
internationally. For black tea, the leaves are rolled immediately after withering to quickly initiate the oxidation or
fermentation processes. The leaves are then completely
oxidized before they are dried, which is how they acquire
their dark color and rich flavor.
Tea safety has piqued great interest because contaminants threaten the life and health of humans, animals
and the environment, leading to economic losses [2]. The
genetic and epigenetic effects of dietary heavy metals
such as cadmium (Cd), chromium (Cr), lead (Pb), arsenic
(As) and selenium (Se) in the human body are associated
with an increased risk of different cancers [9]. Prolonged
consumption of heavy metals from food can lead to their
accumulation in the kidney and liver, causing disruption
of numerous biochemical processes and potentially causing cardiovascular, nervous, kidney and bone diseases
[10].
Elemental analysis of a tea sample requires destruction of the organic fraction of the sample, leaving the
heavy metals either in solution or in a form that is readily dissolved. Unfortunately, because of a large number
of analytes and a variety of sample types, there is no
universal sample preparation technique that meets all of
the diverse requirements. Among the strategies for sample preparation, dilution, acid digestion and extraction
are the most commonly considered [11–20]. Microwave
digestion, wet digestion and dry ashing are commonly
Page 2 of 13
utilized for the total decomposition of organic matter in
samples [11, 21, 22]. Apart from these techniques, ultrasound-assisted solubilisation/extraction sample preparation procedures were reported to be used for green and
black tea samples [23].
Dry ashing consists of the ignition of organic compounds by air at atmospheric pressure and at relatively
elevated temperatures (450–550 °C) in a muffle furnace.
The resulting ash residues are dissolved in an appropriate acid. Wet digestion is used to oxidize the organic portion of samples or to extract elements from inorganic
matrices by means of concentrated acids or mixtures
there of [24]. Compared to dry ashing, wet digestion may
be performed with a wide variety of potential reagents.
Although many types of acids, including hydrochloric
acid (HCl), nitric acid (HNO3), sulfuric acid (H2SO4),
perchloric acid (HClO4), and hydrogen peroxide (H2O2),
are used to digest organic samples and soils [11, 25], it
remains undetermined which type of acid/acid mixture is
the most suitable.
In addition, little is known about the relative recovery
of heavy metals from tea leaves, and there are no standard official methods in Bangladesh for the digestion of
tea to determine heavy metals. Moreover, to our knowledge, there is limited data on the amount of heavy metals
in fresh tea leaves, processed tea or soils from tea plantations in Bangladesh. Therefore, the aims of this study
were (1) to determine the concentrations of common
heavy metals such as Cd, Cr, Pb, As and Se in tea leaves
and soils from tea plantations; (2) to report the degree
of contamination and daily intake of toxic heavy metals via tea (3); to measure the interaction of heavy metal
concentrations in fresh tea leaves, processed tea and soils
from tea plantations by analyzing the transfer factor (TF);
and (4) to evaluate six digestion methods using different
acid combinations and recommend the most appropriate
digestion method for determining the levels of five heavy
metals in tea samples.
Experimental
Chemicals and reagents
Heavy metal reference standards for Cd, Cr, Pb, As, and
Se were purchased from Kanto Chemical (Tokyo, Japan).
Digestion chemicals including HCl, HNO3, H2SO4,
HClO4, and H2O2 were of analytical grade and were purchased from Merck (Darmstadt, Germany).
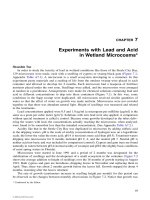
Description of study area
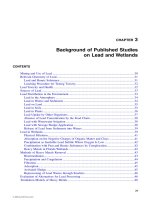
The samples were collected from two main tea growing
areas (Moulvibazar and Sylhet) (Fig. 1). Moulvibazar is
also known as the capital of tea production in Bangladesh, with miles and miles of tea gardens that look like
green carpets. These areas have over 150 tea gardens,
Rashid et al. Chemistry Central Journal (2016) 10:7
Page 3 of 13
Fig. 1 Sampling location of tea gardens and leaves
including three of the largest tea gardens in the world
both in area and production.
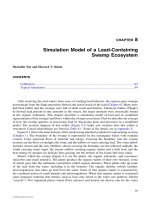
Collection and preservation of samples
Fresh tea leaves (n = 10) were randomly collected from
five different tea gardens in the Sylhet district (n = 5),
with the remaining from the Moulvibazar district (n = 5)
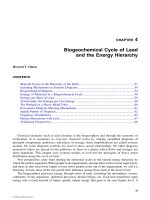
(Fig. 2). Each collection consisted of 500 g of tea leaves
and was authenticated by a botanist. For black tea, five
processed tea samples were randomly purchased from
the local market in Moulvibazar, with another five from
the local market in Sylhet. The samples were supplied by
the local tea gardens from the same areas. Purchased tea
sample were processed by plucking, withering, rolling,
oxidation and firing. First, the leaves were harvested by
hand. After plucking, the leaves were laid out to wilt or
wither for several hours to prepare for further processing. During withering, the leaves were gently fluffed,
rotated and monitored to ensure that an even exposure
to air. Then, the leaf was put through a rolling machine to
mince, twist and break it into even smaller pieces. After
rolling, the leaves were laid out to rest for several hours,
allowing oxidation (the process in which oxygen in the
air interacts with the exposed enzymes in the leaf, turning the sample to a reddish-brown color and changing
the chemical composition) to occur. This step also has
Fig. 2 The investigated samples of (a) fresh tea leaves (b) processed/black tea and (c) soils from the tea plantations
Rashid et al. Chemistry Central Journal (2016) 10:7
the greatest impact in the creation of the many wonderful
and complex flavors in tea. The final step in the production process is to “fire” or heat the leaves quickly to dry
them to below 3 % moisture content and to stop the oxidation process to ensure that the tea samples were kept
well. During rolling and withering step of tea processing,
tea may be considered to be contaminated.
Soils from tea plantations (n = 10) were randomly
collected from locations similar to where the 10 fresh
tea leaf samples were collected (from both Sylhet and
Moulvibazar districts, Bangladesh). The soil samples
(sandy clay loam) were collected (500 g each time) close
(1–10 cm perimeter) to the tea plant by digging into the
soil (1–5 cm depth). Some of the tea gardens were located
near a highway (the closest was within 100 meters), and
others were situated very far from the highway.
The collected samples were stored in clean, sterile
polyethylene bags and were properly labeled. They were
immediately sent to the laboratory of the Agrochemical and Environmental Research Division, Bangladesh
Atomic Energy Commission, Dhaka, and were stored at
−20 °C to reduce the risk of hydrolysis or oxidation prior
to analysis.
Digestion of samples
Digestion of tea samples
Before sample digestion, the tea leaves were freeze-dried
at −50 °C at 100 Pa for 24 h. They were then crushed
using a sterile mortar and pestle and sieved (particle size
<100 µm) at room temperature. Finally, 1 g of tea leaves
was used for digestion (refer to the six digestion methods
described below).
Digestion of soil samples
Soil samples were oven dried at 60 °C for 24 h before
being ground into a fine powder using a sterile mortar
and pestle. The samples (2.5 g) were transferred into a
crucible before being mixed with 10 mL of aqua regia,
which consisted of HCl:HNO3 (3:1). The mixture was the
digested on a hot plate at 95 °C for 1 h and was allowed to
cool to room temperature. The sample was then diluted
to 50 mL using deionized distilled water and was left
to settle overnight [26]. The supernatant was filtered
through Whatman No. 42 filter paper and (<0.45 µm)
Millipore filter paper, (Merck Millipore, Darmstadt,
Germany) prior to analysis by graphite furnace atomic
absorption spectrometry (GF-AAS).
Method 1 (HNO3 digestion)
Based on the method previously described by Huang
et al. [27] and Narin et al. [28], the sample (1 g) was
placed in a 50 mL crucible before the addition of 10 mL
of concentrated HNO3. The sample was heated on a hot
Page 4 of 13
plate until the solution became semi-dry. This was followed by the addition of 10 mL of concentrated HNO3.
The solution was kept on a hot plate for 1 h to allow the
formation of a clear suspension. After the sample was
semi-dried, it was cooled and filtered through Whatman
No. 42 filter paper. It was then transferred to a 50 mL volumetric flask by adding deionized distilled water to the
mark [27, 29] before GF-AAS analysis.
Method 2 (HNO3 overnight digestion)
Concentrated HNO3 (10 mL) was added to the sample
(1 g) and allowed to stand overnight at room temperature. The sample was then heated on a hot plate until the
solution became clear and semi-dried. The solution was
then cooled and filtered through Whatman No. 42 filter
paper. It was then transferred quantitatively to a 50 mL
volumetric flask by adding deionized distilled water [30].
Finally, the solution was analyzed using GF-AAS.
Method 3 (HNO3–H2O2 digestion)
In this method, the sample (1 g) was weighed into a
50 mL crucible and treated with 10 mL of concentrated HNO3. The solution was placed on a hot plate for
30–45 min to allow for oxidation. After cooling, 4 mL of
H2O2 (20 %) was added, and the solution was reheated on
a hot plate until the digest became clear and semi-dried.
After cooling, the suspension was filtered into a 50 mL
volumetric flask and diluted with deionized distilled
water to the mark [30] before GF-AAS analysis.
Method 4 (HNO3–HClO4 digestion)
Approximately 1 g of sample was placed in a 50 mL crucible before the addition of 10 mL of concentrated HNO3.
The mixture was placed on a hot plate for 30–45 min to
allow for oxidation. After cooling, 5 mL of HClO4 (70 %)
was added, and the mixture was reheated on a hot plate
until the digest became clear and semi-dried. Then, the
sample was cooled and filtered through Whatman No.
42 filter paper before being quantitatively transferred to
a 50 mL volumetric flask by adding deionized distilled
water [29, 30]. Finally, the solution was analyzed using
GF-AAS.
Method 5 (H2SO4 digestion)
The sample (1 g) was placed in a 50 mL crucible followed by the addition of 7 mL of concentrated H2SO4.
The mixture was allowed to stand for 30 min at room
temperature. Approximately 7 mL of H2O2 (30 %) was
added to the crucible, and the sample was reheated on
the hot plate for 40 min. Thereafter, 1 mL of H2O2 (30 %)
was added until the digest appeared clear upon cooling.
Then, deionized distilled water was added to bring the
final sample volume to 50 mL. The solution was filtered
Rashid et al. Chemistry Central Journal (2016) 10:7
Page 5 of 13
through Whatman No. 42 filter paper [29] and then analyzed using GF-AAS.
elements are given in Tables 1, 2 and each analysis was
performed in triplicate.
Method 6 (dry ashing)
Calibration curves
Initially, 1 g of sample was placed in a crucible on a hot
plate at 100–150 °C for 1 h. It was transferred to a muffle
furnace set at 480 °C. After 4 h, the sample was removed
from the furnace and cooled. Then, 2 mL of 5 M HNO3
was added, and the sample was evaporated to dryness
on a hot plate. The sample was placed in a cool furnace
and reheated to 400 °C for 15 min before being removed,
cooled and moistened with four drops of deionized distilled water. Then, 2 mL of concentrated HCl was added,
and the sample was evaporated to dryness before the
addition of 2M HCl (2 mL). The solution was filtered
through Whatman No. 42 filter paper and <0.45 µm Millipore filter paper and then quantitatively transferred to
a 25 mL volumetric flask by adding deionized distilled
water [29, 30].
Calibration curves for Cd, Cr, Pb, As and Se were prepared at seven different concentrations (0.0, 0.1, 1.0, 5.0,
10.0, 20.0 and 40.0 µg/L).
GF‑AAS analysis
An atomic absorption spectrophotometer (model
AA-6300, Shimadzu, Kyoto, Japan) equipped with a Shimadzu model GFA-EX7i graphite furnace atomizer was
used to determine the heavy metals. Pyrolytic graphite
tube was used for detection of As, Cr and Se while in
case of Pb and Cd, high-density graphite tube was used.
The absorption wavelength for the determination of each
heavy metal type and other operating parameters and
temperature programming of GF-AAS for the working
Recovery analysis
To calculate the percent recovery, the samples were spiked
with known amounts of the analytical standards of Cd, Cr,
Pb, As and Se. The mean percent recoveries for the various metals were calculated using the following equation:
Percent recovery = (CE/CM) × 100
where CE is the experimental concentration determined from the calibration curve, and CM is the spiked
concentration.
Determination of the transfer factor (TF)
The transfer factor or transfer coefficient was calculated
by dividing the concentration of the heavy metal in present in the tea by that of the total heavy metal concentration in the soil [31]:
TF = Concentration in tea leaves/Concentration in soil.
Results and discussion
Heavy metal contents in fresh tea leaves
Analysis of heavy metals such as As, Cr, Cd, Pb and Se
in fresh tea leaves is important because they are toxic
Table 1 Operating parameters for the GF-AAS analysis of heavy metals
Elements
Wavelength (nm)
Detection limit (µg/g)
Slit width (nm)
Lamp current (mA)
Gas flow (L/min)
Cd
228.8
0.00005
0.7
8
1
Cr
357.9
0.00002
0.7
10
1
Pb
283.3
0.00005
0.7
10
1
As
193.7
0.00010
0.7
12
1
Se
196.0
0.00005
0.7
23
1
Table 2 Temperature programming of GF-AAS for the analysis of Cd, Cr, Pb, As and Se in tea leaves and soil samples
Stages
Cd temperature °C,
hold time (s)
Cr temperature °C,
hold time (s)
Pb temperature °C,
hold time (s)
As temperature °C,
hold time (s)
Se temperature °C,
hold time (s)
Stage-1
150, 20
150, 20
150, 20
150, 20
150, 20
Stage-2
250, 10
250, 10
250, 10
250, 10
250, 10
Stage-3
500, 10
800, 10
800, 10
600, 10
600, 10
Stage-4
500, 10
800, 10
800, 10
600, 10
600, 10
Stage-5
500, 3
800, 3
800, 3
600, 3
600, 3
Stage-6
2200, 2
2300, 2
2400, 2
2200, 2
2200, 2
Stage-7
2400, 2
2500, 2
2500, 2
2500, 2
2400, 2
Rashid et al. Chemistry Central Journal (2016) 10:7
Page 6 of 13
and can be transported into humans and animals via the
food chain. The concentration ranges of Cd, Pb, As and
Se in fresh tea leaves were (0.03–0.13), (0.05–1.14), (BDL
to 2.06) and (0.47–1.31 µg/g), respectively (Table 3).
Several studies have previously reported on the presence of trace elements in tea leaves and soil of tea gardens in Bangladesh [32–35]. The mean Cd concentration
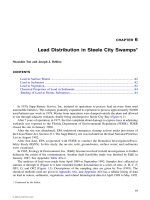
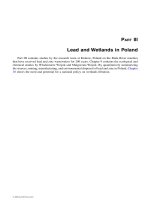
in fresh tea leaves was 0.09 ± 0.03 µg/g (Fig. 3), which
was lower than the World Health Organization (WHO)
recommended limit of 0.10 µg/g [36]. The Cd concentration was also lower than that reported for fresh tea leaves
from India (0.43 ± 0.01 µg/g), China (0.77 ± 0.02 µg/g),
Japan (0.15 ± 0.01 µg/g), and Italy (0.09 ± 0.01 µg/g) [37]
(Table 4). Moreover, our result was also lower than Cd
content of tea samples from Turkey (0.50 ± 0.10 µg/g)
[28]. The variations in heavy metal contents of different
samples may be due to differences in geographical location, environmental conditions, seasonal changes, physiochemical characteristics of the growing regions and
matrix-to-matrix transfer.
In comparison, the levels of Cr were low (below the
detection limit) (Fig. 4), indicating that these fresh tea
leaves were free from Cr contamination. The WHO-recommended limit for Cr is 0.05 µg/mL [36], and contamination by this heavy metal has been reported in Japanese,
Chinese, Iranian and Thai green teas at 0.024, 0.14, 0.05
and 0.06 µg/g, respectively [38, 39]. Cr has been reported
to cause cancer in humans, especially bronchial and lung
cancers [40].
The mean Pb concentration in all of the fresh tea
leaves investigated was 0.27 ± 0.35 µg/g (Fig. 3), which
is lower than the WHO-recommended limit of 0.30 µg/g
[36]. This is also lower than the Pb content of tea leaves
from Turkey (17.90 ± 7.10 µg/g) [22] as well as tea leaves
from India (1.86 ± 0.04 µg/g), China (1.49 ± 0.03 µg/g)
and Japan (1.55 ± 0.03 µg/g), but is slightly higher than
that from Italy (0.23 ± 0.01 µg/g) [37]. Pb is a cumulative
toxin that can primarily affect the blood, nervous system
and kidneys. If present in high concentrations, Pb inhibits red blood cell formation, which can result in anemia
[36].
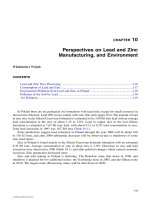
The mean As concentration in fresh tea leaves was
1.21 ± 0.74 µg/g (Fig. 4), which is higher than the
WHO-recommended limit (0.10 µg/g) [36] and higher
than that of green tea from China (0.28 µg/g) [41],
Thailand (0.013 µg/g) [38], Canada (0.04 µg/g) [42]
and Japan (0.00 µg/g). A potential source of As is the
high amount of As present in the soils of the studied
tea plantations. As is toxic to humans, especially in its
methylated forms produced by glutathione s-transferase (GST), As III methyltransferase (AS3MT) and
S-adenosyl methionine (SAM). These enzymes can
compete with DNA methyltransferase (DNMT) for
DNA methylation, hence indirectly inhibiting DNA
methyltransferase and inducing the reactivation of
silenced tumor suppressor genes (Mishra et al. 2009).
Chronic toxicity from high exposure to inorganic As is
associated with arsenicosis, melanosis, keratoses of the
skin and cancer [36].
The Se content of all investigated fresh tea leaves was
0.64 ± 0.50 µg/g (Fig. 4), and the WHO-recommended
limit and contents of Japanese sencha green tea, Japanese jasmine tea, Chinese pai mu tan tea and Chinese gunpowder tea were 0.125, 0.092, 0.089, 0.075 and
0.070 µg/g, respectively [39]. Se can lead to selenosis if
taken in doses exceeding 400 µg per day [43]. Symptoms
Table 3 Heavy metal contents in fresh tea leaves (FTL)
Sample ID
Mean ± SD (µg/g)
Cd
Pb
As
Se
FTL-1
0.07 ± 0.0001
0.05 ± 0.0005
1.84 ± 0.0001
BDL
FTL-2
0.03 ± 0.0008
0.31 ± 0.0001
1.66 ± 0.0062
0.90 ± 0.0024
FTL-3
0.08 ± 0.0064
0.40 ± 0.0003
BDL
BDL
FTL-4
0.13 ± 0.0038
1.14 ± 0.0005
2.06 ± 0.0056
1.28 ± 0.0004
FTL-5
0.07 ± 0.0040
0.05 ± 0.0003
1.17 ± 0.0013
0.78 ± 0.0015
FTL-6
0.09 ± 0.0015
0.09 ± 0.0001
1.45 ± 0.0054
1.31 ± 0.0098
FTL-7
0.11 ± 0.0056
0.22 ± 0.0006
1.48 ± 0.0237
BDL
FTL-8
0.06 ± 0.0025
0.46 ± 0.0004
1.81 ± 0.0064
0.47 ± 0.0004
FTL-9
0.13 ± 0.0041
BDL
0.44 ± 0.0022
0.77 ± 0.0002
FTL-10
0.12 ± 0.0036
BDL
0.19 ± 0.0001
0.85 ± 0.0075
Mean
0.089
0.272
1.210
0.636
The limit of detection were 0.0052, 0.0026, 0.0046, 0.01 and 0.0084 µg/g for Cd, Cr, Pb, As and Se, respectively. The data (µg/g) shown in Table is reported on dry
weight basis
n = 3 (n no. of analyses), SD standard deviation, BDL below detection limit
Rashid et al. Chemistry Central Journal (2016) 10:7
Page 7 of 13
Fig. 3 Comparison of the Cd (a), Cr (b) and Pb (c) content of fresh tea leaves, black tea and soil from tea plantations
of selenosis include a garlic odor of the breath, gastrointestinal disorders, hair loss, sloughing of nails, fatigue,
irritability and neurological damage. Extreme cases of
selenosis can result in cirrhosis of the liver, pulmonary
edema and death [43].
Heavy metal contents in black tea
In the present study, heavy metal contents were also
analyzed in the black tea produced from Bangladesh.
The concentration ranges of Cd, Cr, Pb, As and Se were
0.04–0.16, 0.45–10.73, 0.07–1.03, 0.89–1.90 and 0.76–
10.79 µg/g, respectively using HNO3 overnight digestion
procedure (Table 5).
The mean concentration of Cd in black tea
(0.08 ± 0.04 µg/g) (Fig. 3) was lower than the World
Health Organization (WHO)-recommended limit of
0.10 µg/g [36], but higher than that reported in black tea
from Canada (0.026 µg/g) [42], Thailand (0.0071 µg/g)
[41] and Turkey (0.0100 µg/g) [44]. However, its level
was lower than that reported in India (0.8900 µg/g) [3],
Nigeria (0.1200 µg/g) and Saudi Arabia (0.9890 µg/g)
[41]. Moreover, our result was also lower than Cd content of black teas from Turkey (2.30 ± 0.40 µg/g) [22]. In
a previous study, the concentration of Cd was 0.03 µg/g
[34] which is slightly lower than that of our findings. In
another study, the presence of some trace elements (Cu,
Rashid et al. Chemistry Central Journal (2016) 10:7
Page 8 of 13
Table 4 Level of Cd, Pb, As and Se (µg/g) in tea leaves from various countries
Country
Cd
Cr
Pb
As
Se
Bangladesh
0.02 [34]
32.87 [34]
0.34 [34]
NA
ND [34]
India
0.43 [37]
0.59–0.77 [50]
0.01–0.03
[51]
0.09–0.37 [39]
1.28–1.84 [50]
0.43–1.14 [51]
1.86 [37]
0.98–1.83 [50]
0.10–0.51
[51]
NA
0.05–0.07 [39]
2.12–2.47 [51]
China
0.77 [37]
0.043 [52]
0.04–0.08
[51]
0.07–0.37 [39]
1.23–2.20 [51]
1.49 [37]
0.86 [52]
0.60–1.08 [51]
0.28 [41]
0.05–0.09 [39]
2.55–3.97 [51]
Japan
0.15 [37]
0.11–0.24 [39]
1.55 [37]
NA
0.05–0.09 [39]
Italy
0.09–0.17
[37]
0.04 [51]
1.31 [51]
0.19–0.52
[37]
0.55 [51]
NA
2.65 [51]
Turkey
0.7–0.9
[22, 28]
3.1–3.5
[22, 28]
3.1–3.7
[22, 28]
NA
Thailand
0.001–0.086
[38]
0.040–3.294
[38]
0.108–22.245
[38]
0.013
[38]
0.010–0.238
[53]
Sri Lanka
0.03–0.24
0.05–0.11 [39]
0.59 [34]
Iran
0.76 [50]
134.5 [54]
0.89–1.79 [50]
8.2 [54]
0.92–2.92 [50]
209.5 [54]
0.00–0.01 [38]
0.014–0.508 [53]
0.05–0.09 [39]
ND [34]
0.28–0.56 [41]
NA not available data, ND not detected
Fig. 4 Comparison of the As (a) and Se (b) content in fresh tea leaves, black tea and soil from tea plantations
NA
Rashid et al. Chemistry Central Journal (2016) 10:7
Page 9 of 13
Table 5 Heavy metal contents in processed tea leaves (PTL, black tea)
Sample ID
Mean ± SD (µg/g)
Cd
Cr
Pb
As
Se
PTL-1
0.16 ± 0.0013
9.31 ± 0.0493
0.27 ± 0.0008
1.90 ± 0.0006
PTL-2
0.10 ± 0.0031
7.03 ± 0.0156
0.70 ± 0.0004
BDL
1.44 ± 0.0038
BDL
PTL-3
0.12 ± 0.0023
10.73 ± 0.0348
0.40 ± 0.0009
1.17 ± 0.0153
0.80 ± 0.0002
0.76 ± 0.0023
PTL-4
0.04 ± 0.0030
2.10 ± 0.0004
0.07 ± 0.0021
1.40 ± 0.0036
PTL-5
0.06 ± 0.0031
1.71 ± 0.0032
0.31 ± 0.0008
0.89 ± 0.0017
PTL-6
0.11 ± 0.0030
0.45 ± 0.0026
0.22 ± 0.0006
1.78 ± 0.0066
10.79 ± 0.0065
0.44 ± 0.0003
BDL
PTL-7
0.05 ± 0.0001
2.75 ± 0.0086
0.66 ± 0.0002
1.02 ± 0.0030
PTL-8
0.07 ± 0.0004
1.19 ± 0.0084
1.03 ± 0.0011
1.16 ± 0.0006
BDL
PTL-9
0.05 ± 0.0035
BDL
0.72 ± 0.0006
1.00 ± 0.0060
1.89 ± 0.0101
PTL-10
0.07 ± 0.0020
0.54 ± 0.0049
BDL
1.30 ± 0.0004
0.21 ± 0.0016
Mean
0.083
3.581
0.438
1.162
1.633
The limit of detection were 0.0045, 0.003, 0.0028, 0.0032 and 0.0064 µg/g for Cd, Cr, Pb, As and Se, respectively. The data (µg/g) shown in Table is reported on dry
weight basis
n = 3 (n no. of analyses), SD standard deviation, BDL below detection limit
Ni, Mn and Zn) in three commercially available tea from
Bangladesh were analyzed [32]. Nevertheless, they were
different from that of the current investigation.
Cr was detected in rather high amounts in black
tea (3.581 ± 3.941 µg/g), but it was not detected in
fresh tea leaves or tea plantation soils (Fig. 3). Its level
is higher than the recommended limit for Cr by the
WHO of 0.05 µg/mL [36]. Moreover, Cr concentrations
in black tea from India, China, Sri Lanka and Turkey
were reported at 0.371, 0.155, 0.050 and 3.000 µg/g [39,
44], respectively. It is plausible that Cr contamination
occurred during the fermentation process, which is one
of the important processing steps of black tea in Bangladesh. In particular, it may occur during the CTC rolling
steps involved in the production of black tea. However,
this finding is lower than the previously reported Cr concentration (32.87 µg/g) in some tea samples from Bangladesh [34] which may be contributed to the different types
of tea samples used as well as variance in the type of soil
in the tea garden.
The Pb concentration in black tea was
0.438 ± 0.328 µg/g (Fig. 3), which is higher than the
WHO recommended limit of 0.30 µg/g [36]. Moreover,
our findings are also similar to the previously reported
concentration of Pb (0.34 µg/g) [34] in tea samples
from Bangladesh but is higher than those reported for
Nigeria (0.330 µg/g) [6], Egypt (0.395 µg/g) and Thailand (0.0237 µg/g) [41], but lower than that in Turkey (2.500 µg/g) [44], Iran (2.915 µg/g), Saudi Arabia
(1.250 µg/g), China (3.270 µg/g), Pakistan (2.500 µg/g)
and India (0.810 µg/g) [41].
The mean As concentration in black tea was
1.162 ± 0.524 µg/g (Fig. 4, which was higher than the
WHO-recommended limit (0.10 µg/g) [36], as well
as higher than in Thailand (0.00084 µg/g) and China
(0.280 µg/g) [41]. However, it was lower than that reported
in Nigeria (2.220 µg/g) [6]. The Se content in black tea
from Bangladesh was higher (1.633 ± 3.280 µg/g) (Fig. 4)
than that reported in black tea from Nigeria [6], India,
China and Sri Lanka [39], which were 0.520, 0.070, 0.087
and 0.050 µg/g, respectively.
Heavy metal contents in soils from tea plantations
In this part of the study, the heavy metal contents in
the soils from tea plantations in Bangladesh have been
reported. This analysis is important because of the metals’ potential toxicity and transportation through the root
system into the buds and tea leaves. The concentration
ranges of Cd, Pb, As and Se in tea plantation soils were
0.11–0.45, 2.80–66.54, 0.78–4.49 and 0.03–0.99 µg/g,
respectively (Table 6).
Similar to the findings for fresh tea leaves, Cr was not
detected in the tea garden soil samples (Fig. 4). However,
Cr has been reported in agricultural soils in the United
States (48.5 µg/g) [45], India (1.23 µg/g) [46] and Kunshan, China (87.73 µg/g) [47]. Low concentrations of Cd
(mean 0.222 ± 0.103 µg/g) were observed in all investigated soils from the tea plantations samples (Fig. 3).
These levels were lower than that previously reported in
U.S. agricultural soils (13.5 µg/g) [45], but higher than
in Indian agricultural soils (0.05 µg/g) [46] and soil from
Kunshan in China (0.20 µg/g) [47].
Because of the toxicological importance of Pb,
many studies have investigated the levels of this element in soil from several countries. Among all of the
soil samples investigated, STP-1 had the highest Pb
Rashid et al. Chemistry Central Journal (2016) 10:7
Page 10 of 13
Table 6 Heavy metal contents in soils from tea plantations (STP)
Sample ID
Mean ± SD (µg/g)
Cd
Cr
Pb
As
Se
STP-1
0.16 ± 0.0013
BDL
66.54 ± 0.5200
BDL
BDL
STP-2
0.15 ± 0.0042
BDL
10.65 ± 0.0120
2.75 ± 0.0013
BDL
STP-3
0.34 ± 0.0019
BDL
63.63 ± 4.2400
1.13 ± 0.0041
BDL
STP-4
0.24 ± 0.0016
BDL
8.65 ± 0.0420
4.49 ± 0.0128
BDL
STP-5
0.22 ± 0.0021
BDL
11.86 ± 0.0660
1.79 ± 0.0017
BDL
STP-6
0.45 ± 0.0015
BDL
6.90 ± 0.2000
2.32 ± 0.0022
BDL
STP-7
0.16 ± 0.0038
BDL
2.80 ± 0.0100
1.08 ± 0.0117
0.03 ± 0.0003
STP-8
0.23 ± 0.0015
BDL
9.48 ± 0.0260
3.03 ± 0.0004
BDL
STP-9
0.16 ± 0.0011
BDL
3.60 ± 0.0350
BDL
0.99 ± 0.0000
STP-10
0.11 ± 0.0059
BDL
10.22 ± 0.4400
0.78 ± 0.0157
0.81 ± 0.0032
Mean
0.222
–
19.433
1.737
0.183
The limit of detection were 0.036, 0.0018, 0.0093, 0.0051 and 0.0012 µg/g for Cd, Cr, Pb, As and Se, respectively. The data (µg/g) shown in Table is reported on dry
weight basis
n = 3 (n no. of analyses), SD standard deviation, BDL below detection limit
concentration (66.54 ± 0.520 µg/g) potentially because
of its location, which was adjacent to a highway. Overall,
the mean level of Pb in the tea plantation soil samples
was 19.43 ± 24.25 µg/g (Fig. 3). This is higher than that
reported for agricultural soils in India (2.82 µg/g) [46] but
lower than agricultural soils in the U.S. (55.00 µg/g) [45]
and Kunshan, China (30.48 µg/g) [47].
The concentrations of As ranged from 0.78 to 4.49 µg/g.
The highest As level was 4.49 µg/g in STG-4, but As was
not detected in STP-1 or STP-9. The mean concentration of As was 1.74 ± 1.429 µg/g (Fig. 4), which is lower
than that reported in Kunshan, China (8.15 µg/g) [47].
Among all of the investigated soil samples, the mean Se
concentrations in STP-1, STP-2, STP-3, STP-4, STP-5,
STP-6 and STP-8 were below the detection limit. Low
Se contents (mean 0.18 ± 0.398 µg/g) (Fig. 4) have also
been reported in soils from garlic (0.026 µg/g), radish (0.028 µg/g), carrot (0.011 µg/g) and orchard grass
(0.069 µg/g) plantations [48]. In comparison, higher
Se concentrations were detected in the soils of oilseed
rape (0.316 µg/g), white clover (0.211 µg/g), red clover
(0.223 µg/g) and English plantain (0.277 µg/g) plantations
[48]. These higher Se concentrations may be attributed
to fertilizer (sodium selenite) use in tea plantations. High
levels of heavy metals such as Se and As can potentially
be easily transported to the tea leaves through the roots
of the plant from contaminated soils. In addition, the
acidic nature of tea garden soils can increase the extraction of As and hence the detected As concentration.
FTL-9
0.8125
0.0000
0.0000
0.7778
FTL-10
1.0909
0.0000
0.2436
1.0494
Mean
0.4784
0.0312
0.4552
0.1827
Heavy metal transfer from soils to tea leaves in Bangladesh
Method validation
Soil-to-plant transfer is one of the key components of
human exposure to metals through the food chain. The
Table 7 Transfer factors of heavy metals from tea plantation soils of tea leaves
Sample ID
Cd
Pb
FTL-1
0.4375
0.0008
FTL-2
0.2000
0.0291
FTL-3
0.2353
0.0062
FTL-4
0.5417
0.1318
As
–
0.6036
–
0.4588
Se
–
–
–
–
FTL-5
0.3182
0.0042
0.6536
–
FTL-6
0.2000
0.0130
0.6250
–
FTL-7
0.6875
0.0786
1.3704
–
FTL-8
0.2609
0.0485
0.5974
–
transfer factor (TF) describes the transfer of heavy metals
from soils to the plant body. In the present study, the TFs
for Cd, Pb, As and Se were 0.47845, 0.03122, 0.45524 and
0.18272, respectively (Table 7). The transfer factors for
heavy metals in the investigated tea samples decreased as
follows: Cd > As > Se > Pb. In general, the TFs increased
with decreasing metal concentrations in soils. Thereby,
lower TFs in tea plants could be explained by uptake saturation [49]. In another study, the TFs of lettuce, spinach,
radish and carrot followed a trend of Mn > Zn > Cd > Pb
(Intawongse and Dean, 2006). To our knowledge, our
study is the first to report TFs in tea.
The analytical results for the recovery of spiked metals in tea using the six digestion methods and LODs for
Rashid et al. Chemistry Central Journal (2016) 10:7
Page 11 of 13
Table 8 Recovery analysis (n = 2) of heavy metals and LODs of investigated methods for method validation
Method
Percentage, LOD (µg/g)
Cd
Cr
Pb
As
Se
Method 1 (HNO3)
96.80, 0.0076
95.20, 0.094
70.70, 0.012
80.00, 0.152
72.50, 0.0049
Method 2 (HNO3 overnight)
99.50, 0.0052
97.30, 0.0026
100.00, 0.0047
89.30, 0.014
100.03, 0.0084
Method 3 (HNO3 and
H2O2)
94.80, 0.016
74.90, 0.062
75.80, 0.186
95.60, 0.021
72.00, 0.0124
86.10, 0.0325
Method 4 (HNO3 –HClO4) 76.20, 0.002
93.50, 0.068
74.90, 0.0052
90.20, 0.065
Method 5 (H2SO4)
80.60, 0.018
56.00, 0.128
65.00, 0.194
58.80, 0.176
71.20, 0.0982
Method 6 (Dry ashing)
113.60, 0.0142
87.40, 0.0014
84.70, 0.024
93.20, 0.052
60.20, 0.0018
The uncertainty of results was less than 1 %. The data (µg/g) shown in Table is reported on dry weight basis
each method are presented in Table 8. Method 2 (overnight digestion with HNO3) was the most efficient for
recovering Cd, Cr, Pb, As and Se with mean percent
recoveries of 99.50, 97.30, 100.00, 89.30 and 100.03 %,
respectively. For this reason, all tea samples were subsequently digested using this method, which is recommended as the best method for the destruction of tea.
The method likely provided sufficient time for HNO3
to digest the tea matrix. On the other hand, Method 5
(H2SO4) yielded the lowest recoveries, possibly due to
the incomplete digestion of tea samples or losses of elements through volatilization. Recoveries of Cd, Cr, Pb,
As and Se were 80.60, 56.00, 65.00, 58.80 and 71.20 %,
respectively, all of which were below the acceptable
limits (75–125 %), except for Cd (80.60 %). Thus, the
digestion method using H2SO4 is not recommended
for tea samples. However, in a previous study, tea samples digested with three different acids at similar ratio
[HNO3/H2SO4/H2O2(2: 2: 2)] showed shorter digestion
time with better recovery and precision than other acid
mixtures [28].
Method 1 (destruction with HNO3) and Method
3 (digestion using HNO3 and H2O2) yielded acceptable recoveries of Cd, Cr, Pb, As and Se. However, only
70.70 % of Pb was recovered by Method 1, which is
below the acceptable limit. Therefore, Methods 1 and 3
could also be used as relatively inexpensive, simple and
rapid substitutes. Method 6 (Dry ashing) is not recommended because of the high cost incurred due to the
requirement of a muffle furnace. Method 4 (HNO3–
HClO4 procedure) is also not recommended because
HClO4 is potentially hazardous during digestion. This
method also yielded poor recoveries. For all procedures,
recovery of Cd was significantly higher, while recovery of Pb was relatively lower. The likely reason for the
lower recovery of Pb is the effect of the acidic pH used
during sample digestion, which does not favor sample
extraction.
Conclusions
Six digestion methods followed by GF-AAS have been
successfully optimized in the present study. An overnight
digestion with nitric acid (method no. 2) offered adequate
time to digest the tea matrix and was the most efficient
method for recovering Cd, Cr, Pb, As and Se. Moreover,
Methods 1 and 3 were also satisfactory, relatively cheap,
simple and fast. Method no. 5 is not recommended for the
digestion of tea samples while method no. 6 was expensive. Cd, Pb, As and Se were detected in fresh tea leaves,
but Cr was not detected. The concentrations of As were
high in both fresh and black tea, while the concentration
of Pb and Cr in black tea was higher than the recommended level set by the WHO. The soil from tea plantations was contaminated with As and Se, levels of which
were at times higher than the WHO recommendation.
High levels of heavy metals can easily be transported to
tea leaves through the roots of tea plants. However, Cr was
not detected in the soil samples. The trend in heavy metal
TFs in the investigated tea samples was Cd > As > Se > Pb.
An overnight digestion with HNO3 was the most efficient
digestion method for recovering heavy metals.
Authors’ contributions
HR and ZF conducted the experiments, analyzed the data, and wrote the
manuscript. AZC, KA and LB designed the experiments and supervised the
work. MM analyzed the data and wrote the manuscript while SHG critically
revised the manuscript. All authors read and approved the final manuscript.
Author details
1
Agrochemical and Environmental Research Division, Institute of Food
and Radiation Biology, Bangladesh Atomic Energy Research Establishment,
Savar, Dhaka 1349, Bangladesh. 2 Food Analysis and Research Laboratory,
Center for Advanced Research in Sciences, University of Dhaka, Dhaka, Bangladesh. 3 Department of Pharmacology, School of Medical Sciences, Universiti
Sains Malaysia, Kubang Kerian, 16150 Kota Bharu, Kelantan, Malaysia. 4 Human
Genome Centre, School of Medical Sciences, Universiti Sains Malaysia, Kubang
Kerian, 16150 Kota Bharu, Kelantan, Malaysia.
Acknowledgements
The authors would like to acknowledge IAEA for financial assistance under
IAEA Research Contact no. 15052/R2 and Universiti Sains Malaysia Research
University Team (RUT) Grant (1001/PPSP/853005). We would also like to thank
Rashid et al. Chemistry Central Journal (2016) 10:7
Page 12 of 13
Bangladesh Atomic Energy Commission for providing laboratory facilities to
carry out the study and Abdullah-Al-Masud Mazumder, Botanist of Bangladesh
Forest Research Institute, for authenticating the tea leaf samples.
Competing interests
The authors declare that they have no competing interests.
19.
Received: 27 August 2015 Accepted: 5 February 2016
20.
References
1. Karak T, Bhagat R (2010) Trace elements in tea leaves, made tea and tea
infusion: a review. Food Res Int 43(9):2234–2252
2. Li X, Zhang Z, Li P, Zhang Q, Zhang W, Ding X (2013) Determination
for major chemical contaminants in tea (Camellia sinensis) matrices: a
review. Food Res Int 53(2):649–658
3. Srividhya B, Subramanian R, Raj V (2011) Determination of lead, manganese, copper, zinc, cadmium, nickel and chromium in tea leaves. Int J
Pharm Pharm Sci 13:257–258
4. Issabeagloo E, Ahmadpoor F, Kermanizadeh P, Taghizadieh M (2012)
Hepatoprotective effect of green tea on hepatic injury due to leflunomide in rat. Asian J Exp Biol Sci 3:136–141
5. Dufresne C, Farnworth E (2000) Tea, Kombucha, and health: a review.
Food Res Int 33(6):409–421
6. Achudume AC, Owoeye D (2010) Quantitative assessment of heavy metals in some tea marketed in Nigeria-Bioaccumulation of heavy metals in
tea. Health 2(09):1097–1100
7. Sharma RK, Agrawal M, Marshall F (2007) Heavy metal contamination
of soil and vegetables in suburban areas of Varanasi, India. Ecotoxicol
Environ Saf 66(2):258–266
8. Nasir T, Shamsuddoha M (2012) Tea production, consumption and
exports in global and Bangladeshi perspective. USV Ann Econ Public
Adm 11(2):74–80
9. Bower JJ, Leonard SS, Shi X (2005) Conference overview: molecular
mechanisms of metal toxicity and carcinogenesis. Mol Cell Biochem
279(1–2):3–15
10. Järup L (2003) Hazards of heavy metal contamination. Br Med Bull
68(1):167–182
11. Welna M, Szymczycha-Madeja A, Pohl P: Quality of the trace element
analysis: sample preparation steps: INTECH Open Access Publisher; 2011
12. Salarian M, Ghanbarpour A, Behbahani M, Bagheri S, Bagheri A (2014) A
metal-organic framework sustained by a nanosized Ag12 cuboctahedral
node for solid-phase extraction of ultra traces of lead (II) ions. Microchim
Acta 181(9–10):999–1007
13. Behbahani M, Akbari AA, Amini MM, Bagheri A (2014) Synthesis and
characterization of pyridine-functionalized magnetic mesoporous silica
and its application for preconcentration and trace detection of lead and
copper ions in fuel products. Anal Methods 6(21):8785–8792
14. Behbahani M, Abandansari HS, Salarian M, Babapour M, Bagheri A, Nabid
MR (2014) Synthesis and application of a thermosensitive tri-block copolymer as an efficient sample treatment technique for preconcentration
and ultra-trace detection of lead ions. Microchim Acta 181(1–2):129–137
15. Nabid MR, Sedghi R, Behbahani M, Arvan B, Heravi MM, Oskooie HA
(2014) Application of Poly 1, 8-diaminonaphthalene/multiwalled carbon
nanotubes-COOH hybrid material as an efficient sorbent for trace determination of cadmium and lead ions in water samples. J Mol Recognit
27(7):421–428
16. Fouladian HR, Behbahani M (2014) Solid phase extraction of Pb(II) and Cd
(II) in food, soil, and water samples based on 1-(2-pyridylazo)-2-naphtholfunctionalized organic–inorganic mesoporous material with the aid of
experimental design methodology. Food Anal Methods 8(4):982–993
17. Ebrahimzadeh H, Behbahani M (2013) A novel lead imprinted polymer
as the selective solid phase for extraction and trace detection of lead
ions by flame atomic absorption spectrophotometry: synthesis, characterization and analytical application. Arabian J Chem. doi:10.1016/j.
arabjc.2013.09.017
18. Behbahani M, Hassanlou PG, Amini MM, Omidi F, Esrafili A, Farzadkia M,
Bagheri A (2015) Application of solvent-assisted dispersive solid phase
21.
22.
23.
24.
25.
26.
27.
28.
29.
30.
31.
32.
33.
34.
35.
36.
37.
38.
39.
40.
extraction as a new, fast, simple and reliable preconcentration and trace
detection of lead and cadmium ions in fruit and water samples. Food
Chem 187:82–88
Ghorbani-Kalhor E, Behbahani M, Abolhasani J, Khanmiri RH (2014) Synthesis and characterization of modified multiwall carbon nanotubes with
poly (N-phenylethanolamine) and their application for removal and trace
detection of lead ions in food and environmental samples. Food Anal
Methods 8(5):1326–1334
Behbahani M, Abolhasani J, Amini MM, Sadeghi O, Omidi F, Bagheri A,
Salarian M (2015) Application of mercapto ordered carbohydrate-derived
porous carbons for trace detection of cadmium and copper ions in
agricultural products. Food Chem 173:1207–1212
Soylak M, Tuzen M, Souza AS (2007) Korn MdGA, Ferreira SLC: optimization of microwave assisted digestion procedure for the determination of
zinc, copper and nickel in tea samples employing flame atomic absorption spectrometry. J Hazard Mater 149(2):264–268
Narin I, Colak H, Turkoglu O, Soylak M, Dogan M (2004) Heavy metals
in black tea samples produced in Turkey. Bull Environ Contam Toxicol
72(4):844–849
Szymczycha-Madeja A, Welna M, Pohl P (2015) Determination of essential
and non-essential elements in green and black teas by FAAS and ICP OES
simplified–multivariate classification of different tea products. Microchem
J 121:122–129
Sneddon J, Hardaway C, Bobbadi KK, Reddy AK (2006) Sample preparation of solid samples for metal determination by atomic spectroscopy-An
overview and selected recent applications. Appl Spectrosc Rev 41(1):1–14
Welna M, Szymczycha-Madeja A, Pohl P (2013) A comparison of samples
preparation strategies in the multi-elemental analysis of tea by spectrometric methods. Food Res Int 53(2):922–930
Mwegoha W, Kihampa C (2010) Heavy metal contamination in agricultural soils and water in Dar es Salaam city, Tanzania. African Journal of
Environmental Science and Technology 4(11):763–769
Huang L, Bell R, Dell B, Woodward J (2004) Rapid nitric acid digestion of
plant material with an open-vessel microwave system. Commun Soil Sci
Plant Anal 35(3–4):427–440
Narin I, Tuzen M, Soylak M (2004) Comparison of sample preparation
procedures for the determination of trace heavy metals in house dust,
tobacco and tea samples by atomic absorption spectrometry. Anal Chim
94(11):867–873
Hseu Z-Y (2004) Evaluating heavy metal contents in nine composts using
four digestion methods. Bioresour Technol 95(1):53–59
Du Laing G, Tack FM, Verloo MG (2003) Performance of selected destruction methods for the determination of heavy metals in reed plants
(Phragmites australis). Anal Chim Acta 497(1):191–198
Kachenko AG, Singh B (2006) Heavy metals contamination in vegetables
grown in urban and metal smelter contaminated sites in Australia. Water
Air Soil Pollut 169(1–4):101–123
Tarafdar S, Khan A, Rahman M (1985) Determination of Trace Elements in
Bangladesh Tea Leaves. Agric Biol Chem 49(1):201–202
Karim Z, Rahman A (1980) Cationic environment in some selected tea
soils of Bangladesh. Tea Quarterly 49(1):53–57
Marcos Ana, Fisher Andrew, Rea Gerry (1998) Hill SJ: preliminary study
using trace element concentrations and a chemometrics approach
to determine the geographical origin of tea. J Anal At Spectrom
13(6):521–525
Moreda-Pineiro A, Fisher A, Hill SJ (2003) The classification of tea according to region of origin using pattern recognition techniques and trace
metal data. J Food Compos Anal 16(2):195–211
Organization JFWECoFAWH: Safety evaluation of certain mycotoxins in
food, vol. 74. Food and Agriculture Org. 2001
Melucci D, Locatelli M, Locatelli C (2013) Trace level voltammetric determination of heavy metals and total mercury in tea matrices (Camellia
sinensis). Food Chem Toxicol 62:901–907
Limmatvapirat C, Charoenteeraboon J, Phaechamud T (2012) Determination of Heavy Metals in Herbal Teas by Inductively Coupled Plasma Mass
Spectrometry. Res J Pharm, Biol Chem Sci 3(3):952–958
Cabrera C, Giménez R, López MC (2003) Determination of tea components with antioxidant activity. J Agric Food Chem 51(15):4427–4435
Kim K-C, Park Y-B, Lee M-J, Kim J-B, Huh J-W, Kim D-H, Lee J-B, Kim J-C
(2008) Levels of heavy metals in candy packages and candies likely to be
consumed by small children. Food Res Int 41(4):411–418
Rashid et al. Chemistry Central Journal (2016) 10:7
41. Shekoohiyan S, Ghoochani M, Mohagheghian A, Mahvi AH, Yunesian
M, Nazmara S (2012) Determination of lead, cadmium and arsenic in
infusion tea cultivated in north of Iran. Iranian J Environl Health Sci Eng
9(1):1–6
42. Schwalfenberg G, Genuis SJ, Rodushkin I (2013) The benefits and risks of
consuming brewed tea: beware of toxic element contamination. J Toxicol
2013:370460
43. Selenium PHS: Agency for Toxic Substances and Disease Registry.
Retrieved 01 May 2009, 2009
44. Soylak M, Aydin A (2011) Determination of some heavy metals in food
and environmental samples by flame atomic absorption spectrometry
after coprecipitation. Food Chem Toxicol 49(6):1242–1248
45. Jean-Philippe SR, Labbe N, Franklin JA, Johnson A (2012) Detection of
mercury and other metals in mercury contaminated soils using midinfrared spectroscopy. Proc Intern Acad Ecol Environ Sci 2(3):139–149
46. Prajapati SK, Meravi N (2014) Heavy metal speciation of soil and Calotropis procera from thermal power plant area. Proc Intern Acad Ecol Environ
Sci 4(2):68–71
47. Chen F (2007) Pu L-j: relationship between heavy metals and basic properties of agricultural soils in Kunshan County. Soils 39:291–296
Page 13 of 13
48. Metka S, Walter G. Accumulation of selenium in natural plants and selenium supplemented vegetable and selenium speciation by HPLC-ICPMS.
Chem Speciation Bioavailability. 2005, 17(2)
49. Karak T, Paul RK, Sonar I, Sanyal S, Ahmed KZ, Boruah RK, Das DK, Dutta AK
(2014) Chromium in soil and tea (Camellia sinensis L.) infusion: does soil
amendment with municipal solid waste compost make sense? Food Res
Int 64:114–124
50. Salahinejad M, Aflaki F (2010) Toxic and essential mineral elements
content of black tea leaves and their tea infusions consumed in Iran. Biol
Trace Elem Res 134(1):109–117
51. Barone G, Giacominelli-Stuffler R, Storelli MM (2016) Evaluation of trace
metal and polychlorinated biphenyl levels in tea brands of different
origin commercialized in Italy. Food Chem Toxicol 87:113–119
52. Ning P, Gong C, Zhang Y, Guo K, Bai J (2011) Lead, cadmium, arsenic, mercury
and copper levels in Chinese Yunnan Pu’er tea. Food Addit Contam 4(1):28–33
53. Nookabkaew S, Rangkadilok N, Satayavivad J (2006) Determination of
trace elements in herbal tea products and their infusions consumed in
Thailand. J Agric Food Chem 54(18):6939–6944
54. Falahi E, Hedaiati R (2013) Heavy metal content of black teas consumed
in Iran. Food Additives & Contaminants: Part B 6(2):123–126