Tautomerization, acidity, basicity, and stability of cyanoform: A computational study
Bạn đang xem bản rút gọn của tài liệu. Xem và tải ngay bản đầy đủ của tài liệu tại đây (2.58 MB, 12 trang )
Elroby Chemistry Central Journal (2016) 10:20
DOI 10.1186/s13065-016-0166-z
RESEARCH ARTICLE
Open Access
Tautomerization, acidity, basicity,
and stability of cyanoform: a computational
study
Shaaban A. Elroby1,2*
Abstract
Background: Cyanoform is long known as one of the strongest acid. Cyanoform is only stable below −40 °C. The
issue of the stability and tautomeric equilibria of cyanoform (CF) are investigated at the DFT and MP2 levels of theory.
The present work presents a detailed study of structural tautomer interconversion in three different media, namely,
in the gas phase, in a solvent continuum, and in a microhydrated environment where the first solvation layer is
described explicitly by one or two water molecule. In all cases, the transition state has been localized and identified.
Proton affinities, deprotonation energies and the Raman spectra are reported analyzed and discussed.
Results: The 1 tautomer of cyanoform is shown to be more stable than 2 form by only 1.8 and 14.1 kcal/mol in the
gas phase using B3LYP/6-311 ++G** and MP2/6-311 ++G** level of theory, respectively. This energy difference is
reduced to 0.7 and 13.4 kcal/mol in water as a solvent using CPCM model using B3LYP/6-311 ++G** and MP2/6311 ++G** level of theory, respectively. The potential energy barrier for this proton transfer process in the gas phase
is 77.5 kcal/mol at MP2/6-311 ++G** level of theory. NBO analysis, analysis of the electrostatic potential (ESP) of
the charge distribution, donor–acceptor interactions and charge transfer interactions in 1 and 2 are performed and
discussed.
Conclusions: Gross solvent continuum effects have but negligible effect on this barrier. Inclusion of one and two
water molecules to describe explicitly the first solvation layer, within the supermolecule model, lowers the barrier
considerably (29.0 and 7.6 kcal/mol, respectively). Natural bond orbital (NBO) analysis indicated that the stability of the
cyanoform arising from charge delocalization. A very good agreement between experimental and theoretical data
has been found at MP2/6-311 ++G** for the energies. On other hand, B3LYP/6-311 ++G** level of theory has good
agreement with experimental spectra for CF compound.
Keywords: Cyanoform, Tautomerization, Water-assisted proton transfer, B3LYP, MP2, PCM, Raman spectra
Background
Tricyanomethane or cyanoform is long known as one of
the strongest acid with pKa = −5.1 in water and 5.1 in
acetonitrile [1], however, its relative stability have been
and still is a controversial subject. The molecule has previously only been identified by microwave spectroscopy
in the gas phase at very low pressures [2–4].
*Correspondence:
1
Chemistry Department, Faculty of Science, King Abdulaziz University,
P.O. Box 80203, Jeddah 21589, Saudi Arabia
Full list of author information is available at the end of the article
Since the first attempt of its synthesis and isolation
in 1896, numerous attempts to isolate cyanoform have
been reported, but none of them were successful. Dunitz et al. reviewed these attempts and reinvestigated most
of them [5]. The tautomeric dicyanoketenimine (2), tricyanomethanide (1), scheme 1) was suggested to play
a role in the stability and high acidity of 1. Structure 1
is only stable below −40 °C [6]. Its extreme high acidity
was interpreted on the basis that its structure has three
cyano groups attached to CH group. The deprotonation
of hydrogen from center carbon is very easily, making
it a strong acid and demonstrating a fundamental rule
© 2016 Elroby. This article is distributed under the terms of the Creative Commons Attribution 4.0 International License (http://
creativecommons.org/licenses/by/4.0/), which permits unrestricted use, distribution, and reproduction in any medium, provided
you give appropriate credit to the original author(s) and the source, provide a link to the Creative Commons license, and indicate
if changes were made. The Creative Commons Public Domain Dedication waiver ( />zero/1.0/) applies to the data made available in this article, unless otherwise stated.
Elroby Chemistry Central Journal (2016) 10:20
Page 2 of 12
1
7 N
C
4
H2
C1
2
C
N
N6
3
Tautomerization
C
C
C5
C
N8
N
C
N
H
Scheme 1 Tautomers form of cyanoform 1 and 2
of carbon acids. The rule describes how electron-loving
groups attached to a central hydrogen-toting carbon pull
on that carbon’s electrons.
The stability and structure of 1 in the gas phase were
investigated by quantum chemical calculations [7–13].
Results of these computational studies revealed that 1 is
more stable than 2 by about 7–10 kcal/mole in the gas
phase. In the present work, the issue of the stability and
tautomeric equilibria of 1 are revisited. Computations at
high level of theory and in the gas as well as in solution
are performed. Water-assisted proton transfer is investigated for the first time where transition states, a barrier
energies and thermodynamic parameters are computed.
The ground state geometries, proton affinities, deprotonation energies and
the Raman spectra are reported. NBO analysis of the
charge distribution, donor–acceptor interactions and
charge transfer interactions in 1 and 2 are performed and
discussed.
Computational methods
All quantum chemical calculations are carried out using
the Gaussian 09 [14] suite of programs. Full geometry
optimizations for each and every species studied have
been carried out using two DFT functionals namely, the
B3LYP [15–17], and MP2 [18–20] methods using the
6-311 ++G** basis set. The frequency calculations carried out confirm that all the optimized structures correspond to true minima as no negative vibration frequency
was observed. Number of imaginary frequencies are
zero for minima and one for transition states. Zero point
energy (ZPE) was enclosed in all energetic data.
Among all DFT methods, B3LYP often gives geometries and vibration frequencies, which are closest to those
obtained from the MP2 method. Natural bond orbital
(NBO) population analysis on optimized structures is
accomplished at the B3LYP/6-311 ++G** level [21].
NBO calculations were performed using NBO 5.0 program as implemented in the gaussian 09 W package.
The effect of solvent (water) is taken in consider using
the self-consistent reaction field polarisable continuum
model (SCRF/PCM) and SMD models [22–24]. Results
were visualized using chemcraft program [25].
Results and discussion
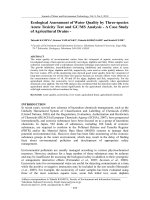
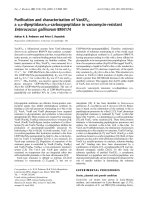
Figure 1 displays the fully optimized structure of 1, TS,
and 2. These structures represent the global minima on
the respective potential energy surfaces computed at two
different levels of theory, namely, B3LYP and MP2/6311 ++G**. The two theoretical models gave very comparable geometries. 1 is highly symmetric tetrahedral
structure with all C–C–C 110.9o and the C–C-H angle
108.0°. That is the central carbon atom assumes a typical sp3 hybridization scheme. Tautomer 2, on the other
hand, is planar having the central carbon atom assuming
an sp2 hybridization scheme with C–C–C angles of 120o.
The hydrogen atom in 2 form is tilted out of the molecular plane by an angle of 53o. The two tautomers (1 and
2) show also some minor structure variations reflected
in the shortening of the C–C and slight elongation of
the C-N bond lengths upon going from 1 to 2. Figure 1
displays also the net charges on each atom of 1 and 2. It
can be easily noticed that the C-N–H moiety is highly
polarized with a considerable charge (0.538, −0.516 and
0.408e, on the C, N and H, respectively) separation. This
charge separation is much greater than that observed
for the 1 tautomer (0.289 and −0.480 on the C and N,
respectively).
Due to the 1 → 2 intramolecular-proton transfer, a
number of structural parameters of the 1 form have
changed. Going from the 1 to the 2 tautomer, the C–C
bonds length decreases from 1.475 to 1.430 and 1.342 Å,
Elroby Chemistry Central Journal (2016) 10:20
Page 3 of 12
Fig. 1 Optimized structures of CF-CH, TS and CF-NH structures obtained at the B3LYP/6-311 ++G** level. Bond length is in Angstrom, charge
distribution is natural charge
whereas the C–N bond length enlarges from 1.175 to
1.178 Å. In the optimized geometry of the TS, breaking
of the C–H1 bond together with the formation of N8–H1
bond is clear. In 1 tautomer, The C1–H1 and C–C distances vary from 1.098 and 1.474 Å for the 1 tautomer to
1.862 and 1.426 Å for the TS, respectively. The N1–H1 is
1.539Å in TS. This distance is 1.019 Å for the 2 tautomer.
The analysis of the normal modes of TS imaginary frequencies (−1588.00) revealed the displacements of N6–
H2 and C1–H2 bond lengths of 1.
Tautomerization 1⇄2
Proton transfer reactions are very important in chemistry
and biology as it underlie several technological and biological processes.
Some investigations [6] have suggested that the tautomeric form 2 may exist and underlies the strong acidity
of cyanoform. In the present section, the possibility of 1,
3 proton transfer in 1 will be explored.
Table 1 compares the relative energies of the two tautomers 1 and 2 computed at two different level of theory.
Elroby Chemistry Central Journal (2016) 10:20
Page 4 of 12
Table 1 Total and relative energies for the studied species using two methods (B3LYP and MP2) at 6-311 ++G** basis set
in the gas phase and in the solution
Structure
Gas phase
Solvent
MP2
B3LYP
Et/au
1
2
TS
CF−
(CFH)+
−316.40004
−316.37761
−316.28143
−315.91668
−316.70615
kcal/mol
0.0
Ere
14.1
Ea
77.5
DP
303.3
PA(H)
−46.8
MP2
Et/au
kcal/mol
−317.27785
kcal/mol
0.000
−317.27506
Ere
−317.16841
B3LYP
1.8
Ere
0.0
0.0
13.4
0.7
−316.79868
Ea
68.7
Ea
74.4
68.4
DP
300.7
DP
272.7
262.6
−317.54566
PA(H)
−230.1
−231.4
−168.1
PA(H)
Et electronic energy, Ere relative energy between two tautomeric forms, Ea barrier energy, DP deprotonation energy, PA protonation energy
The two methods indicated that the 1 form is more stable than 2 form by 14.1 and, 1.8 kcal/mol, at the MP2/6311 ++G** and B3LYP/6-311 ++G** levels of theory in
the gas phase, respectively. It seems that B3LYP is not
able to account for some stabilizing interactions in 1 in
particular electron correlations which is well accounted
by MP2 calculations.
Table 1 compiles also relative energies in water as a
solvent computed using the solvent continuum model
CPCM, where the 1 tautomer is found to be the more
stable. Solvent dielectric constant seems to have marked
effect on the stability of 1. This is in agreement with a
previous experimental study [6].
The lower relative stability of the 2 tautomer may be
due to the close proximity of the lone pairs of electrons
on the N8 atom and the adjacent triple bond in 2 forms,
in 2 form H–N–C angle is bent. On the other hand, the
lone pairs of electrons on all N atoms in 1 tautomer are
projected in opposite directions collinear with triple
bonds. This will minimize the repulsive force in the 1 tautomer as compared to that in the 2.
The 1, 3 proton transfer process takes place via the
transfer of the H atom from the central carbon atom to
N8. We have been able to localize and identify the transition state (TS) for this process, which is displayed in
Fig. 1. Some selected structural parameters of the TS
are collected together with the corresponding values
for 1 and 2 tautomers for comparison (Additional file 1:
Tables 1S and 2S and Figure 1S.
The barrier energy computed for this tautomerization reaction is 68.7 and 74.4 kcal/mol at B3LYP/6311 ++G** and MP2/6-311 ++G** level of theory in the
gas phase, respectively.
In the present work, results generated by DFT and MP2
methods at 6-311 ++G** basis set, barrier energy (Ea)
of the 1 and 2 tautomerism in aqueous solution is 68.4
and 77.5 kcal/mol, respectively. This high energy barrier
seems to indicate that this reaction is not feasible at room
temperature. Solvent dielectric continuum seems to have
but little effect on this barrier; in fact, it reduced it by less
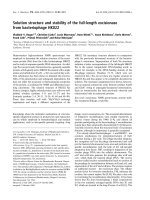
than 1 % (see Fig. 2).
Considering the equilibrium between the 1 and 2 tautomers, the value of the tautomeric equilibrium constant
(K) is calculated by using
K = e−�G/RT
(1)
where ΔG, R and T are the Gibbs free energy difference
between the two tautomers, the gas constant and temperature, respectively.
The Gibbs free energy difference between the tautomers is in favor of the 1 tautomer by 13.0 kcal/mol using
MP2/6-311 ++G** level of theory. By using the Eq. (1), K
equal about 3.14 × 10⁻¹⁰.
To calculate the relative free energies of two tautomers, 1 and 2, in water solution, (ΔG1−2)sol we use a simple
energy cycle of scheme 2:
(�G1 − 2)sol = −�Gsol1 + (�G1 − 2)gas + �Gsol2
where (ΔG1−2)gas is the free energy difference between 1
and 2 in the gas phase and ΔGsol1 and ΔGsol 2 are the free
energies of solvation of 1 and 2, respectively.
The calculated relative energy and relative free energy
of two tautomers in the water solution are presented in
Table 2. The 1 form is the most stable tautomer than 2 by
relative energy and free energy. The relative free energy
between 1 and 2 tautomers are 26.8 and 26.4 kcal/mol
using the SMD and CPCM models, respectively. The 2
tautomer is less stable than 1 by 14.6 and 14.1 kcal/mol
using the SMD and CPCM solvation models, respectively.
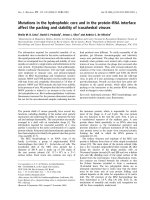
Water‑assisted proton transfer
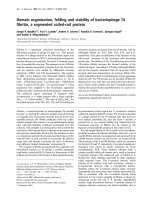
The structure computed in the gas-phase for TS (Fig. 3)
reveals the formation of a triangular 4-membered ring.
The high energy and relative instability of this TS is
associated with the large strain in this triangular ring.
In solution, however, one way to relief this strain is to
Elroby Chemistry Central Journal (2016) 10:20
Page 5 of 12
barrier energy kcal/mol
77.5
74.4
29.1
7.6
0
GAS
SOLVENT
6-311++G**
H2O
2H2O
WATER-ASSISTED / 6-311++G**
Fig. 2 The barriers energy for the proton-transfer process of 1 assisted by one and two water molecule, with and without PCM–Water. Energies are
in kcal/mol at the MP2 method at basis set 6-311 ++G**
Scheme 2 An energy cycle used to calculate relative free energies of
tautomers in water solution
Table
2 The relative energies and relative free energies for the two tautomer’s using SMD and CPCM models
at MP2/6-311 ++G** level of theory in water solution
Structure
SMD
Ere
CPCM
ΔG
Ere
ΔG
1
0.0
0
0.0
0.0
2
14.6
26.8
14.1
26.4
The unit of energies is kcal/mol
incorporate one or more water molecules in the formation of the transition state. We have examined the possibility of water-assisted proton transfer for the studied
tautomerization reaction using MP2/6-311 ++G**
level of theory. We have incorporate one and two water
molecules. The TS’s so obtained are displayed in Fig. 3
and the corresponding energy quantities are compiled
in Table 1. The presence of one water molecule in the
structure of the transition state considerably relief the
ring strain and stabilize it considerably to lie at only
29.6 kcal/mol above the 1 form as shown in Fig. 2. The
incorporation of two water molecules, stabilize TS
reflecting the stability associated with 8-membered ring
formed. The barrier energy with two water molecules
is about 7.6 kcal/mol. The energy profile presented in
Fig. 2 shows that the most important difference between
the prototropic tautomerism of dihydrated species and
the isolated compound is associated with the activation
barriers, which become almost ten times or even less
than ten times of those obtained for the isolated compound; this is a well-known phenomenon [26–32]. Thermodynamics of tautomerization of 1, Table 3 compiles
Elroby Chemistry Central Journal (2016) 10:20
Page 6 of 12
Fig. 3 Optimized structures, of two (left) and one (right) water-assisted transition states for the tautomerization of cyanoform computed at MP2/6311 ++G** level of theory
Table 3 Thermal energy parameters for the studied species using B3LYP/6-311 ++G** level of theory in solution at 260
and 300 K
T = 260 K
1
2
T = 300 K
H/au
G/au
S/Cal/Mol.K
H/au
G/au
S/Cal/Mol.K
−317.2288
−317.260935
77.565
−317.22743
−317.265745
80.639
−317.22652
−317.25843
77.013
the computed thermodynamic parameters at room temperature and at −40 °C.; at this temperature 1 is known
to be stable [6]. Entropies, and enthalpies increase on
going from 260 to 300 K, this may be attributed to the
fact that intensities of molecular vibration increase
with increasing temperature. The enthalpy change (∆H)
and the entropy change (∆S) for the reaction are also
obtained and listed in Table 3. For the tautomerization
of cyanoform 1 to 2, ∆S is negative while the ∆H is positive at both 260 and 300 K. That is, the proton transfer
in cyanoform is an endothermic process. The change in
Gibbs free energy (∆G) at two different temperatures
was also obtained, and is shown in Table 3. ∆G at 260 K
is positive, which demonstrates that the formation process of the CF- NH is not spontaneous.
Protonation and deprotonation
The proton affinity (PA) values help in understanding
fragmentation patterns in mass spectroscopy influenced
by protonation and other proton transfer reactions, the
basicity of molecules and susceptibility toward electrophilic substitution. Knowledge of preferred site of protonation is also of significance for structure elucidation of
polyfunctional molecules [33].
For each protonation and deprotonation site, the structure with the lowest energy was identified as the most
stable and with respect to this, the relative energies are
calculated.
−317.22514
−317.263208
80.121
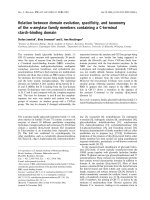
The variation in geometrical parameters on CH-deprotonation and N-protonation at the B3LYP/6-311 ++G**
level theory are displayed in Fig. 4. The analysis of variation in geometrical parameters as a result of protonation
of the N in 1, indicates elongation for adjacent C–C bond
to protonated N atom along with compression of C–N
bond. The protonation energy, ΔEprot, was calculated as
+
follows: ΔEprot = EAH
−EA (where EAH+ is the energy of
cationic acid (protonated form) and EA is the energy of the
neutral form). By the same equation, the deprotonation
energy, DP, was calculated using ΔEDP = E−
A —EA (where
E−
A is the energy of anion (deprotonated form) and EA is
the energy of the neutral form. The proton affinities for 1
sites at B3LYP/6-311 ++G** in the gas phase are higher
than the values evaluated in solution using PCM method
while vice versa is observed for the deprotonation (DP) of
the C-H bond. Table 1 compiles the deprotonation and
protonation energies of the studied species, obtained at
the B3LYP/6-311 ++G** and MP2/6-311 ++G** level of
theory. The deprotonation energies of the CH bond in the
gas phase and in the solution are 303.7 and 272.0 kcal/mol
at MP2 method, respectively, i.e. the CH bond is characterized by a strong acidity (1156 kJ/mol) which is sensibly
higher than that of NH bonds in formamide (1500 kJ/mol),
N-methylformamide (1510 kJ/mol) or N-methylacetamide (1514 kJ/mol) [34]. The reason for this high acidity
is probably a strong delocalization of the negative charge
over three cyano groups around CH bond.
Elroby Chemistry Central Journal (2016) 10:20
Page 7 of 12
Fig. 4 Optimized structures of deprontaed and protonation species of 1 obtained at the B3LYP/6-311 ++G** level of theory. Bond length is in
Angstrom
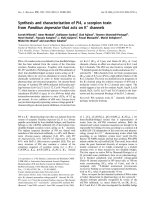
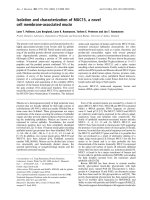
Vibration Raman spectrum analysis
The experimental [6] and theoretically predicted FTRaman spectra (intensities) for 1 are represented in Fig. 5
and detailed band information is summarized Table 4.
FT-Raman spectrum were calculated by the two methods, DFT B3LYP and MP2 using two basis sets, namely
6-311 ++G** and aug-cc-pVQZ, and the frequency was
scaled by 0.96 [35].
The Raman spectrum of cyanoform was reported
recently by Theresa Soltner et al. [6]. Comparison of
the of the theoretically computed frequencies and those
observed experimentally shows a very good agreement
especially with B3LYP/aug-cc-pVQZ level of theory.
Most intensive band in Raman spectra, obtained
experimentally was observed at 2287 cm−1 occurred
in calculated spectra at 2288, 2292 and 2316 cm−1
in B3LYP/6-311 ++G**, B3LYP/aug-cc-pVQZ and
PBE1PBE/6-311G(3df, 3dp) [6] level of theory,
respectively.
MP2 simulated spectra were found have less vibrational band deviation and missing one band from the
observed spectrum for the studied molecule, as shown in
Fig. 6 and Table 4. It is interesting to note that, the C–H
asymmetric stretching vibrations is observed experimentally at 2259 cm−1 and predicted theoretically at 2098
and 2093 cm−1 using the MP2/6-311 ++G** and MP2/
aug-cc-pVQZ level of theory, respectively, in weak agreement. DFT functionals show a good prediction spectra of
nitriles and their anions [36–40].
It should be noted that the B3LYP at the two basis sets
gave good band position evaluation, e.g. band appeared
at 2285 cm−1 (obs), 2895 cm−1 (6-311 ++G**) and
2894 cm−1 (aug-cc-pVQZ).
As it can be seen from Table 4, the theoretically calculated values at 2897 and 1228 cm−1 showed excellent
agreement with the experimental values.
The C–H stretching vibrations is observed experimentally at 2885 cm−1 and predicted theoretically at 2895
and 2894 cm−1 using the 6-311 ++G** and aug-cc-pVQZ
basis sets, respectively, in excellent agreement.
The γ(C-N) stretching is predicted theoretically at
2288 cm−1 using 6-311 ++G** basis set in a very good
agreement with the experimental observed Raman line
at 2287 cm−1. No bands for C=C or C=N stretching
vibrations are observed in FT-Raman of 1. The absence
of any band in the 1500–1900 range confirms that the
stable form for the studied molecule is 1 tautomer. Full
assignment of Raman spectrum of 1 tautomer is given in
Table 4.
NBO analysis
NBO analysis has been performed on the molecule at the
MP2 and B3LYP/6-311 ++G** level of theory in order to
elucidate the intra molecular, hybridization and delocalization of electron density within the studied molecule,
which are presented in Table 5.
Natural bond orbital (NBO) [41, 42] analysis gives
information about interactions in both filled and virtual
orbital spaces that could help to have a detailed analysis of intra and intermolecular interactions. The second
order Fock matrix was carried out to evaluate the donor–
acceptor interactions in the NBO analysis [43].
For each donor NBO (i) and acceptor NBO (j), the stabilization energy associated with i–j delocalization can
be estimated as,
2
E(2) = �Eij = qi = F i, j /εi εj
where qi is the donor orbital occupancy, ɛi, ɛj are diagonal
elements (orbital energies) and F(i,j) is the off-diagonal
NBO Fock matrix clement. The stabilization of a molecular system arises due to overlapping of orbital between
Elroby Chemistry Central Journal (2016) 10:20
Page 8 of 12
2,121.729
Vibrational spectrum
a 220
200
180
Raman activity
160
140
120
2,897.824
100
80
60
40
20
205.663
594.983
269.277 434.675
0
808.727969.036
500
1,228.583
1 000
1 500
Frequency, cm**-1
2 000
2 500
3 000
b
500
2,245.122
3,381.442
450
Raman activity
400
350
300
250
200
150
100
1,279.402
50
0
130.896
0
405.075
627.465
801.111
500
2,071.475
1,169.73
1 000
1 500
2 000
Frequency, cm**-1
2 500
3 000
3 500
Fig. 5 Calculated Raman frequencies (cm−1) (a) 1 and (b) 2 calculated at B3LYP/6-311 ++G** level of theory in the gas phase. Values were scaled
by an empirical of 0.96
bonding and anti-bonding which sequels in an intramolecular charge transfer (ICT).
In Table 5 the perturbation energies of significant
donor–acceptor interactions are comparatively presented
for 1 and 2 forms. The larger the E(2) value, the intense
is the interaction between electron donors and electron
acceptors.
The NBO results show that the specific lone pairs of N
atoms with σ∗ of the C–C bonds interactions are the most
important interactions in 1 and CF_NH, respectively.
In 1, the interactions initiated by the donor NBOs
like σC1–C2, σC3–C4, πN–C and NBOs due to lone pairs of
N atoms are giving substantial stabilization to the structures in the both MP2 and B3LYP methods. Above all,
the interaction between lone pairs namely, N6, N7 and
N8 is giving the most possible stabilization to 1 since
it has the most E(2) value around 12.81 and 11.5 kcal/
mole in 2. The other interaction energy in the 1 and 2 is
π electron donating from π (C3–N6)−π*(C1–C3), π(C3–N6)−
π*(C1–H2), π(C4–N7)−π*(C1–C4), and π (C5–N8)−π*(C1–C5)
Elroby Chemistry Central Journal (2016) 10:20
Page 9 of 12
Table 4 Observed [6] and calculated Raman frequencies (cm−1) (scaled by an empirical factor of 0.96) for 1 using B3LYP
and MP2 methods at two basis sets 6-311 ++G** and aug-cc-pVQZ
B3LYP
6-311 ++G**
MP2
Aug-cc-pVQZ
6-311 ++G**
PBE1PBE
Aug-cc-pVQZ
6-311G (3df,3dp)
Observed
Assignment
342 (3)
337 (2)
323 (3)
316 (2)
345
347 (45)
∂ CCN
549 (5)
551 (5)
544 (4)
541 (5)
556
567 (16)
∂ CCN
555 (2)
553 (1)
559
575 (7)
∂ CCC
804 (6)
808 (7)
808 (7)
801 (8)
813
835 (24)
985 (1)
980 (1)
995 (2)
994 (1)
1002
1022 (7)
vas CC
1238 (3)
1239 (3)
1247 (3)
1239 (2)
1232
1253 (5)
∂ CCH
2281 (34)
2284 (31)
2093 (82)
2098 (98)
2310
2259 (7)
vasCN
2288 (160)
2292 (175)
2101 (18)
2105 (18)
2316
2287 (100)
vsCN
2895 (88)
2894 (85)
2960 (85)
2956 (82)
2922
2885 (38)
v CH
Fig. 6 The HOMO and LUMO frontier orbitals of the 1 and 2 tautomers. (The Isovalue = 0.05) using B3LYP/6-311 ++G** level of theory
vs CC
Elroby Chemistry Central Journal (2016) 10:20
Page 10 of 12
Table 5 Second order perturbation energy (E(2)) in NBO basis for 1 using B3LYP and MP2 methods at 6-311 ++G** basis
set
Donor
Type
Acceptor
Type
E(2)
B3LYP/6-311 ++G**
MP2/6-311 ++G**
1
1
2
2
C1–C3
σ
C4–N7
π*
3.53
5.26
4.25
6.14
C1–C3
σ
C5–N8
π*
3.53
4.21
2.63
5.31
C1–C4
σ
C3–N6
π*
3.53
20.34
4.25
5.68
C1–C4
σ
C4–N7
π*
5.69
7.37
9.19
9.62
C1–C4
σ
C5–N8
π*
3.53
4.44
4.25
5.68
C1–C5
σ
C3–N6
π*
3.53
4.21
4.25
5.31
C1–C5
σ
C4–N7
π*
3.53
5.26
4.25
3.42
C1–C5
σ
C5–N8
π*
5.69
7.48
9.91
4.27
9.09
C3–N6
π
C1–C3
σ*
5.62
2.64
C3–N6
π
C1–H1
σ*
2.76
3.58
C4–N7
π
C1–C4
σ*
5.62
C4–N7
π
C1–H1
σ*
2.76
6.68
8.60
8.62
3.85
C4–N7
π
C1–C3
σ*
2.19
3.57
2.65
4.32
C5–N8
π
C1–C5
σ*
5.62
7.36
8.60
9.09
C5–N8
π
C1–H1
σ*
2.76
C5–N8
π
C1–C3
σ*
2.19
3.34
2.64
3.85
4.12
C5–N8
π
C1–C4
σ*
2.19
6.46
2.64
5.21
N6
LP
C1–C3
σ*
12.13
11.67
12.72
12.52
N7
LP
C1–C4
σ*
12.13
31.61
12.72
78.33
N8
LP
C1–C5
σ*
12.13
11.67
12.72
12.52
E(2) means energy of hyper conjugative interaction (stabilization energy)
*Non-bonding orbitals
resulting stabilization energy of about 5.62, 2.76, 5.69 and
5.89 kcal/mol, respectively. The present study at the two
methods (MP2 and B3LYP), shows clearly that the electron density of conjugated triple bond of cyano groups
exhibits strong delocalization.
The NBO analysis has revealed that the lone pairs of N
atoms and C–C, C–H and C–N bonds interactions give
the strongest stabilization to both of the 1 and 2 with an
average value of 12.5 kcal/mole.
The 3D-distribution map for the highest-occupiedmolecular orbital (HOMO) and the lowest-unoccupiedmolecular orbital (LUMO) of the 1 and 2 tautomers are
shown in Fig. 6. As seen, the HOMO is mainly localized
on the cyano groups; while, the LUMO is mainly localized on the CC bonds.
The energy difference between the HOMO and LUMO
frontier orbitals is one of the most important characteristics of molecules, which has a determining role in such
cases as electric properties, electronic spectra, and photochemical reactions. The gap energy (HOMO–LUMO)
is equal to 9.00 and 5.40 eV for the 1 and 2 tautomers,
respectively. The large energy gap for 1 tautomer implies
that structure of the cyanoform is more stable.
Conclusions
A comparative study of two different theoretical methods
was performed on the cyanoform to obtain the highest
accuracy possible and more reliable structures.
•• Despite the B3LYP and MP2 methods affording good
results which provide a better picture of the geometry and spectra and energetics, respectively, both in
the gas phase and in a water solution (PCM–water).
•• At all levels of theory used, the 1 form is predicted to
be more stable than its 2 form, both in the gas phase
and in solution.
•• The potential energy barrier for this proton transfer process in the gas phase is 77.5 kcal/mol using
MP2/6-311 ++G** level of theory. Gross solvent
continuum effects have negligible effect on this barrier.
•• Inclusion of one and two water molecules to describe
explicitly the first solvation layer, within the supermolecule model, lowers the barrier considerably
(29.1 and 7.6 kcal/mol).
•• There is good correspondence between the DFT-predicted and experimentally reported Raman frequen-
Elroby Chemistry Central Journal (2016) 10:20
cies, confirming suitability of optimized geometry for
the 1 as the most stable conformer of the cyanoform.
This conformation is characterized also by larger
HOMO–LUMO gap of 9.00 eV further confirming
its marked stability.
•• The NBO analysis has revealed that the lone pairs of
N atoms and C–C, C–H and C–N bonds interactions
give the strongest stabilization to both of the 1 and 2
with an average value of 12.5 kcal/mol.
Additional file
Additional file 1. Selected structural parameters.
Author details
1
Chemistry Department, Faculty of Science, King Abdulaziz University, P.O.
Box 80203, Jeddah 21589, Saudi Arabia. 2 Chemistry Department, Faculty
of Science, Beni-Suef University, Beni‑Suef 62511, Egypt.
Acknowledgements
The author would like to thank Prof Rifaat H. Hilal for the valuable discussions.
Competing interests
The author declares that he has no competing interests.
Received: 3 December 2015 Accepted: 28 March 2016
References
1. Raamat E, Kaupmees K, Ovsjannikov G, Trummal A, Ktt A, Saame J, Koppel
I, Kaljurand I, Lipping L, Rodima T, Pihl V, Koppel A, Leito I (2013) Acidities
of strong neutral Brønsted acids in different media. J Phys Org Chem
26:162–170
2. Boyd RH (1963) Cyanocarbon chemistry. XXIII. The ionization behavior of
cyanocarbon acids. J Phys Chem 67(4):737–774
3. Bak B, Scanholt H (1977) The existence of gaseous cyanoform as
observed by microwave spectra. J Mol Struct 37:153–156
4. Schmidtmann H (1896) Ueber einige Derivate des Malonitrils. Ber Dtsch
Chem Ges 29:1168–1175
5. Sisak D, McCusker LB, Buckl A, Wuitschik G, Wu YL, Schweizer W, Dunitz
JD (2010) The search for tricyanomethane (cyanoform). Chem Eur J
16:7224–7230
6. Soltner T, Jonas H, Andreas JK (2015) The existence of tricyanomethane.
Angew Chem Int Ed 54:1–3
7. Clark T, Chandrasekhar J, Spitznagel GW, Schleyer PVR (1983) Efficient
diffuse function-augmented basis sets for anion calculations. III. The
3-21 + G basis set for first-row elements, Li–F. J Comput Chem 4:294–301
8. Krishnan R, Binkley JS, Seeger R, Pople JA (1980) Selfconsistent molecular
orbital methods. XX. A basis set for correlated wave functions. J Chem
Phys 72:650–654
9. McLean D, Chandler GS (1980) Contracted gaussian basis sets for
molecular calculations. I. Second row atoms, Z = 11–18. J Chem Phys
72:5639–5648
10. Perdew JP, Burke K, Ernzerhof M (1996) Generalized gradient approximation made simple. Phys Rev Lett 77:3865–3868
11. Csszr P, Pulay P (1984) Geometry optimization by direct inversion in the
iterative subspace. J Mol Struct 114:31–34
12. Brand H, Liebman JF, Schulz A (2008) Cyano-, nitro- and nitrosomethane derivatives: structures and gas-phase acidities. Eur J Org Chem
2008:4665–4675
13. Trofimenko S, Little EL (1963) Dicyanoketenimine (cyanoform). J Org
Chem 28:217–218
Page 11 of 12
14. Frisch MJ, Trucks GW, Schlegel HB, et al (2009) Gaussian Inc. Revision A.7.
Pittsburgh
15. Becke AD (1996) Density-functional thermochemistry. IV. A new dynamical correlation functional and implications for exact-exchange mixing. J
Chem Phys 104:1040–1046
16. Becke AD (1997) Density-functional thermochemistry. V. Systematic optimization of exchange-correlation functionals. J Chem Phys
107:8554–8560
17. Saebo S, Almlof J (1989) Avoiding the integral storage bottleneck in LCAO
calculations of electron correlation. Chem Phys Lett 154:83–89
18. Chong DP (1997) Recent advances in density functional methods. World
Scientific, Singapore (Parts I and II)
19. Barone V, Bencini A (1999) Recent advances in density functional methods. World Scientific, Singapore (Parts III)
20. Ess DH, Houk KN (2005) Activation energies of pericyclic reactions: performance of DFT, MP2, and CBS-QB3 methods for the prediction of activation barriers and reaction energetics of 1,3-dipolar cycloadditions, and
revised activation enthalpies for a standard set of hydrocarbon pericyclic
reactions. J Phys Chem A 109:9542–9553
21. Glendening ED, Reed AE, Weinhold F, NBO Version 3.1, Carpenter JE
22. Miertos S, Scrocco E, Tomasi J (1981) Electrostatic interaction of a solute
with a continuum. A direct utilization of ab initio molecular potentials for
the prevision of solvent effects. Chem Phys 55:117–229
23. Miertos S, Tomasi J (1982) Approximate evaluations of the electrostatic
free energy and internal energy changes in solution processes. Chem
Phys 65:239–245
24. Marenich AV, Cramer CJ, Truhlar DG (2009) Universal solvation model
based on solute electron density and a continuum model of the solvent
defined by the bulk dielectric constant and atomic surface tensions. J
Phys Chem B 113:6378–6396
25. Barone V, Adamo C (1995) Density functional study of intrinsic and
environmental effects in the tautomeric equilibrium of 2-pyridone. J Phys
Chem 99:15062–15068
26. Gorb L, Leszczynski J (1998) Intramolecular proton transfer in mono- and
dihydrated tautomers of guanine: an ab initio post Hartree–Fock Study. J
Am Chem Soc 120:5024–5032
27. Alkorta I, Elguero J (1998) 1,2-Proton shifts in pyrazole and related systems: a computational study of [1,5]-sigmatropic migrations of hydrogen
and related phenomena. J Chem Soc Perkin Trans 2:2497–2504
28. Alkorta I, Rozas I, Elguero J (1998) A computational approach to intermolecular proton transfer in the solid state: assistance by proton acceptor
molecules. J Chem Soc Perkin Trans 2:2671–2676
29. Balta B, Aviyente V (2004) Solvent effects on glycine II. Water-assisted
tautomerization. J Comput Chem 25:690–703
30. Enchev V, Markova M, Angelova S (2007) Prototropic tautomerism in
aqueous solution: combined and discrete/SCRF models. Chem Phys Res J
1:1–36
31. Markova N, Pejov L, Enchev V (2015) A hybrid statistical mechanics—
quantum chemical model for proton transfer in 5-azauracil and 6-azauracil in water solution. Int J Quantum Chem 115:477–485
32. Damanjit K, Rupinder PK, Ruchi K (2009) Correlation between proton
affinity and conjugation effects in carbamic acid and its higher chalcogenide analogs. J Mol Struct Theochem 9139:90–96
33. Mautner M (1988) Models for strong interactions in proteins and
enzymes. 1. Enhanced acidities of principal biological hydrogen donors. J
Am Chem Soc 110:3071
34. Tsenov J, Stoyanov SS, Binev I (2008) IR spectral and structural changes,
caused by the conversion of 4-cyanobenzamide into azanion: a
combined experimental/computational approach. Bulg Chem Comm
40:520–525
35. Alecu IM, Zheng J, Zhao Y, Truhlar DG (2010) Computational thermochemistry: scale factor databases and scale factors for vibrational
frequencies obtained from electronic model chemistries. J Chem Theory
Comput 6:2872–2887
36. Stoyanov SS, Popova A, Tsenov J (2008) IR spectra and structure of
3,5,5-trimethyl(cyclohex-2-enylidene) malononitrile and its potassium
cyanide and sodium methoxide carbanionic adducts: experimental and
b3lyp studies. Bulg Chem Comm 40:538–545
37. Stoyanov SS, Tsenov JA, Yancheva DY (2012) IR spectra and structure of
2-{5,5-dimethyl-3-[(2-phenyl)vinyl]cyclohex-2-enylidene}-malononitrile
Elroby Chemistry Central Journal (2016) 10:20
and its potassium cyanide and sodium methoxide carbanionic adducts:
experimental and B3LYP theoretical studies. J Mol Struct 1009:42–48
38. Stoyanov SS (2010) Scaling of computed cyano-stretching frequencies
and IR intensities of nitriles, their anions, and radicals. J Phys Chem A
114:5149–5161
39. Tsenov J, Stoyanov SS, Binev I (2005) Experimental and computational
studies on the IR spectra and structures of the free tricyanomethanide
carbanion and its potassium ion-pair. Bulg Chem Comm 37:361
40. Weinhold F, Landis CR (2005) Valency and bonding: a natural bond orbital
donor-acceptor perspective. Cambridge University Press, Cambridge
Page 12 of 12
41. Weinhold F (1998) Natural bond orbital methods. In: Schleyer PVR,
Allinger NL, Clark T, Gasteiger J, Kollman PA, Schaefe HF III, Schreiner PR
(eds) Encyclopedia of computational chemistry, vol 3. Wiley, Chichester,
UK, pp 1792–1811
42. Markova N, Pejov L, Enchev V (2015) A hybrid statistical mechanics—
quantum chemical model for proton transfer in 5-azauracil and 6-azauracil in water solution. Int J Quant Chem 115:477–485
43. Zhurko GA, Zhurko DA (2009) Chemcraft program, Academic version 1.8.