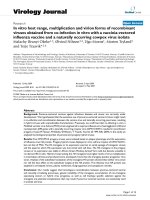
In vitro drug release characteristic and cytotoxic activity of silibinin-loaded single walled carbon nanotubes functionalized with biocompatible polymers
Bạn đang xem bản rút gọn của tài liệu. Xem và tải ngay bản đầy đủ của tài liệu tại đây (1.99 MB, 12 trang )
Tan et al. Chemistry Central Journal (2016) 10:81
DOI 10.1186/s13065-016-0228-2
Open Access
RESEARCH ARTICLE
In vitro drug release characteristic
and cytotoxic activity of silibinin‑loaded single
walled carbon nanotubes functionalized
with biocompatible polymers
Julia Meihua Tan1 , Govindarajan Karthivashan2, Shafinaz Abd Gani2, Sharida Fakurazi2,3
and Mohd Zobir Hussein1*
Abstract
In this paper, we demonstrate the preparation of silibinin-loaded carbon nanotubes (SWSB) with surface coating
agents via non-covalent approach as an effective drug delivery system. The resulting surface-coated SWSB nanocomposites are extensively characterized by Fourier transform infrared (FTIR) and Raman spectroscopies, ultraviolet–visible (UV–Vis) spectrometry and field emission scanning electron microscopy (FESEM). The FTIR and Raman
studies show that an additional layer is formed by these coating agents in the prepared nanocomposites during the
coating treatment and these results are confirmed by FESEM. Drug loading and release profiles of the coated SWSB
nanocomposites in phosphate buffered saline solution at pH 7.4 is evaluated by UV–Vis spectrometry. The in vitro
results indicate that the surface-modified nanocomposites, with SB loading of 45 wt%, altered the initial burst and
thus, resulted in a more prolonged and sustained release of SB. In addition, these nanocomposites exhibit a pseudosecond-order release kinetic which was driven by the ion exchange between the ionized SWSB and the anions in the
release medium. The cytotoxicity effect of the resulting nanocomposites on normal mouse fibroblast cells is evaluated by 3-(4,5-dimethylthiazol-2-yl)-2,5-diphenyltetrazolium bromide (MTT) assay. It is observed that the surfactant
and polymer coating improved the biocompatibility of the SWSB nanocomposites significantly, which deem further
exploitation for their application as potential anticancer drug delivery system.
Keywords: Anticancer drug, Polysorbate 20, Polysorbate 80, Polyethylene glycol, Chitosan, Surface coatings
Background
Cancer, a common name given to a group of related illnesses, has a great impact on public health across the
world. In the United States, cancer is the second leading
cause of death after heart disease, accounting for nearly 1
of every 4 deaths [1]. According to the source which was
published recently, American men have a slightly higher
risk for developing cancer (less than 1 in 2) compared
to women (a little more than 1 in 3) over the course of
their lifetimes. These figures reveal that, cancer rates are
*Correspondence:
1
Materials Synthesis and Characterization Laboratory, Institute
of Advanced Technology (ITMA), Universiti Putra Malaysia, 43400 Serdang,
Selangor, Malaysia
Full list of author information is available at the end of the article
growing at an alarming speed and it is expected to rise by
57% globally in the next 20 years, as predicted by World
Health Organization [2].
Chemotherapy is the drug treatment for cancer disease using powerful chemicals, and it is expected to kill
the cancer cells for maximum treatment efficacy without
destroying other normal cells in the body. However, many
of the conventional chemotherapies are often associated
with drug administration problems like lack of selectivity, limited solubility, poor distribution, systemic toxicity
and the inability of drugs to cross cellular barriers. Therefore, it is essentially important for medicinal chemists to
alter the drug actions by developing a well-designed drug
delivery system with specific tumour-targeting and pHtriggered unloading properties, while reducing unwanted
© The Author(s) 2016. This article is distributed under the terms of the Creative Commons Attribution 4.0 International License
( which permits unrestricted use, distribution, and reproduction in any medium,
provided you give appropriate credit to the original author(s) and the source, provide a link to the Creative Commons license,
and indicate if changes were made. The Creative Commons Public Domain Dedication waiver ( />publicdomain/zero/1.0/) applies to the data made available in this article, unless otherwise stated.
Tan et al. Chemistry Central Journal (2016) 10:81
side effects (e.g. fatigue, nerve damage, nausea, hair loss,
skin and nail changes, heart trouble, and etc.) which can
lead to serious complications.
In the recent years, silibinin (SB) has received a great
amount of attention as herbal remedy to treat cancerrelated diseases. It has demonstrated potential clinical
applications in the treatment of neurodegenerative and
neurotoxic related diseases, diabetes mellitus, Amanita
mushroom poisoning, several types of nephrotoxicity,
alcoholic liver cirrhosis and various forms of in vitro and
in vivo cancer models [3–6]. SB, as the main constituent of silymarin, is obtained from the medicinal plant
silybum marianum (milk thistle) and has been used for
centuries to treat liver disorders due to its potent hepatoprotective effect [7]. However, its low solubility in aqueous environment which leads to poor bioavailability in
the human body, has limited its clinical potential in biomedical applications.
Carbon nanomaterials such as carbon nanotubes have
been extensively researched as a carrier for anticancer drugs [8], as they are capable of penetrating cellular
membranes [9] and allow for high drug loading [10] due
to their unique architectural features (e.g. high aspect
ratio and nanoscale dimensions). They have the potential to deliver therapeutic molecules to the targeted site
of action by conjugation to ligands of cancer cell surface
receptors or antigens [11], which makes them an ideal
delivery system to treat cancer diseases at the cellular
level. In addition, they can be covalently or non-covalently functionalized with hydrophilic materials such as
polysorbate surfactant and polyethylene glycol (PEG) [12,
13], to improve their biocompatibility and dispersability
in physiological environment.
Previously, we have reported the preparation of SBloaded nanohybrid based on carboxylic acid functionalized single walled carbon nanotubes (SWCNT-COOH)
[14]. Our preliminary findings showed that the system,
with low toxicity, significantly suppressed the growth of
human cancer cell lines, in particular, human lung cancer
cells (A549) when compared to pure SB. Furthermore,
the system possess favourable sustained release characteristic and the release rate is pH-dependent which further justify its potential to be developed into novel drug
delivery system for cancer treatment. In this work, as an
attempt to further improve the system’s biocompatibility,
we have designed and prepared a new type of drug delivery system involved the use of surface-modified SWCNT
for water-insoluble anticancer drug, SB. Biocompatible
surface coating agents, namely polysorbate 20 (T20), polysorbate 80 (T80), PEG and chitosan (CS) were used to
non-covalently wrapped around the SB-loaded SWNTs
(SWSB), imparting water-solubility and biocompatibility
to the nanotubes.
Page 2 of 12
Normal mouse fibroblast cells (3T3) were employed to
be comparable to the existing peer-reviewed literature
since a vast number of papers suggest that carbon nanotubes possess a potential toxicological effect [15–17] but
little is known about the cytotoxicity of drug-loaded carbon nanotubes, particularly of SWCNT form. In general,
fibroblasts are the most versatile of connective-tissue
cells and form supporting framework (stroma) of tissues through their secretion of extracellular matrix components which consists of ground substance and fibres
[18]. Besides, these connective tissues play a critical role
in wound healing and fibrosis, sharing some similarities
with cancer-associated fibroblasts that are present within
the tumour stroma of many cancers [19]. For this purpose, the biocompatibility and cytotoxicity characteristic
of surface-coated SWSB in fibroblasts were investigated
by the 3-(4,5-dimethylthiazol-2-yl)-2,5-diphenyltetrazolium bromide (MTT) assay under in vitro environments.
Experimental
Materials
The SWCNT-COOH of purity 90 wt% (impurities: <5%
metal oxide as determined by TGA) and produced by the
method of chemical vapour deposition, was purchased
from Chengdu Organic Chemicals Co., Ltd. (Chengdu,
China). They consist of short carboxyl carbon nanotubes with a diameter of 1–2 nm and a length of 1–3 μm
(thus, aspect ratio >1000) and the COOH content was
found to be around 2.73 wt%. The SB (≥98% purity,
482.44 g mol−1) and ethanol (>99.8% purity) were purchased from Sigma-Aldrich (Buchs, Switzerland) and the
latter was used as solvent for SB. The T20 (polyethylene
glycol sorbitan monolaurate, C58H114O26), T80 (polyethylene glycol sorbitan monooleate, C64H124O26), CS (low
molecular weight, 75–85% degree of acetylation) and
phosphate buffered saline (PBS) solution were sourced
from Sigma-Aldrich (Saint Louis, USA). PEG (average
molecular weight 300) was supplied by Acros Organics
(Geel, Belgium). Acetic acid (99.8% purity) was obtained
from HmbG Chemicals (Hamburg, Germany) and used
as solvent for CS. All materials were analytical reagent
grade and used without further purification.
Instruments
Fourier transform infrared (FTIR) measurements were
performed on a Thermo Nicolet Nexus 671 (model Smart
Orbit). The FTIR spectra of the samples were recorded in
the scanning range of 400–4000 cm−1 with 32 scans at a
resolution of 2 cm−1 using KBr disc method, except for
pure T20 and T80 via a direct deposition method. Raman
spectra were collected using a WITec UHTS 300 Raman
spectrometer with an excitation wavelength at 532 nm
and detailed scans were performed in the range of
Tan et al. Chemistry Central Journal (2016) 10:81
100–3000 cm−1. UV–Vis spectra were used to study the
optical property of the samples in a drug release experiment, using a Perkin Elmer Lambda 35 spectrophotometer. Thermogravimetric analysis (TGA) was carried out
using a TA Q500 with a heating rate of 10 °C min−1 under
a nitrogen purge of 40 mL min−1 in the temperature
range of 30–900 °C. The coating content was calculated
to be about 19.3, 56.4, 15.7 and 4.6 wt% for T20, T80,
PEG and CS respectively, based on the comparison of
coated samples with the uncoated ones [20]. The surface
morphology of the samples was captured on a Hitachi
UHR SU8030 FESEM at 10 kV.
Preparation of carbon nanotubes‑silibinin formulation
(SWSB)
The solution of SB was prepared according to the method
described by our previous report [14]. It is noted that
the best-fit linearity was obtained in the range of 0.003–
0.05 mg mL−1 in ethanol and thus, maximum dosage of
SB at 0.05 mg mL−1 was selected in the study. Approximately 400 mg of SWCNT-COOH (as the starting
material) was incubated in 400 mL of SB solution and
sonicated in a water bath for 1 h in order to separate the
nanotubes. Subsequently, the pH of the suspension was
slowly adjusted to 4 to facilitate SB uptake. The suspension was then magnetically stirred at room temperature
for about 20 h and followed by a centrifugation step at
4000 rpm for 15 min. After discarding the supernatant,
the nanotubes were washed three times with ethanol and
deionized water in order to remove excessive unbound
SB. Finally, the product was dried in an oven at 60 °C for
24 h to obtain SWSB.
Preparation of the surface‑coated SWSB nanocomposites
The surface-coated SWSB was synthesized by adding
100 mg of SWSB into 100 mL of deionized water containing 1% T20, T80, PEG or 0.5% CS (v/v) and magnetically stirred for 24 h at room temperature. After that, the
reaction mixture was then collected, centrifuged and
rinsed with deionized water three times. Finally, the
black precipitate was left to dry completely in an oven to
yield SWSB-T20, SWSB-T80, SWSB-PEG or SWSB-CS
nanocomposites.
Drug loading and releasing
The amount of SB loaded into the SWCNT-COOH was
determined by measuring the absorbance at 288 nm relative to a calibration curve based on the wt% of the initial drug to the unbound drug in the supernatant using
a UV–Vis spectrophotometer. The drug loading capacity
of SWCNT-COOH with SB was calculated to be around
45 wt%. Orally administered SB is known to demonstrate low oral bioavailability of 30–50% due to rapid
Page 3 of 12
metabolism of the first-pass effect to form conjugates
such as glucuronide and sulfate which may not have the
same biological activities as the parent compound [21,
22]. Since the loading of SB in the prepared carbon nanotubes was within the bioavailability range of the drug and
hence, this concentration (about 45 wt% of loaded SB)
was used throughout the study.
To examine the drug release behaviour, 1 mg of surface-coated SWSB was dispersed in 3.5 mL of PBS release
media at pH 7.4 (simulating human body physiological
condition). The temperature inside the UV–Vis machine
was found to be approximately ±35 °C. The release
amount of SB was recorded at predetermined time intervals and the release data was then fitted into five kinetic
mathematical equations (i.e. zero order, pseudo-first
order, pseudo-second order, Higuchi and KorsmeyerPeppas models).
Cell culture conditions
Cytotoxicity experiments were performed on the normal
mouse fibroblast cell line 3T3 (ATCC, Manassas, USA).
The cells were maintained as monolayers in plastic flasks
in DMEM supplemented with 10% fetal bovine serum,
15 mmol L−1 l-glutamine, 100 units mL−1 penicillin,
and 100 g mL−1 streptomycin and grown in a humidified incubator with 5% CO2 at 37 °C. Confluent cells
were trypsinized in a trypsin/EDTA solution and subsequently seeded into a 96-well plate containing 1 × 10⁵
cells mL−1 and kept overnight for cell attachment. For
treatment purpose, old media were discarded and new
culture medium (controls) or culture medium containing different concentrations of surface-coated SWSB was
added to the wells for 24 h. Suspensions of the coated
samples were freshly prepared in PBS medium. Prior to
the cytotoxicity experiment, the stock suspension was
ultrasonicated in 10 s sequential steps for a total time of
30 s in order to reduce agglomeration. The suspensions
were prepared by diluting to the desired concentrations
of 3.125, 6.25, 12.5, 25, 50, 75, and 100 μg mL−1.
MTT cytotoxicity assay
The MTT assay, which converts viable cells with active
metabolism into a purple coloured formazan, was used
to measure cell viability in 3T3 cell line. After culturing
overnight, the cells were treated with different concentrations of SWSB-T20, SWSB-T80, SWSB-PEG and SWSBCS in freshly prepared PBS medium and the plates were
incubated at 37 °C in a 5% CO2 humidified incubator for
72 h. Following incubation, 20 μL of MTT was added to
each well and the plates were incubated for another 3 h.
Subsequently, the solution in each well containing excessive MTT and dead cells was discarded, and 100 μL of
detergent reagent (dimethyl sulfoxide) was then added
Tan et al. Chemistry Central Journal (2016) 10:81
Page 4 of 12
to the cells to stop the conversion and solubilize the
formazan. The quantity of formazan formed is directly
proportional to the number of viable cells after the treatment. The absorbance was measured at 570 nm using a
microplate reader (Model EL 800X), with 630 nm as reference wavelength and the obtained data were averaged
and fitted to Eq. 1, to determine the percentage of cell
viability. The cells cultured without nanotubes were used
as control. The experiment was performed in triplicate,
and the result was expressed as the percentage of cell viability with respect to control cells.
Cell viability (%) = (ODtreatment − ODmedium )/
(ODcontrol − ODmedium ) × 100
(1)
where OD = optical density.
Statistical analysis
Cytotoxicity data in 3T3 cells were obtained from independent experiments with n = 3 for each data point. All
data were expressed as the mean and standard deviation
(±SD) and compared by one-way analysis of variance
(ANOVA) and t-tests using SPSS version 20.0 software.
Results and discussions
Fourier transform infrared
The characteristic bands of SWCNT-COOH, SB and the
final product, SWSB (Fig. 1a) have been discussed in our
previous paper and therefore, in this work the emphasis
is being placed on the surface-coated SWSB nanocomposites. The FTIR spectrum of pure T20 in Fig. 1b demonstrated two strong bands at 2919 and 2858 cm−1 that
could be due to the asymmetric and symmetric C–H
stretching vibrations of the methylene (CH2) group [23].
The absorption bands at 1458 and 1350 cm−1 are attributed to the asymmetric and symmetric C–H bending
vibrations of the methyl (CH3) structural unit in the T20
[24]. The other characteristic bands occurred at 3486
and 1734 cm−1 are assigned to the O–H vibration of the
hydroxyl group or adsorbed water and C=O stretching of the ester group, respectively. All these peaks were
seen to be shifted to lower wavenumber in the SWSBT20 nanocomposite (Fig. 1c), which show that significant interaction has taken place between T20 and SWSB.
Since the chemical structure of T80 (Fig. 1d) is similar to
that of T20, the relative intensities of those characteristic absorption bands are also observed in the SWSB-T80
nanocomposite (Fig. 1e).
Figure 1f and g are the FTIR spectra of pure PEG and
SWSB-PEG, respectively. The FTIR spectrum of PEG
(Fig. 1f ) demonstrates that the most intense absorption
band at 1104 cm−1 is due to the functional group of carbon oxygen (C–O) single bond of primary alcohol. The
peaks occurred at 3442, 1344 and 529 cm−1 are attributed
to the O–H stretching vibrations, while the absorptions
observed in the region 961 and 842 cm−1 correspond
to the C–C–O asymmetric stretch and C–C–O symmetric stretch, respectively. Also, the IR peaks at 2888
and 1470 cm−1 are due to the C–H stretching and bending vibrations in PEG [25]. For the case of SWSB-PEG
(Fig. 1g), some of the bands disappeared, and the others
were shifted to the lower frequency due to the chemical
interaction between the PEG and SWSB. For example,
the peak at 529 cm−1 due to the O–H vibration disappeared, and in addition, two new peaks were formed at
1451 and 1388 cm−1 which are assigned to the CH2 bending and COO− symmetric stretch, respectively.
The FTIR spectrum of pure CS (Fig. 1h) presents a
strong band at 3444 cm−1 indicative of asymmetric NH2
and O–H stretching vibration, while absorption bands at
2925, 1420 and 1384 cm−1 are due to typical C-H bond
in –CH2 and –CH3 symmetrical deformation mode,
respectively. The sharp band occurred at 1640 cm−1 is
related to the characteristic of carbonyl bonds (C=O) of
the amide group and the band at 1091 cm−1 corresponds
to the stretching vibrations of C–O from C–O–C bonds
[26]. In the spectrum of SWSB-CS (Fig. 1i), most of the
bands are belong to CS functional groups and the –OH
stretching frequency was seen to be shifted from 3444 to
3438 cm−1. This could be due to the ionic π bonds interaction between the CS and the nanotubes, which is consistent with previous report [27].
Raman
The Raman spectra of surface-coated SWSB are shown
in Fig. 2c–f, while the Raman spectra of SWCNT-COOH
and uncoated SWSB have also been included in Fig. 2a,
b for the purpose of comparison. There are three distinct bands to be observed in the Raman spectrum of
SWCNT-COOH. The presence of the R-band (radial
breathing mode) in the low frequency range between 100
and 300 cm−1 is dependent upon the tube diameter and
this region varies with different samples. In the first order
band region, two Raman bands are observed: the band
occurred at 1342 cm−1 is generally known as the disorder-induced D-band and a higher intensity band centered
at 1575 cm−1 is often called the tangential G-band. The
D-band is correlated with structural defects and disorder present in the graphitic sp2 carbon systems, whereas
G-band is closely related to the planar vibrational mode
of sp2-bonded carbon atoms on the graphitic surface
of the nanotubes [28]. The second order G’-band near
2650 cm−1, which appears in the phonon spectra of sp2
carbon-based materials, corresponds to the overtone of
the D-band. It is observed that the Raman spectra are
very similar for all samples (Fig. 2a–f ), suggesting that
Tan et al. Chemistry Central Journal (2016) 10:81
1000
3500
500
500
-1
Wavenumber (cm )
1091
946
1094
1079
1387
1716
2920
3438
(h)
3500
3000
1091
Chitosan
2925
1000
100
3444
529
842
961
1500
500
(i)
0
1104
1344
1282
1241
1470
2888
Polyethylene glycol
Transmittance (a.u.) (%)
1092
1451
1388
1722
1631
1576
2856
3432
3442
Transmittance (a.u.) (%)
(f)
3000
1000
Wavenumber (cm )
200
3500
1451
1500
-1
(g)
0
1458
1734
3000
1420
1384
1500
Wavenumber (cm )
100
Tween 80
0
-1
200
1350
1295
1639
2853
1724
1632
1574
2915
3436
3485
(d)
2856
528
Transmittance (a.u.) (%)
948
1167
100
2920
520
1096
1094
1348
1453
1458
(e)
1628
1577
3000
200
Tween 20
1640
0
3500
1350
1295
1247
2919
(a)
1704
1628
1571
100
1734
3486
200
1631
1573
2858
1726
3441
(b)
2912
2851
(c)
3433
Transmittance (a.u.) (%)
300
Page 5 of 12
1500
1000
500
-1
Wavenumber (cm
Fig. 1 FTIR spectra of (a) SWSB, (b) T20, (c) T20-coated SWSB, (d) T80, (e) T80-coated SWSB, (f) PEG, (g) PEG-coated SWSB, (h) CS and (i) CS-coated
SWSB along with their chemical structures
the nanotubes structure remains unmodified by the coating treatment of the polymers.
The degree of functionalization and imperfections
can be estimated by measuring the intensity ratio (ID/
IG) of the D and G-band of the nanotubes [12]. The
positions of D and G-bands as well as ID/IG ratios for
all samples are listed in Table 1. It is found that the ID/
IG ratio increases after functionalization with SB, and as
expected, this value was seen to be decreased gradually
after coating treatment. However, this is not the case for
CS-coated SWSB. This could be possibly due to the little
amount of CS used in the present study which resulted
in promoting more defects on the surface of the nanotubes when compared to the others. On the other hand,
it is observed that the Tween series have slightly lower
defect concentrations, indicating that both T20 and T80
have the best surface wrapping on SWSB. Furthermore,
it is worth to be noted that, the intensity ratio of ID/IG
changes slightly from 0.550 for SWSB to 0.231–0.602
for coated samples, suggesting that the coating process
occurred through a non-covalent interaction. This is
because a covalent functionalization would have significantly increased the ID/IG ratio to >1 [29].
Field emission scanning electron microscope (FESEM)
FESEM has been used to study the surface morphology
of the surface-coated SWSB nanocomposites (Fig. 3b–e),
with SWCNT-COOH used as the comparison (Fig. 3a).
SWCNT-COOH was seen to be appeared in bundles due
to van der Waals interaction with smooth tubular surface
Tan et al. Chemistry Central Journal (2016) 10:81
First order
band
Radial
band
Intensity (a.u.)
1600
Page 6 of 12
Second order
band
Drug release behaviour at pH 7.4
(b)
800
(a)
0
500
1000
1500
2000
2500
3000
Raman shift (cm-1)
3000
(f)
(e)
Intensity (a.u.)
defects of the nanotubes and hence, a more compact
structure of nanocomposites was observed. (e)
2000
(d)
1000
(c)
500
1000
1500
2000
2500
3000
3500
Raman shift (cm-1)
Fig. 2 Raman spectra of (a) SWCNT-COOH, (b) SWSB, (c) SWSB-T20,
(d) SWSB-T80, (e) SWSB-PEG and (f) SWSB-CS nanocomposites
Table 1 Peak positions of D and G-bands as well as ID/
IG ratios for SWCNT-COOH, SWSB and the surface-coated
nanocomposites
Sample
D-band (cm−1) G-band (cm−1) Intensity ratio
(ID/IG)
SWCNT-COOH
1342
1575
0.273
SWSB
1338
1575
0.550
SWSB-T20
1346
1579
0.231
SWSB-T80
1346
1579
0.241
SWSB-PEG
1342
1579
0.434
SWSB-CS
1342
1579
0.602
structure. After coating of the SWSB with polymers,
the surface morphologies of the nanotubes were significantly different from the starting material. Therefore, we
inferred that the polymers assist in the dispersion and
wrapping of the SWSB by covering most of the surface
In our previous work, we have demonstrated that the
system (SWSB) released SB in a pH-dependent fashion,
with the maximum release of approximately 84% in pH
7.4 as compared to 56% in pH 4.8. However, at the beginning stage of the drug release, we observed a fast release
near to 47% after 60 min and then followed by a slower
step of sustained release up to 1300 min. As an attempt to
reduce the initial burst, we have coated the system separately with different types of polymers and then study the
coating effect on the drug release behaviour in PBS solution at pH 7.4. Figure 4 illustrated the release profiles of
SB from the surface-coated SWSB nanocomposites, with
SB loading of 45%, based on the UV–Vis measurement.
After the coating process, the release rate of SB from
the coated nanocomposites (Fig. 4b–e) was significantly
lower than the release rate of SB from the uncoated ones
(Fig. 4a), with the amount of initial release reduced to
approximately 6–17% after 60 min. This is because the
surface coating molecules formed an additional layer by
wrapping around the nanotubes [30], providing extra
protection to the encapsulated SB from instant release
at pH 7.4 environment and as a result, the release rate
of SB was reduced. Due to the presence of the coating
agents, the release of SB from coated samples could still
be observed even after 3500 min with a slow and sustained release characteristic. As SB is a drug characterized by its relatively short elimination half-life of 4–6 h
[31] due to poor absorption in the body, hence, the slow
and sustained release behaviour of SB with a release time
of more than 48 h may greatly benefit the anticancer
treatment.
It is observed that the release behaviour of SB from the
surface-coated systems follows a specific order of SWSBPEG > SWSB-T80 > SWSB-CS > SWSB-T20, as demonstrated in Fig. 4b–e. Among the systems, SWSB-PEG was
found to exhibit the highest release rate due to the hydrophilic nature of the PEG molecules which enhances the
solubility of hydrophobic carriers (e.g. SWCNT-COOH)
and drugs (e.g. SB) in aqueous environment, as a result of
the steric hindrance [32]. Interestingly, remarkable differences were also noted in the release behaviour of SB from
the nanocomposites coated by Tween surfactants. For
example, SWSB-T80 demonstrated a higher release rate
of 91% compared to the release rate of 58% from SWSBT20 at the end of the experiment. This is because partial
hydrolysis of ester groups occurred at pH 7.4 which causes
the polymeric chains in T20 and T80 underwent ionization, thereby producing more charged –COO− groups.
The polymeric systems would then encounter different
Tan et al. Chemistry Central Journal (2016) 10:81
Page 7 of 12
Fig. 3 FESEM images of (a) SWCNT-COOH, (b) SWSB-T20, (c) SWSB-T80, (d) SWSB-PEG and (e) SWSB-CS at magnification 100 k×
extent of swelling due to the repulsion forces between the
ionized carboxyl groups [33], thus causing the drug molecules to be diffused through water-filled outermost layer
at a different rate. As for the SWSB-CS, the released SB
from the system was nearly 73%, even though it has the
least coating content of 4.6 wt% as measured by TGA
analysis. Under the neutral environment (pH 7.4), the
hydrophilic carboxyl groups from SWCNT-COOH will
Tan et al. Chemistry Central Journal (2016) 10:81
Page 8 of 12
100
Table
2
Linear regression analysis (R2) of samples
and their corresponding overall mean percent error (MPE)
obtained by fitting the SB release data from biocompatible surface-coated SWSB nanocomposites into PBS solution at pH 7.4
B
C
A
80
Model name
Equation
Sample
R2
Zero-order
qt = q0 + k0 t
SWSBa
0.9367 0.0172
SWSB-T20
0.9914 0.0662
80
SWSB-T80
0.6977 0.3247
60
SWSB-PEG 0.9631 0.3080
60
E
40
100
Release (%)
Release (%)
D
20
40
20
0
0
0
20
40
60
80
100
Time (min)
0
500
1000
1500
2000
2500
3000
Pseudo-firstorder
ln(qe - qt ) = ln qe − k1 t
3500
Time (min)
Fig. 4 Release profiles of SB from (A) SWCNT-COOH, (B) SWSB-PEG,
(C) SWSB-T80, (D) SWSB-CS and (E) SWSB-T20 at pH 7.4 with maximum release rate of 84, 99, 91, 73 and 58% respectively. Inset shows
the initial release of the nanocomposites at pH 7.4 in the first 100 min
MPE
SWSB-CS
0.9120 0.3926
SWSBa
0.9533 8.0461
SWSB-T20
0.9933 0.3574
SWSB-T80
0.9402 1.6279
SWSB-PEG 0.9797 1.6844
Pseudo-secondorder
t
qt
=
1
k2 q2e
+
t
qe
SWSB-CS
0.9720 0.9793
SWSBa
0.9983 1.0189
SWSB-T20
0.9903 1.5389
SWSB-T80
0.9856 0.3775
SWSB-PEG 0.9924 1.1613
be ionized [34], facilitating the release of SB from the surface of nanotubes into the CS thin coating. As a result,
the CS polymer swelled causing a constant slow diffusion
of SB molecules into the PBS medium. The in vitro drug
release experiments showed that the drug release behaviour can be altered by using various selections of biocompatible polymers to suit different therapeutic applications.
Higuchi
√
qt = KH t
SWSB-CS
0.9948 0.3431
SWSBa
0.9628 0.1231
SWSB-T20
0.9968 0.1841
SWSB-T80
0.8966 8.4337
SWSB-PEG 0.9774 3.0315
KorsmeyerPeppas
qt
q∞
= Kt n
SWSB-CS
0.9583 6.4891
SWSBa
0.9542 0.0067
SWSB-T20
0.9793 0.0071
Drug release kinetics and possible mechanisms
SWSB-T80
0.9283 0.0022
To study the release kinetics of SB, data obtained from
in vitro drug release experiments (Fig. 4) can be fitted
into five different mathematical kinetic models [35, 36] as
shown in Table 2.
Based on the release kinetics data listed in Table 2, the
pseudo-second-order kinetic model with the best linear
fit was found to be more appropriate for depicting the
release kinetic processes of SB from the surface-coated
nanocomposites (Fig. 5). This indicates that the rate limiting step may be chemisorption involving the exchange
of electrons between the surface-coated SWSB and the
anions in the PBS medium at time of release and that
released at equilibrium.
SWSB-PEG 0.9612 0.0028
Effects of surface‑coated SWSB on cell viability
Most cytotoxicity research in the literature has used the
concentration range of carbon nanotubes between 0.1
and 200 μg mL−1 with maximum incubation up to 96 h
on different types of normal cell lines [37–40]. This is
because carbon nanotubes is generally associated with a
concentration- and time-dependent increase in cell death
as investigated by the use of the MTT assay. Therefore,
in the present work, healthy 3T3 fibroblast cell line was
SWSB-CS
0.9053 0.0391
a
Release of SB was limited to 1300 min. qt, qe and q∞ refer to the amount of
drug released at time (t), at equilibrium and at infinite time. k0, k1, k2 and kH are
rate constant of the models
used to treat with various doses ranging from 3.125 to
100 μg mL−1 of surface-coated SWSB for 72 h and the
effect of polymer coatings on cell viability was evaluated
by MTT assay (Fig. 6).
Although a vast number of studies have demonstrated
that the surfactants and polymers are non-toxic, as they are
capable of enhancing dispersibility to promote biocompatibility, still, it is essential to investigate the effect of the conjugation on healthy cells. The cytotoxicity results showed
that the coating agents have tremendously improved the
biocompatibility of SWSB nanocomposites in comparison
with our previous findings [14], in which the non-coated
compounds demonstrated cytotoxicity when the concentration exceeded 25 μg mL−1. In particular, the uncoated
SWSB at concentration of 50 μg mL−1 showed 20.6% viability, whereas the coated SWSB showed 69.3, 66.2, 73.9 and
Tan et al. Chemistry Central Journal (2016) 10:81
Page 9 of 12
80
a SWSB
16
b SWSB-T20
70
14
60
12
50
t/qt
t/qt
10
8
30
6
20
4
10
2
0
40
0
0
200
400
600
800
1000
1200
1400
0
500
1000
1500
2000
2500
3000
3500
4000
4500
3000
3500
4000
4500
Time (minutes)
Time (minutes)
50
d SWSB-PEG
c SWSB-T80
50
40
40
30
t/qt
t/qt
30
20
20
10
10
0
0
500
1000
1500
2000
2500
3000
3500
4000
4500
0
0
500
1000
1500
2000
2500
Time (minutes)
Time (minutes)
e SWSB-CS
60
50
t/qt
40
30
20
10
0
0
500
1000
1500
2000
2500
3000
3500
4000
4500
Time (minutes)
Fig. 5 Fits of the release data of SB from (a) SWSB, (b) SWSB-T20, (c) SWSB-T80, (d) SWSB-PEG and (e) SWSB-CS at pH 7.4 using pseudo-secondorder kinetic model
Tan et al. Chemistry Central Journal (2016) 10:81
Page 10 of 12
SWSB-T20
120
SWSB-T80
SWSB-PEG
SWSB-CS
*
*
100
Cell V iability (%)
80
60
40
20
0
control
3.125
6.25
12.5
25
Concentration (μg
50
75
100
mL-1)
Fig. 6 Cell viability of 3T3 cell line treated with SWSB-T20, SWSB-T80, SWSB-PEG, and SWSB-CS for 72 h. Cell viability is calculated as a percentage
of absorbance of treated cells over absorbance of untreated cells. Data are shown as mean ± standard deviation from three separate experiments
(n = 3). Asterisks indicate statistically significant differences of the cell viability between the concentrations (p < 0.05)
77.3% viability for T20, T80, PEG, and CS, respectively.
However, it was seen that the surface-coated SWSB nanocomposites demonstrated a gradual decrease in the cell
viability as the concentration increases, with the lowest cell
viability of 54.7% observed in SWSB-PEG at concentration
of 100 μg mL−1. The low viability of PEG-coated SWSB
could be attributed to the toxic substances (i.e. monomer,
dimer, and trimer), impurities (e.g. fatty acids, catalyst residue, ethylene oxide) and by-product (e.g. 1,4-dioxane) present in the low-molecular-weight glycol used in this study
[41–43]. These in vitro results reveal that the surface coating agents expressed different level of cytotoxic effects to
the normal mouse fibroblast cells and therefore, further
investigation in terms of specific cellular mechanism is
deem necessary in order to elucidate the mode of interactions with normal human fibroblasts and cancer-associated
fibroblasts within different tumours.
Conclusions
We demonstrated the preparation of surface-coated
SWSB nanocomposites through a simple non-covalent method. In order to achieve better dispersion and
improved biocompatibility, T20, T80, PEG and CS were
used as a coating agent separately. FTIR and Raman studies confirmed the chemical interaction between the biocompatible polymers and SWSB. The release of SB from
the surface-modified system occurs only after water penetration in the polymeric outer layer, followed by diffusion process to the surface of the system. Furthermore,
the release of SB is correlated to the swelling characteristics of the surfactants. Despite the structural similarity
between T20 and T80, the mechanisms of release are distinctively different, with the higher release rate observed
in SWSB-T80 (~91%) compared to SWSB-T20 (~58%).
In addition, the released SB from the coated systems is
described by pseudo-second-order release mechanism,
and that the release fashion is a slow and sustained process which may benefit the anticancer treatment significantly. The in vitro cytotoxicity study shows that
the coating agents greatly enhanced the dispersibility
and biocompatibility of the SWSB, with an increase of
approximately 48.7% (SWSB-T20), 45.6% (SWSB-T80),
53.3% (SWSB-PEG), and 56.7% (SWSB-CS) viability at
50 μg mL−1 as compared to the uncoated ones. However
Tan et al. Chemistry Central Journal (2016) 10:81
with cell viability assays, it would be difficult to draw
accurate and reliable conclusions as these nanotubes
might potentially interfere with viability markers in the
assay systems, leading to a false positive or false negative
result of cell viability. As such, several different spectrophotometric assays such as lactate dehydrogenase (LDH)
leakage, water soluble tetrazolium salts (WST-1) and
[2,3-bis-(2-methoxy-4-nitro-5-sulfophenyl)-2H-tetrazolium-5-carboxanilide] (XTT) should be used in conjunction with MTT assay for this new class of nanomaterials.
Nonetheless, this work is a good preparation for our following research on the in vitro cellular mechanism study
to assess how they interact with cells.
Authors’ contributions
JMT carried out the synthesis and characterization of surface-coated SWSB
nanocomposites and prepared the manuscript. GK and SAG helped to conduct the MTT assay and JMT analyzed the data. SF and MZH supervised the
study and helped to review the manuscript. All authors read and approved
the final manuscript.
Author details
1
Materials Synthesis and Characterization Laboratory, Institute of Advanced
Technology (ITMA), Universiti Putra Malaysia, 43400 Serdang, Selangor, Malaysia. 2 Laboratory of Vaccine and Immunotherapeutics, Institute of Bioscience
(IBS), Universiti Putra Malaysia, 43400 Serdang, Selangor, Malaysia. 3 Department of Human Anatomy, Faculty of Medicine and Health Sciences, Universiti
Putra Malaysia, 43400 Serdang, Selangor, Malaysia.
Acknowledgements
The work was supported by the Ministry of Education of Malaysia (MOE) under
grant No. GP-IPB/2013/9425800. We thank our colleague, Saifullah Bullo (Ph.D)
for assistance with statistical analysis and insight that greatly improved the
manuscript.
Competing interests
The authors declare that they have no competing interests.
Received: 30 June 2016 Accepted: 1 December 2016
References
1. American Cancer Society (2015) Cancer facts & figures 2015. American
Cancer Society, Atlanta
2. Stewart BW, Wild CP (2014) World Cancer Report 2014. International
Agency for Research on Cancer, France
3. Li F, Ma Z, Guan Z, Chen Y, Wu K, Guo P, Wang X, He D, Zeng J (2015) Autophagy
induction by silibinin positively contributes to its anti-metastatic capacity via
AMPK/mTOR pathway in renal cell carcinoma. Int J Mol Sci 16:8415–8429
4. Narayanapillai S, Agarwal C, Deep G, Agarwal R (2014) Silibinin inhibits
ultraviolet B radiation-induced DNA-damage and apoptosis by enhancing interleukin-12 expression in JB6 cells and SKH-1 hairless mouse skin.
Mol Carcinog 53:471–479
5. Ge Y, Zhang Y, Chen Y, Li Q, Chen J, Dong Y, Shi W (2011) Silibinin causes
apoptosis and cell cycle arrest in some human pancreatic cancer cells. Int
J Mol Sci 12:4861–4871
6. Cheung CWY, Gibbons N, Johnson DW, Nicol DL (2010) Silibinin—a
promising new treatment for cancer. Anticancer Agents Med Chem
10:186–195
7. Gazak R, Walterova D, Kren V (2007) Silybin and silymarin—new and
emerging applications in medicine. Curr Med Chem 14:315–338
8. Madani SY, Naderi N, Dissanayake O, Seifalian AM (2011) A new era
of cancer treatment: carbon nanotubes as drug delivery tools. Int J
Nanomed 6:2963–2979
Page 11 of 12
9. Park S, Shin J, Lee J, Cha M (2012) Manipulation of NIH3T3 cells with functionalized single-walled carbon nanotubes under a magnetic field. Mater
Lett 68:378–381
10. Zheng X, Wang T, Jiang H, Li Y, Jiang T, Zhang J, Wang S (2013) Incorporation of carvedilol into PAMAM-functionalized MWNTs as a sustained drug
delivery system for enhanced dissolution and drug-loading capacity.
Asian J Pharm Sci 8:278–286
11. Heister E, Neves V, Tîlmaciu C, Lipert K, Beltrán VS, Coley HM, Silva SRP,
McFadden J (2009) Triple functionalization of single-walled carbon nanotubes with doxorubicin, a monoclonal antibody, and a fluorescent marker
for targeted cancer therapy. Carbon 47:2152–2160
12. Kaur P, Shin MS, Joshi A, Kaur N, Sharma N, Park JS, Sekhon SS
(2013) Interactions between multiwall carbon nanotubes and
poly(diallyldimethylammonium) chloride: effect of the presence of a
surfactant. J Phys Chem B 117:3161–3166
13. Heister E, Neves V, Lamprecht C, Silva SRP, Coley HM, McFadden J (2012)
Drug loading, dispersion stability, and therapeutic efficacy in targeted
drug delivery with carbon nanotubes. Carbon 50:622–632
14. Tan JM, Karthivashan G, Arulselvan P, Fakurazi S, Hussein MZ (2014) In vitro
nanodelivery of silibinin as an anticancer drug under pH response. J Drug
Del Sci Tech 24:579–584
15. Patlolla A, Knighten B, Tchounwou P (2010) Multi-walled carbon nanotubes induce cytotoxicity, genotoxicity and apoptosis in normal human
dermal fibroblast cells. Ethn Dis 20(1 Suppl 1):S1
16. Tian F, Cui D, Schwarz H, Estrada GG, Kobayashi H (2006) Cytotoxicity
of single-wall carbon nanotubes on human fibroblasts. Toxicol In Vitro
20:1202–1212
17. Shinde A, Tsai C (2015) Toxicity mechanism in fetal lung fibroblast cells
for multi-walled carbon nanotubes defined by chemical impurities and
dispersibility. Toxicol Res. doi:10.1039/C5TX00211G
18. Gabbiani G, Ryan GB, Majne G (1971) Presence of modified fibroblasts in
granulation tissue and their possible role in wound contraction. Experientia 27(5):549–555
19. Cirri P, Chiarugi P (2011) Cancer associated fibroblasts: the dark side of the
coin. Am J Cancer Res 1(4):482–497
20. Tan JM, Karthivashan G, Abd Gani S, Fakurazi S, Hussein MZ (2016)
Biocompatible polymers coated on carboxylated nanotubes functionalized with betulinic acid for effective drug delivery. J Mater Sci Mater Med
27:26
21. Wen Z, Dumas TE, Schrieber SJ, Hawke RL, Fried MW, Smith PC (2008)
Pharmacokinetics and metabolic profile of free, conjugated, and total
silymarin flavonolignans in human plasma after oral administration of
milk thistle extract. Drug Metab Dispos 36:65–72
22. Lorenz D, Lucker PW, Mennicke WH, Wetzelsberger N (1984) Pharmacokinetic studies with silymarin in human serum and bile. Methods Find Exp
Clin Pharmacol 6:655–661
23. Guo Z, Xiong J, Yang M, Xiong S, Chen J, Wu Y, Fan H, Sun L, Wang J,
Wang H (2010) Dispersion of nano-TiN powder in aqueous media. J Alloy
Compd 493:362–367
24. Ratanajiajaroen P, Watthanaphanit A, Tamura H, Tokura S, Rujiravanit R
(2012) Release characteristic and stability of curcumin incorporated in
β–chitin non-woven fibrous sheet using Tween 20 as an emulsifier. Eur
Polym J 48:512–523
25. Shameli K, Ahmad M, Jazayeri SD, Sedaghat S, Shabanzadeh P, Jahangirian H, Mahdavi M, Abdollahi Y (2012) Synthesis and characterization of
polyethylene glycol mediated silver nanoparticles by the green method.
Int J Mol Sci 13:6639–6650
26. Silva SML, Braga CRC, Fook MVL, Raposo CMO, Carvalho LH, Canedo EL
(2012) Application of infrared spectroscopy to analysis of chitosan/clay
nanocomposites. In: Infrared spectroscopy—materials science, engineering and technology. InTech. />infrared-spectroscopy-materials-science-engineering-andtechnology/
application-of-infrared-spectroscopy-to-analysis-of-chitosan-clay-nanocomposites. Accessed 1 July 2015
27. Venkatesan J, Jayakumar R, Mohandas A, Bhatnagar I, Kim SK (2014)
Antimicrobial activity of chitosan-carbon nanotube hydrogels. Materials
7:3946–3955
28. Kim UJ, Furtado CA, Liu X, Chen G, Eklund PC (2005) Raman and IR spectroscopy of chemically processed single-walled carbon nanotubes. J Am
Chem Soc 127:15437–15445
Tan et al. Chemistry Central Journal (2016) 10:81
29. Castillo JJ, Rindzevicius T, Novoa LV, Svendsen WE, Rozlosnik N, Boisen A,
Escobar P, Martínez F, Castillo-León J (2013) Non-covalent conjugates of
single-walled carbon nanotubes and folic acid for interaction with cells
over-expressing folate receptors. J Mater Chem B 1:1475–1481
30. O’Connell MJ, Boul P, Ericson LM, Huffman C, Wang Y, Haroz E, Kuper C,
Tour J, Ausman KD, Smalley RE (2001) Reversible water-solubilization of
single-walled carbon nanotubes by polymer wrapping. Chem Phys Lett
342:265–271
31. Weyhenmeyer R, Mascher H, Birkmayer J (1992) Study on dose-linearity of
the pharmacokinetics of silibinin diastereomers using a new stereospecific assay. Int J Clin Pharmacol Ther Toxicol 30:134–138
32. Knop K, Hoogenboom R, Fischer D, Schubert US (2010) Poly(ethylene
glycol) in drug delivery: pros and cons as well as potential alternatives.
Angew Chem Int Ed 49:6288–6308
33. Muzzalupo R, Tavano L, Cassano R, Trombino S, Cilea A, Picci N (2010)
Colon-specific devices based on methacrylic functionalized Tween
monomer networks: swelling studies and in vitro drug release. Eur Polym
J 46:209–216
34. Shieh YT, Liu GL, Wu HH, Lee CC (2007) Effects of polarity and pH on the
solubility of acid-treated carbon nanotubes in different media. Carbon
45:1880–1890
35. Hussein-Al-Ali SH, Arulselvan P, Fakurazi S, Hussein MZ (2014) The in vitro
therapeutic activity of betulinic acid nanocomposite on breast cancer
cells (MCF-7) and normal fibroblast cell (3T3). J Mater Sci 49:8171–8182
36. Dash S, Murthy PN, Nath L, Chowdhury P (2010) Kinetic modelling on
drug release from controlled drug delivery systems. Acta Pol Pharm
67:217–223
Page 12 of 12
37. Esfandiary E, Valiani V, Hashemibeni B, Moradi I, Narimani M (2014) The
evaluation of toxicity of carbon nanotubes on the human adiposederived-stem cells in-vitro. Adv Biomed Res 3:40
38. Zhang D, Yi C, Zhang J, Chen Y, Yao X, Yang M (2007) The effects of carbon
nanotubes on the proliferation and differentiation of primary osteoblasts.
Nanotechnology 18:475102
39. Sayes CM, Liang F, Hudson JL, Mendez J, Guo W, Beach JM, Moore VC,
Doyle CD, West JL, Billups WE, Ausman KD, Colvin VL (2006) Functionalization density dependence of single-walled carbon nanotubes cytotoxicity
in vitro. Toxicol Lett 161:135–142
40. Zeinabad HA, Zarrabian A, Saboury AA, Alizadeh AM, Falahati M (2016)
Interaction of single and multi wall carbon nanotubes with the biological
systems: tau protein and PC12 cells as targets. Sc Rep 6:26508
41. Herold DA, Rodeheaver GT, Bellamy WT, Fitton LA, Bruns DE, Edlich
RF (1982) Toxicity of topical polyethylene glycol. Toxicol Appl Pharm
65:329–335
42. Beasley VR, Buck WB (1980) Acute ethylene glycol toxicosis: a review. Vet
Hum Toxicol 22:255–263
43. Fruijtier-Pölloth C (2005) Safety assessment on polyethylene glycols
(PEGs) and their derivatives as used in cosmetic products. Toxicology
214:1–38